Russia History In 1922 , the


russia.pptx
- Размер: 2.6 Мб
- Автор:
- Количество слайдов: 19
Описание презентации Russia History In 1922 , the по слайдам
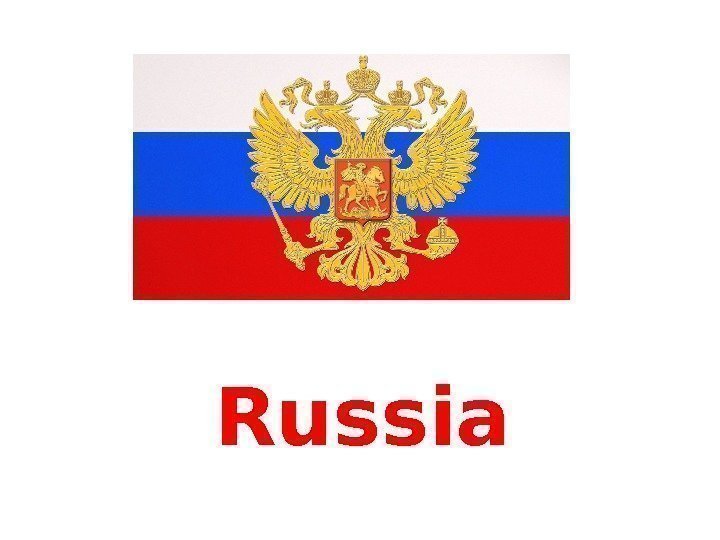
 Russia
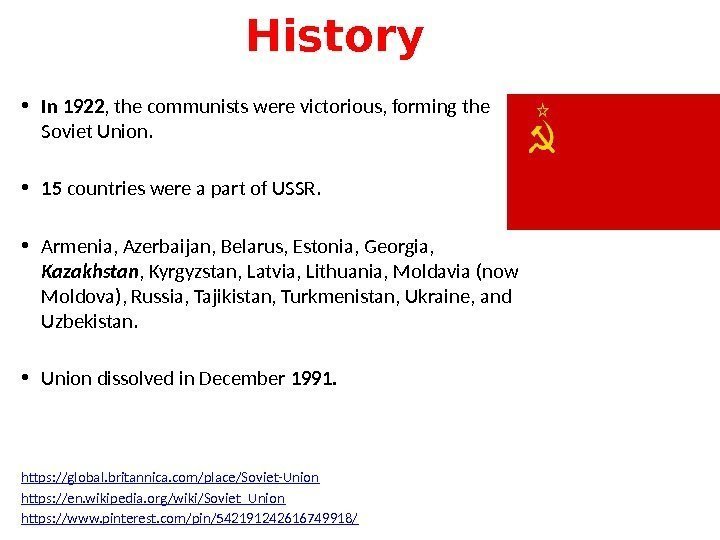
 History • In 1922 , the communists were victorious, forming the Soviet Union. • 15 countries were a part of USSR. • Armenia, Azerbaijan, Belarus, Estonia, Georgia, Kazakhstan , Kyrgyzstan, Latvia, Lithuania, Moldavia (now Moldova), Russia, Tajikistan, Turkmenistan, Ukraine, and Uzbekistan. • Union dissolved in December 1991. https: //global. britannica. com/place/Soviet-Union https: //en. wikipedia. org/wiki/Soviet_Union https: //www. pinterest. com/pin/542191242616749918/
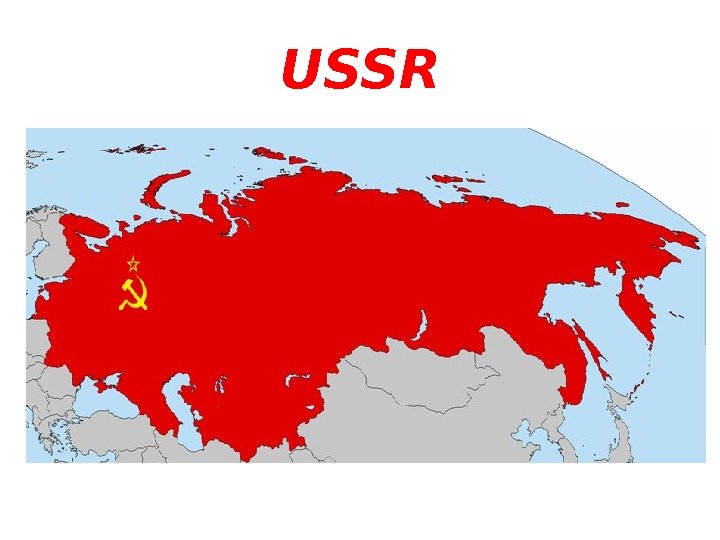
 USSR
USSR
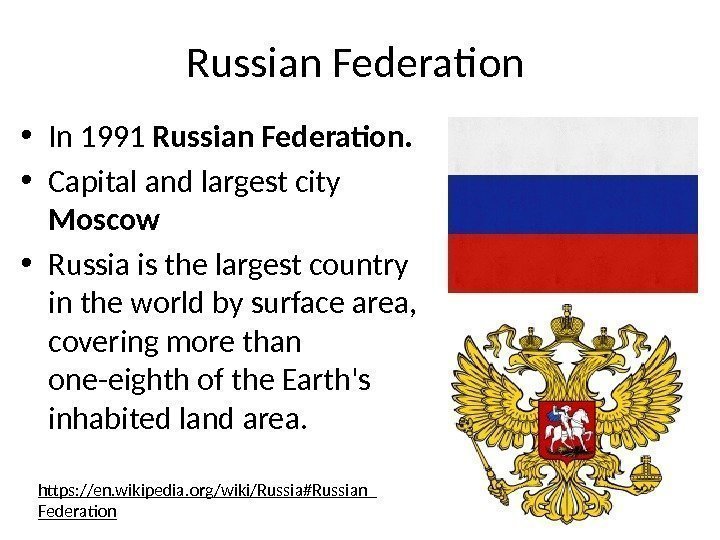
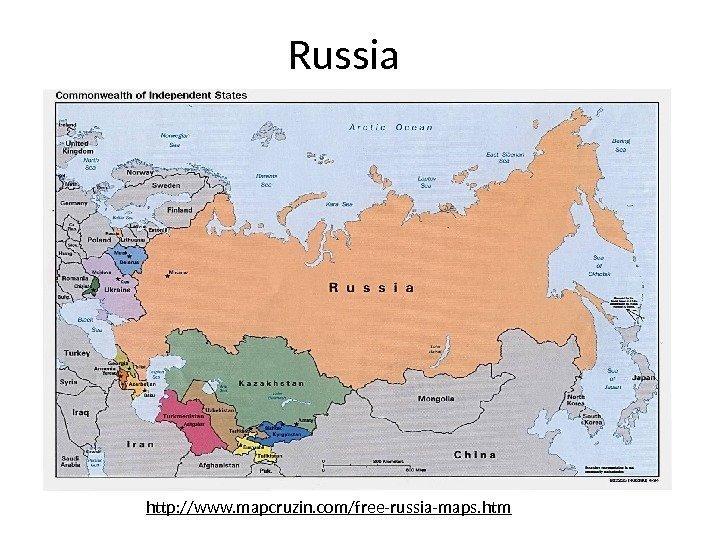
 Russian Federation • In 1991 Russian Federation. • Capital and largest city Moscow • Russia is the largest country in the world by surface area, covering more than one-eighth of the Earth’s inhabited land area. https: //en. wikipedia. org/wiki/Russia#Russian_ Federation
 Russia http: //www. mapcruzin. com/free-russia-maps. htm
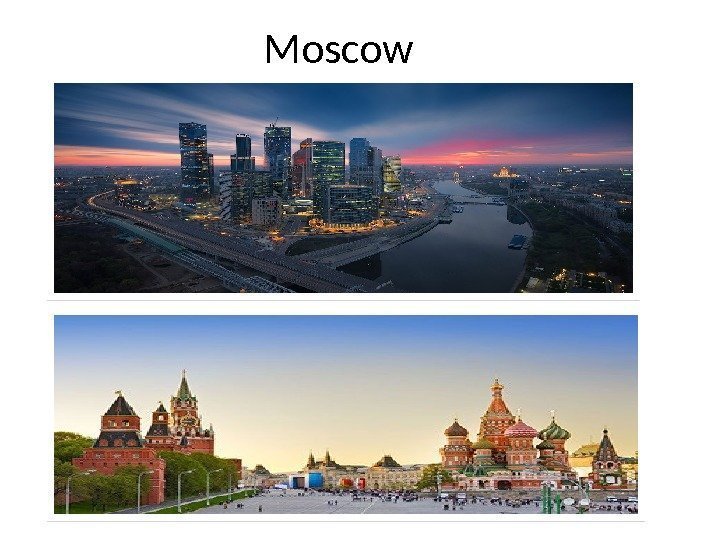
 Moscow
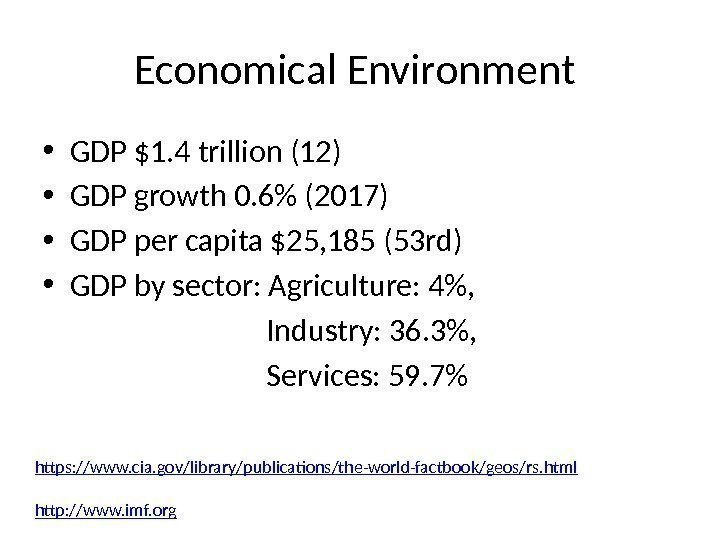
 Economical Environment • GDP $1. 4 trillion (12) • GDP growth 0. 6% (2017) • GDP per capita $25, 185 (53 rd) • GDP by sector: Agriculture: 4%, Industry: 36. 3%, Services: 59. 7% https: //www. cia. gov/library/publications/the-world-factbook/geos/rs. html http: //www. imf. org
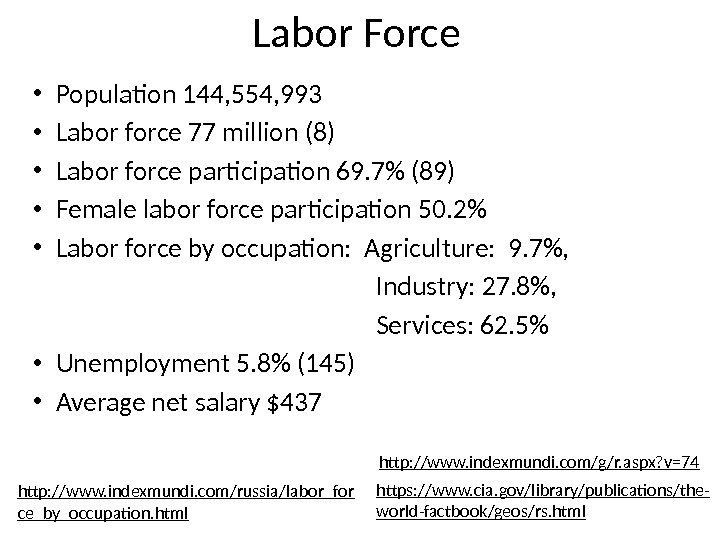
 Labor Force • Population 144, 554, 993 • Labor force 77 million (8) • Labor force participation 69. 7% (89) • Female labor force participation 50. 2% • Labor force by occupation: Agriculture: 9. 7%, Industry: 27. 8%, Services: 62. 5% • Unemployment 5. 8% (145) • Average net salary $437 http: //www. indexmundi. com/russia/labor_for ce_by_occupation. html https: //www. cia. gov/library/publications/the- world-factbook/geos/rs. html http: //www. indexmundi. com/g/r. aspx? v=
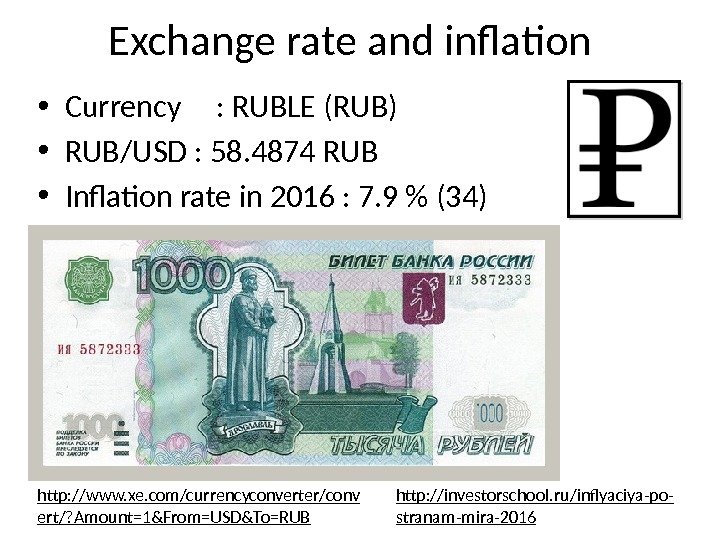
 Exchange rate and inflation • Currency : RUBLE (RUB) • RUB/USD : 58. 4874 RUB • Inflation rate in 2016 : 7. 9 % (34) http: //www. xe. com/currencyconverter/conv ert/? Amount=1&From=USD&To=RUB http: //investorschool. ru/inflyaciya-po- stranam-mira-
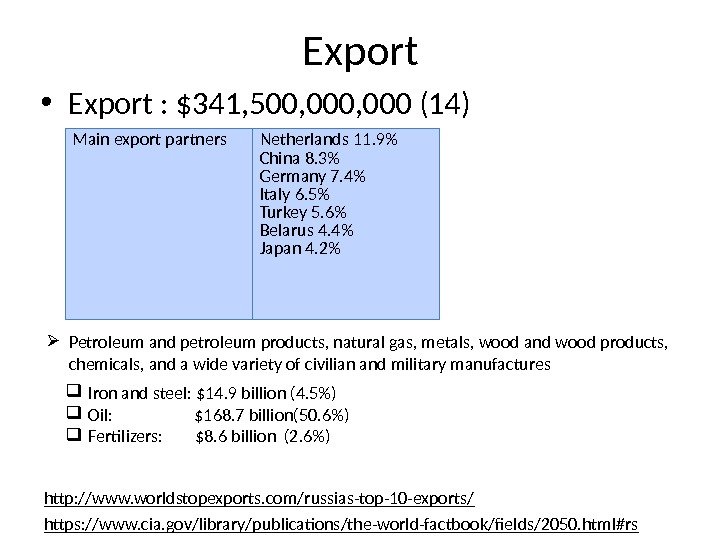
 Export • Export : $341, 500, 000 (14) Main export partners Netherlands 11. 9% China 8. 3% Germany 7. 4% Italy 6. 5% Turkey 5. 6% Belarus 4. 4% Japan 4. 2% https: //www. cia. gov/library/publications/the-world-factbook/fields/2050. html#rs Petroleum and petroleum products, natural gas, metals, wood and wood products, chemicals, and a wide variety of civilian and military manufactures Iron and steel: $14. 9 billion (4. 5%) Oil: $168. 7 billion(50. 6%) Fertilizers: $8. 6 billion (2. 6%) http: //www. worldstopexports. com/russias-top-10 -exports/
 Gazprom • Gazprom is a large Russian company which carries on the business of extraction, production, transport, and sale of natural gas. • Revenue $ 106. 3 billion • Gazprom delivers gas to 25 European countries , the only major exceptions being Spain and Portugal. • The European Union receives about 25 percent of its gas supply from Gazprom.
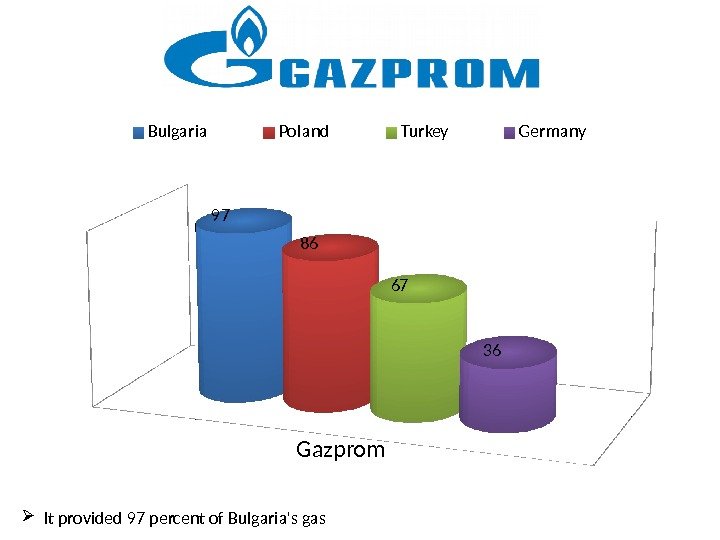
 Gazprom 97 86 67 36 Bulgaria Poland Turkey Germany It provided 97 percent of Bulgaria’s gas
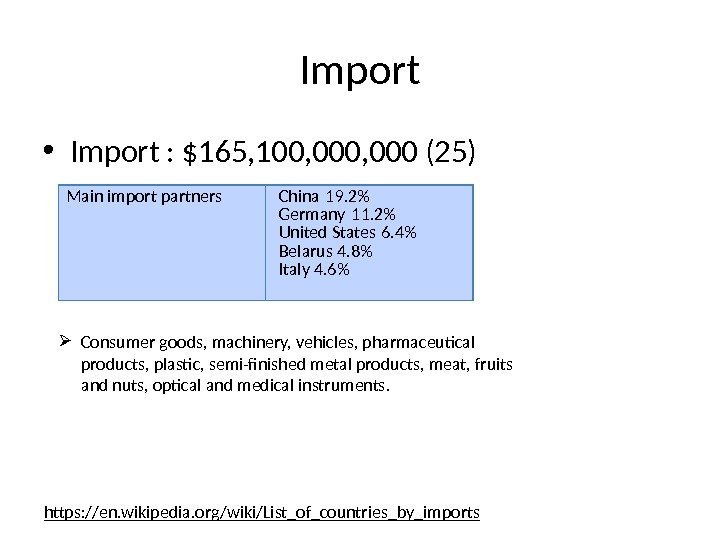
 Import • Import : $165, 100, 000 (25) https: //en. wikipedia. org/wiki/List_of_countries_by_imports Main import partners China 19. 2% Germany 11. 2% United States 6. 4% Belarus 4. 8% Italy 4. 6% Consumer goods, machinery, vehicles, pharmaceutical products, plastic, semi-finished metal products, meat, fruits and nuts, optical and medical instruments.
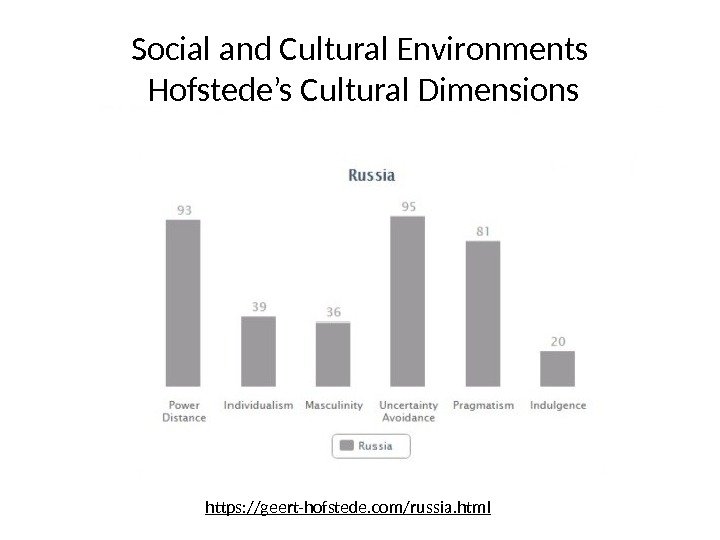
 Social and Cultural Environments Hofstede’s Cultural Dimensions https: //geert-hofstede. com/russia. html
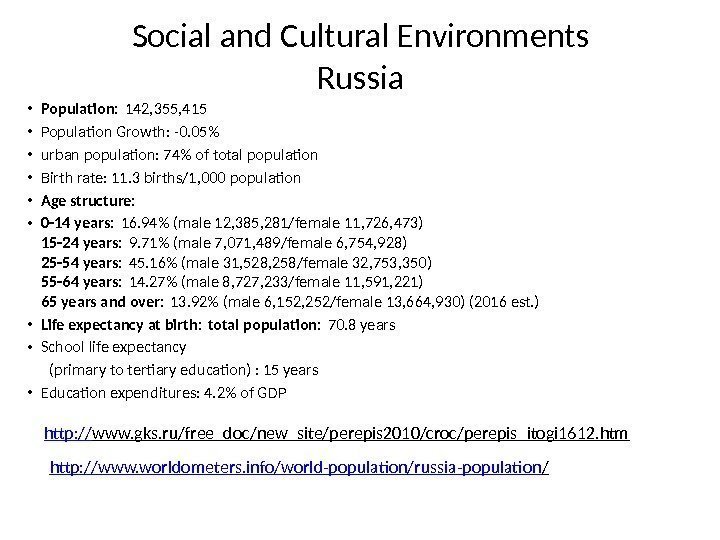
 Social and Cultural Environments Russia • Population: 142, 355, 415 • Population Growth: -0. 05% • urban population: 74% of total population • Birth rate: 11. 3 births/1, 000 population • Age structure: • 0 -14 years: 16. 94% (male 12, 385, 281/female 11, 726, 473) 15 -24 years: 9. 71% (male 7, 071, 489/female 6, 754, 928) 25 -54 years: 45. 16% (male 31, 528, 258/female 32, 753, 350) 55 -64 years: 14. 27% (male 8, 727, 233/female 11, 591, 221) 65 years and over: 13. 92% (male 6, 152, 252/female 13, 664, 930) (2016 est. ) • Life expectancy at birth: total population: 70. 8 years • School life expectancy (primary to tertiary education) : 15 years • Education expenditures: 4. 2% of GDP http: //www. worldometers. info/world-population/russia-population / http: // www. gks. ru/free_doc/new_site/perepis 2010/croc/perepis_itogi 1612. htm
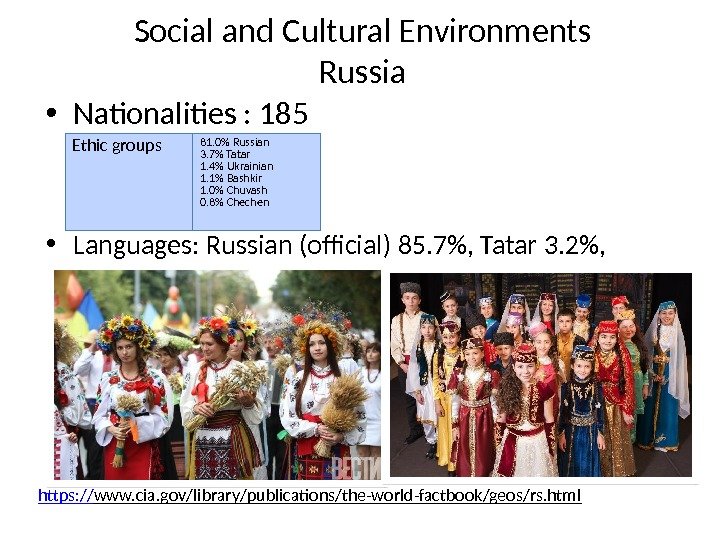
 Social and Cultural Environments Russia • Nationalities : 185 • Languages: Russian (official) 85. 7%, Tatar 3. 2%, Chechen 1%, other 10. 1% https: // www. cia. gov/library/publications/the-world-factbook/geos/rs. html Ethic groups 81. 0% Russian 3. 7% Tatar 1. 4% Ukrainian 1. 1% Bashkir 1. 0% Chuvash 0. 8% Chechen
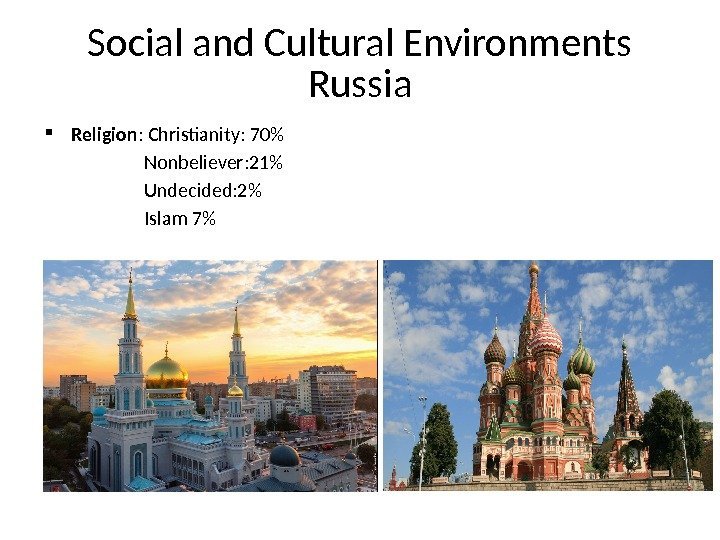
 Social and Cultural Environments Russia Religion : Christianity: 70% Nonbeliever: 21% Undecided: 2% Islam 7%
 Russia


