27bf79d23ea846d3b6dfde8088aa3acf.ppt
- Количество слайдов: 28


ROLE OF POLICE IN SOCIETY Presentation by Rauf Ul Hassan IPS IGP Armed/IRP Kashmir, Srinagar

CRIME STATISTICS AT A GLANCE (Source: National Crime records Bureau, Ministry of Home Affairs, Government of India)
 UNDER DIFFERENT CRIME HEADS DURING 1953 2011 S No")
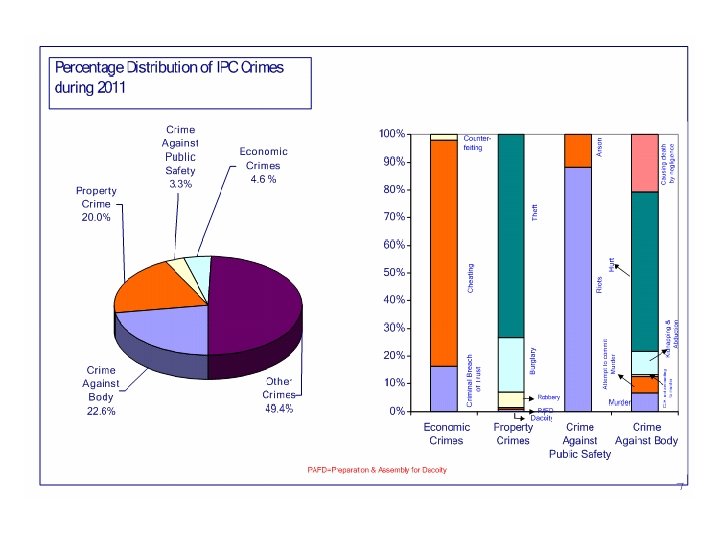
INCIDENCE OF COGNIZABLE CRIMES (IPC) UNDER DIFFERENT CRIME HEADS DURING 1953 2011 S No Year Murder Attempt t o commit murder CH. Not amounting to Murder Rape Kidnappin g & Ab du cti on Dacoit y Preparation and asse mbly for Dacoity Robbery Burglary (House Breaking) Theft Riots (1) (2) (3) (4) (5) (6) (7) (8) (9) (10) (11) (12) (13) 1. 1953 9802 5261 5579 8407 147379 256567 20529 2. 1954 9765 5514 5396 7600 132457 223866 22777 3. 1955 9700 5529 4779 6710 121744 212028 23609 4. 1956 10025 5905 5397 7618 134556 236214 24700 5. 1957 10419 5821 5560 7408 129632 233239 23750 6. 1958 10661 6043 4658 7120 124695 236103 24942 7. 1959 10712 6549 3774 6267 118205 233052 26987 8. 1960 10910 6024 3981 6263 114540 228842 26890 9. 1961 11188 6698 4213 6428 122605 232868 27199 9647 1119 3 18402 165807 335204 64114 13833 1462 6 422059 11036 1 20079 1083 1 362928 10530 9 10. 1971 16180 2357 2487 11. 1981 22727 3272 5409 12. 1991 13. 39174 29778 4243 10410 1393 22996 26428 157540 132087
 UNDER DIFFERENT CRIME HEADS DURING 1953 2011 S N")
INCIDENCE OF COGNIZABLE CRIMES (IPC) UNDER DIFFERENT CRIME HEADS DURING 1953 2011 S N o Crimin al Breach of Trust (2) Cheatin g (14) Counte r feiting (15) Arso n (16) Hurt (17) Dowr y death s Mole s tation Sexual Harassme nt (1 ) Yea r (18) (19) (20) Cruelty by Husban d Import a tion of Girls Causing Death by Negligenc e Other IPC crimes Total Cognizabl e Crimes under IPC (23) (24) (25) (26) (21) (22) 1 195 3 148440 601964 2 195 4 15860 9934 815 122929 556912 3 195 5 14644 9461 597 126435 535236 4 195 6 15466 9519 596 135221 585217 5 195 7 15362 9388 629 140163 581371 6 195 8 16017 9503 555 173887 614184 7 195 9 15878 9677 443 188772 620326 8 196 0 15862 9207 554 183294 606367 9 196 1 16895 9511 485 187561 625651 1 0 197 1 20270 11412 641 299711 952581 1 198 20579 17764 1004 582265 1385757
![Incidence of total cognizable crimes (IPC) 1953 2011 Incidence 2500000 ]2000000 1500000 1000000 500000](https://present5.com/presentation/27bf79d23ea846d3b6dfde8088aa3acf/image-5.jpg "Incidence of total cognizable crimes (IPC) 1953 2011 Incidence 2500000 ]2000000 1500000 1000000 500000")
Incidence of total cognizable crimes (IPC) 1953 2011 Incidence 2500000 ]2000000 1500000 1000000 500000
 AND SPECIAL")
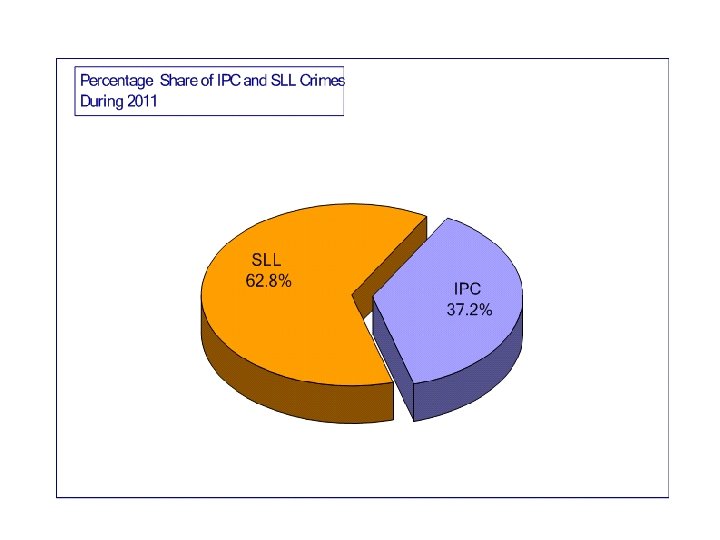
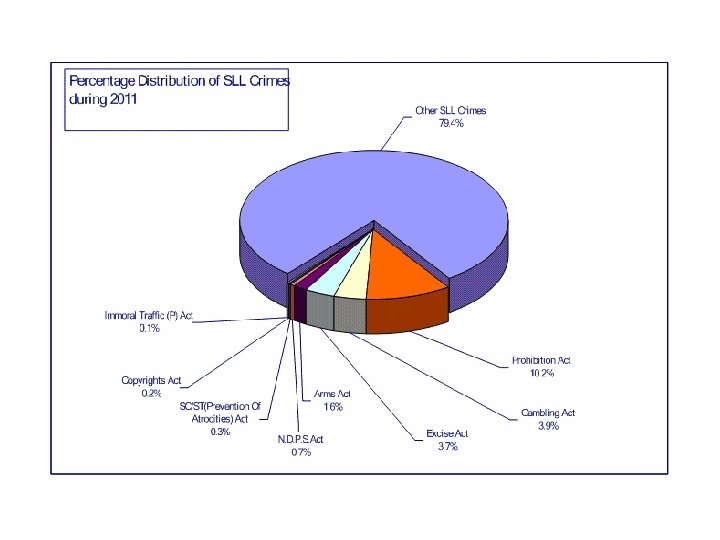
INCIDENCE & RATE OF TOTAL COGNIZABLE CRIMES UNDER INDIAN PENAL CODE (IPC) AND SPECIAL AND LOCAL LAWS (SLL) (2001 -2011) S No Year Estimated Mid-year population (in lacs) IPC Incidence SLL Total IPC Rate SLL Total Percentage of IPC Crimes to total Cognizable Crimes 1 2 3 4 5 6 7 8 9 10 11 2001** 2002 2003 2004 2005 2006 2007 2008 2009 2010 2011** 10270 10506 10682 10856 11028 11198 11366 11531 11694 11858 12102 1769308 1780330 1716120 1832015 1822602 1878293 1989673 2093379 2121345 2224831 2325575 3575230# 3746198 3778694 4196766 3203735 3224167 3743734 3844725@ 4553872** 4525917 3927154 5344538 5526528 5494814 6028781 5026337 5102460 5733407 5938104 6675217 6750748 6252729 172. 3 169. 5 160. 7 168. 8 165. 3 167. 7 175. 1 181. 5 181. 4 187. 6 192. 2 348. 1 356. 6 353. 7 386. 6 290. 5 287. 9 329. 4 333. 4 389. 4 381. 7 324. 5 520. 4 526. 0 514. 4 555. 3 455. 8 455. 7 504. 5 515. 0 570. 8 569. 3 516. 7 33. 1 32. 2 31. 2 30. 4 36. 3 36. 8 34. 7 35. 3 31. 8 33. 0 37. 2 12 Percentage change in 2011 over 2010 17. 8 31. 4 9. 8 17. 0 11. 5 -6. 8 -0. 7 12. 3 13 Compound growth rate per annum 1. 6 3. 0 1. 6 2. 2 1. 4 0. 0 0. 5 0. 9 * Source Registrar General of India ** Actual population as per 2001 census & 2011* (Provisional) # Excluding Jharkhand State ## Variation in SLL Crimes due to exclusion of large number of non-cognizable crimes under SLL by Kolkata city @ Andhra Pradesh excluded Motor Vehicle Act (Non-cognizable cases from the year-2008)

CRIME AGAINST WOMEN

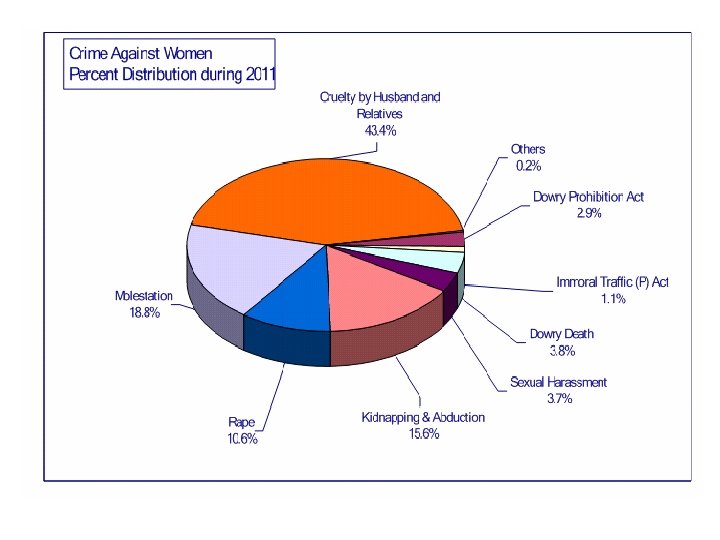
Crime Head-Wise Incidents of Crime Against Women during 2007 -2011 and percentage variation in 2011 over 2010 Sl. No Year Crime Head Percentage variation in 2011 over 2010 2007 1. 2. 3. Rape (Sec. 376 IPC) Kidnapping & Abduction(Sec. 363 to 373 IPC) Dowry Death (Sec. 302 / 304 ipc) Cruelty By Husband Relatives 4. 5. (Sec. 498 A IPC) Molestation (Sec. 354 ipc) 6. Sexual Harassment (Sec. 509 ipc) 7. Importation of Girls (Sec. 366 b ipc) 8. 9. Sati Prevention Act, 1987 Immoral Traffic (Prevention) Act, 1956 2008 2009 2010 2011 20, 737 21, 467 21, 397 22, 172 24, 206 9. 2 20, 416 22, 939 25, 741 29, 795 35, 565 19. 4 8, 093 8, 172 8, 383 8, 391 8, 618 2. 7 75, 930 81, 344 89, 546 94, 041 99, 135 5. 4 38, 734 40, 413 38, 711 40, 613 42, 968 5. 8 10, 950 12, 214 11, 009 9, 961 8, 570 -14. 0 61 67 48 36 80 122. 2 0 1 0 0 1 100. 0 3, 568 2, 659 2, 474 2, 499 2, 435 -2. 6 1, 200 1, 025 845 895 453 -49. 4 5, 623 5, 555 5, 650 5, 182 6, 619 27. 7 1, 85, 312 1, 95, 856 2, 03, 804 2, 13, 585 2, 28, 650 7. 1 Indecent Representation of Women (Prohibition) Act, 10. 1986 11. Dowry Prohibition Act, 1961 Total

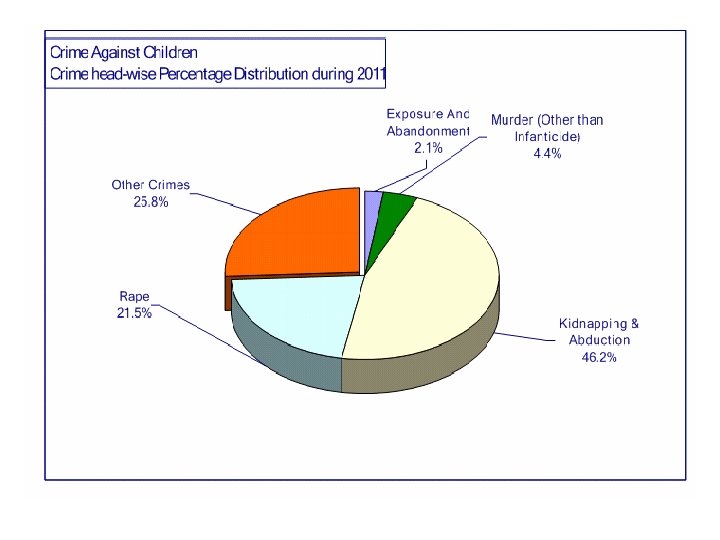
CRIME AGAINST CHILDREN

Crime against children in the country and percentage variation in 2011 over 2010 S. No Crime Head YEAR % Variation in 2009 2010 2011 over 2010 (3) (4) (5) (6) 1, 488 1, 408 1, 451 3 63 100 63 37 (1) (2) 1. Murder (Section 302) IPC 2. Infanticide (Section 315 IPC) 3. Rape (Section 376 IPC) 5, 368 5, 484 7112 30 4. Kidnapping & Abduction (Sec 360 to 369 IPC) 8, 945 10, 670 15284 43 5. Foeticide (Section 315 IPC) 123 111 132 19 6. Abetment of Suicide (Section 305 IPC) 46 56 61 9 7. Exposure & Abandonment (Sec 317 IPC) 857 725 700 3 8. Procuration of Minor Girls (Sec 366 A IPC) 237 679 862 27 9. Buying of Girls for Prostitution (Sec 373 IPC) 32 78 27 65 10. Selling of Girls for Prostitution (Sec 372 IPC) 57 130 113 13 11. Other Crimes (including Prohibition of Child Marriage Act 2006) 6, 985 7, 253 7293 1 24, 201 26, 694 33, 098 24 Total

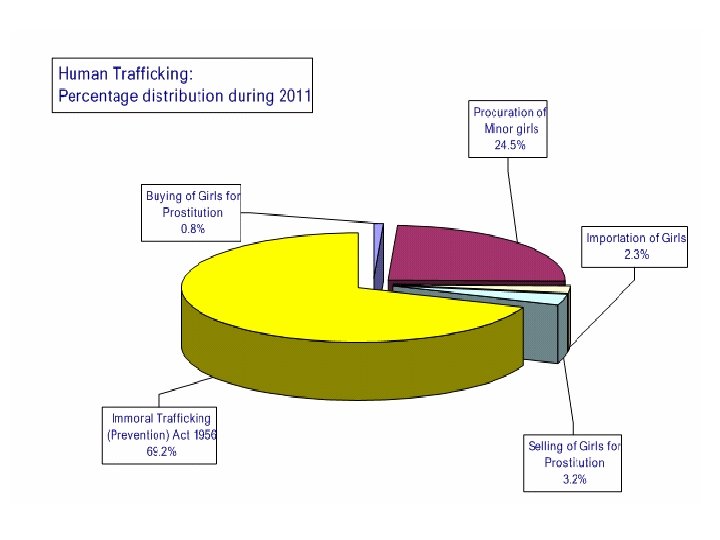
HUMAN TRAFFICKING

Crime Head Wise incidence of various Crimes under Human Trafficking during 2007 – 2011 and percentage variation in 2011 over 2010 Sl. No. 1. Crime Head Year Percentage in 2011 variation 2011 over 2010 2007 Procuration of Minor Girls (Sec. 366 A IPC) 2. Importation of Girls (Sec. 366 B IPC) 2008 2009 2010 253 224 237 679 862 27. 0 61 67 48 36 80 122. 2 3. Selling of Girls for Prostitution (Sec. 372 IPC) 69 49 57 130 113 13. 1 4. Buying of Girls for Prostitution (Sec. 373 IPC) 40 30 32 78 27 65. 4 5. Immoral Trafficking (Prevention) Act 1956 3, 568 2, 659 2, 474 2, 499 2, 435 2. 6 3, 991 3, 029 2, 848 3, 422 3, 517 2. 8 Total

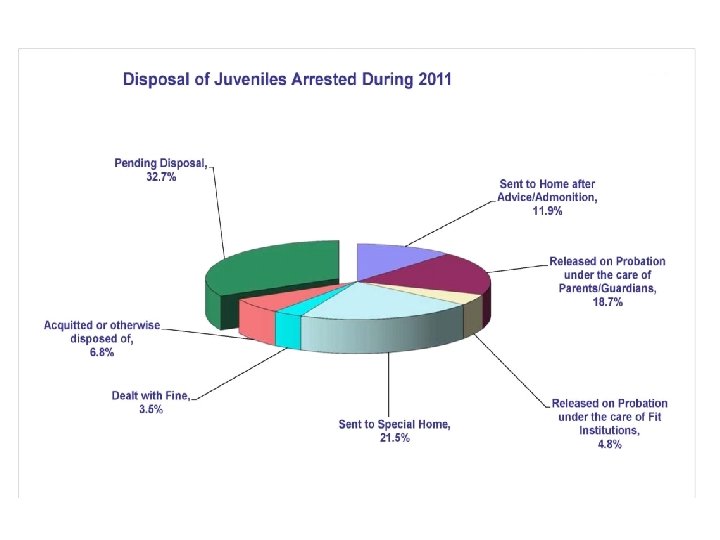
JUVENILE DELINQUENCY
 (2)")
Disposal of IPC Crime cases by Police Decadal picture S. NO. YEAR (1) (2) 1 Total No. of Cases for Investigation (including pending cases) No. of cases investigated Found F/NC/MF # Charge Sheeted (3) (4) 1971 1138588 83663 2 1981 1692060 3 1991 4 Percentage of cases Total True cases@ (5) Total* (Col. 4+6) Investi gated (Col. 7 *100/ Col. 3) Charge Sheeted (Col. 5*100/ Col. 6) (8) (9) (6) (7) 428382 810691 894354 78. 5 52. 8 127655 740881 1208339 1335994 79. 0 61. 3 2075718 118626 1091579 1530861 1649487 79. 5 71. 3 2001 2238379 105019 1303397 1658258 1763277 78. 8 78. 6 5 2002 2246845 116913 1335792 1670339 1787252 79. 5 80. 0 6 2003 2169268 105383 1271504 1586562 1691945 78. 0 80. 1 7 2004 2303354 103249 1317632 1651944 1755193 76. 2 79. 8 8 2005 2365658 100183 1367268 1693652 1793835 75. 8 80. 7 9 2006 2447063 101372 1374282 1704802 1806174 73. 8 80. 6 10 2007 2626687 123434 1475711 1841411 1964845 74. 8 80. 1 11 2008 2752687 122211 1547188 1939738 2061949 74. 9 79. 8 12 2009 2808468 126677 1505951 1920143 2046820 72. 9 78. 4 13 2010 2985719 134997 1598272 2021260 2156257 72. 2 79. 1 14 2011 3146326 142804 1689881 2144193 2286997 72. 7 78. 8 #F/NC/MF False / Non Cognizable / Mistake of fact. *Excluding cases where investigation was refused; @ Cases charge sheeted + Final report submitted.
 Sl. No. (1) Year (2)")
Disposal of IPC Crime Cases by Courts (Decadal picture) Sl. No. (1) Year (2) Total No. of Cases for Trial (Including Pending Cases) No. of Cases Percentage of Convicted Trial Completed [(Col. 4 / Col. 3) X 100] Conviction [(Col. 5 / Col. 4) X 100] (4) (3) Tried* (5) (6) (7) 1 1971 9, 43, 394 3, 01, 869 1, 87, 072 32. 0 62. 0 2 1981 21, 11, 791 5, 05, 412 2, 65, 531 23. 9 52. 5 3 1991 39, 64, 610 6, 67, 340 3, 19, 157 16. 8 47. 8 4 2001 62, 21, 034 9, 31, 892 3, 80, 504 15. 0 40. 8 5 2002 64, 748 9, 81, 393 3, 98, 830 15. 2 40. 6 6 2003 65, 778 9, 567 3, 84, 887 14. 6 40. 1 7 2004 67, 68, 713 9, 57, 311 4, 06, 621 14. 1 42. 5 8 2005 69, 91, 508 10, 13, 240 4, 30, 091 14. 5 42. 4 9 2006 71, 92, 451 10, 44, 120 4, 47, 516 14. 5 42. 9 10 2007 74, 73, 521 10, 25, 689 4, 33, 929 13. 7 42. 3 11 2008 78, 33, 842 10, 52, 623 4, 48, 475 13. 4 42. 6 12 2009 81, 30, 053 10, 25, 781 4, 27, 655 12. 6 41. 7 13 2010 85, 49, 655 11, 41, 031 4, 64, 128 13. 3 40. 7 14 2011 89, 39, 161 12, 11, 225 4, 97, 996 15. 4 41. 1 * Excluding withdrawn/compounded cased

JAILS

NUMBER OF JAILS, CAPACITY, POPULATION AND OCCUPANCY RATE IN THE COUNTRY AT THE END OF 2011 S NO TYPE NUMBER CAPACIT Y POPULATI ON OF INMATES OCCUPAN CY RATE CENTRAL JAIL 123 137249 162723 118. 6 DISTRICT JAIL 333 124768 158274 126. 9 SUB JAIL 809 50908 39738 78. 1 WOMEN JAIL 19 4271 3059 71. 6 BORSTAL SCHOOL 21 2218 1144 51. 6 OPEN JAIL 44 3766 2652 70. 4 SPECIAL JAIL 30 9279 5255 56. 6 OTHERS 3 323 81 25. 1 TOTAL 1382 332782 372926 112. 1

Census 2011

VARIATION IN POPULATION SINCE 1901 Total Rural Urban 1901 238, 396, 327 212, 544, 454 25, 851, 873 1911 252, 093, 390 226, 151, 757 25, 941, 633 1921 251, 321, 213 223, 235, 043 28, 086, 170 1931 278, 977, 238 245, 521, 249 33, 455, 989 1941 318, 660, 580 274, 507, 283 44, 153, 297 1951 361, 088, 090 298, 644, 381 62, 443, 709 1961 439, 234, 771 360, 298, 168 78, 936, 603 1971 548, 159, 652 439, 045, 675 109, 113, 977 1981 683, 329, 097 523, 866, 550 159, 462, 547 1991 846, 302, 688 628, 691, 676 217, 611, 012 2001* 1, 028, 737, 436 742, 490, 639 286, 119, 689 Year Note: * The total population and rural population include estimated population of 127, 108 for Mao Maram, Paomata and Purul sub divisions of Senapati district of Manipur. India’s population without the estimated population of these areas is 1, 028, 610, 328 (532, 156, 772 males and 496, 453, 556 females)

RURAL - URBAN POPULATION DISTRIBUTION – CENSUS 2011 Population Percentage rate Rural 833087662 68. 84 Urban 377, 105, 760 33. 16 Total 1210193422

PROPORTION TO TOTAL POPULATION BY AGE GROUPS Persons Males Females 6 years and below 163, 819, 614 84, 999, 203 78, 820, 411 Proportion to total population (%) 15. 9 16. 0 15. 9 7 to 14 years 199, 791, 198 104, 488, 119 95, 303, 079 Proportion to total population (%) 19. 4 19. 6 19. 2 15 to 59 years 585, 638, 723 303, 400, 561 282, 238, 162 Proportion to total population (%) 56. 9 57. 0 56. 9 60 years and above 76, 622, 321 37, 768, 327 38, 853, 994 Proportion to total population (%) 7. 5 7. 1 7. 8 Age Not Stated 2, 738, 472 1, 500, 562 1, 237, 910 Proportion to total population (%) 0. 3 Age Groups Note: 50% of India's current population is below 25 years of age
27bf79d23ea846d3b6dfde8088aa3acf.ppt