9dde63d1d4d027de6af28fc61a749f58.ppt
- Количество слайдов: 166
 Risk Management in the Derivatives Markets Derivatives and Risk Management in Mexico May 7, 2001 Dr. Michel Crouhy Dr. Robert Mark Senior Vice President Risk Analytics and Capital Attribution Canadian Imperial Bank of Commerce Senior Executive Vice President Chief Risk Officer Canadian Imperial Bank of Commerce 1
 Dr. Michel Crouhy is Senior Vice President, Risk Analytics and Capital Attribution, Risk Management Division, at CIBC (Canadian Imperial Bank of Commerce). His responsibilities include the approval of all pricing models, the development and implementation of risk measurement methodologies for market, credit and operational risks, operational risk policy, and firm-wide capital attribution (RAROC). Prior to his current position at CIBC, Michel Crouhy was a Professor of Finance at the HEC School of Management in Paris, where he was also Director of the M. S. HEC in International Finance. He has been a visiting professor at the Wharton School and at UCLA. Dr. Crouhy holds a Ph. D from the Wharton School. He is co-author of “Risk Management” (Mc. Graw-Hill) and has published extensively in academic journals in the areas of banking, options and financial markets. He is also an associate editor of the Journal of Derivatives, the Journal of Banking and Finance, and is on the editorial board of the Journal of Risk. 2
 Dr. Robert M. Mark is a Senior Executive Vice President and Chief Risk Officer (CRO) at the Canadian Imperial Bank of Commerce (CIBC). Dr. Mark reports directly to the Chairman and Chief Executive Officer of CIBC, and is a member of the Senior Executive Team (Management Committee). Dr. Mark has global responsibility to cover all credit, market and operating risks for all of CIBC as well as for its subsidiaries. He has been appointed to the Boards of the Fields Institute for Research in Mathematical Sciences, IBM’s Deep Computing Institute and the International Swaps and Derivative Association (ISDA). In 1998 he was awarded the Financial Risk Manager of the Year award by the Global Association of Risk Professionals (GARP). Prior to his current position at CIBC, he was the partner in charge of the Financial Risk Management Consulting practice at Coopers & Lybrand (C&L). The Risk Management Practice at C & L advised clients on market and credit risk management issues and was directed toward financial institutions and multi-national corporations. This specialty area also coordinated the delivery of the firm’s accounting, tax, control, and litigation services to provide clients with integrated and comprehensive risk management solutions and opportunities. Prior to his position at C&L, he was a managing director in the Asia, Europe, and Capital Markets Group (AECM) at Chemical Bank. His responsibilities within AECM encompassed risk management, asset/liability management, research (quantitative analysis), strategic planning and analytic systems. He served on the Senior Credit Committee of the Bank. Before he joined Chemical Bank, he was a senior officer at Marine Midland Bank/Hong Kong Shanghai Bank Group (HKSB) where he headed the technical analysis trading group within the Capital Markets Sector. He earned his Ph. D. , with a dissertation in options pricing, from New York University’s Graduate School of Engineering and Science, graduating first in his class. Subsequently, he received an Advanced Professional Certificate (APC) in accounting from NYU’s Stern Graduate School of Business, and is a graduate of the Harvard Business School Advanced Management Program. He was also appointed chairperson of the National Asset/Liability Management Association (NALMA), and an Adjunct Professor at NYU’s Stern Graduate School of Business. 3
 Agenda I II IV V VI VII Introduction 5 Best Practice Risk Management………. . . …. 11 Transforming Risk Into Value ……………… 34 New Capital Adequacy Framework …. …. … 57 BIS 98 ……………………… 59 BIS 2000+ …………………. . 66 Credit Risk Mitigation ……………. 4 97
 I. Introduction Why do Financial Institutions try to Manage Risk ? 5
 Introduction Global trends are leading to … n n The rising importance of risk management In financial institutions More complex markets – Global markets – Greater product Complexity – New businesses (e-banking, merchant banking, …) – Increasing competition – New players – Regulatory imbalances Increased Risk 6
 I Introduction n In the Distant Past. . . – Institutions disaggregated their risks, and – treated each one separately. n However, today this approach is limited due to increasing – Linkages between markets – Importance of calculating portfolio effects, e. g issuer and counterparty risks, credit spread equity risks, etc. 7
 Introduction n In the future. . . The leading institutions will be distinguished by their intelligent management of risk. 8
 Introduction n Risk is multidimensional Market Risk Credit Risk Financial Risks Operational Risk Reputational Risk Business and strategic risks 9
 Introduction n One can “slice and dice” these multiple dimensions of risk* Equity Risk Market Risk Credit Risk Trading Risk Interest Rate Risk Currency Risk “Specific Risk” Gap Risk General Market Risk Commodity Risk Financial Risks Operational Risk Reputational Risk Business and strategic risks Counterparty Risk Transaction Risk Issuer Risk Portfolio Concentration Risk Issue Risk * For more details, see Chapter-1, “Risk Management” by Crouhy, Galai and Mark 10
 II. Best Practice Risk Management* * For more details, see Chapter-3, “Risk Management” by Crouhy, Galai and Mark 11
 Best Practice Risk Management n Goal: Independence and Partnership Establish a first class risk management function which is independent of the direct risk takers but works in partnership with them 12
 Best Practice Risk Management n Framework for Risk Management can be benchmarked in terms of: » Policies » Methodologies » Infrastructure METHO S OLICIE P DOLOG IES INFRASTRUCTURE 13
 Best Practice Risk Management n Framework for Risk Management can be benchmarked in terms of: » Policies » Methodologies » Infrastructure METHO DOLOG Proactive Risk INFRASTRUCTURE Management S OLICIE P IES 14
 Framework s st ra Inf Credit Risk Market Risk Liquidity Risk Operational Risk Regulatory Risk Etc. Price Deal Risks t c ire D Confirm/ Settle o th Me re tu ruc Execute s licie Po do ie log k Ris Manage Business Unit Risk Framework Compare Risk to Limit An Independent and Integrated Business Oriented Process Analyze Deal n T e ak rs 15
 Framework n Active portfolio management is a key component of first ED Active Portfolio UIR = class proactive Risk EQ Management R Management GE + Facilitate Pricing ED WL + Assign Reserves & NO Allocate Economic Capital RAROC GK SIN + Stress Test & EA Scenario Analysis Risk Analysis CR + Measure IN (e. g. Va. R & Credit. Va. R) } } } Limit Management + Monitor Identify & Avoid First Class Risk Management 16
 Framework - Policies Business Strategies Risk Tolerance Independent First Class Proactive Risk Management Authorities Disclosure 17
 Framework - Policies n These policies explicitly state our risk appetite, expressed in terms of a potential worst case loss. 18
 Framework - Policies EXAMPLES n Market Risk Policy – Measure market risks in terms of a “worst case” loss n Credit Risk Policy – Measure credit exposure in terms of a daily – mark-to-market plus “worst case” future exposure n Operational Risk Policy – Vet all models to be used to revalue positions 19
 Framework - Policies n Worst Case Market Risk Worst Case” Market Risk Path Probability 0% + t. N VA LU E e Tim - 10 0% t 0 20
 Framework - Policies n Worst Case Credit Risk Exposure “Worst Case” Credit Risk Exposure Path Probability 0% + t. N Va lu e e Tim 10 0% t 0 21
 Framework - Methodologies Independent First Class Proactive Risk Management RAROC Va. R Operational Valuation Risk 22
 Framework - Methodologies Market and Credit Risk Quantification of Risk n Value at Risk (at N standard deviations) – Transaction risk – Portfolio risk (capture correlation effect) n Event Risk – Reasonable Paranoia – Scenario Testing (e. g. volatility and correlation slippage) 23
 Framework - Methodologies n Value-At-Risk Framework Construct families of functions f such that: Market Risk f( u = u u Volatilities Correlations Liquidity Period Market Value Etc. ) 24
 Framework - Methodologies n Credit losses are estimated through analyses of the future distributions of risk factors Credit Losses = f( u u u ) Future Market Value Exposure Distributions Default Rate Distributions Recovery Rate Distributions 25
 Framework - Methodologies VAR Scenario Analysis Works well for normal markets Total Risk Management Scenario Analysis Accounts for unusual markets (The past cannot always predict the future) 26
 Framework - Methodologies Stress Testing Scenario - Example 1: n US Equity Market Crash n n Equity markets fall around the globe (US 10 %, Canada 7%, Hong Kong 15 %, Europe 10 % on average) An upward shift in implied volatilities of from 15% to 50 % Dollar rallies against other currencies : Asian Currencies lose 6 - 8 % Rates fall in Western markets - HKD rates rise by 40 bps 27
 Framework - Methodologies Stress Testing Scenario - Example 2: n Canada Crisis n n n 10 % drop in TSE 30 % upward shift in implied volatility 6 % depreciation of CAD against USD FX volatility rise by 40 % in all currency pairs that include CAD interest rates rise 150 bp at short end and 50 bp at the long end; 20 % upward shift in implied volatility 28
 Framework - Methodologies Stress Testing Scenario - Example 3: n Credit Spreads Widening n Credit Spreads move upward by 10 bp (AAA) to 100 bp (B) n Swap spreads increase 7 bp in major currencies n European currencies strengthen by 2 % 29
 Framework - Methodologies n Risk Adjusted Return on Risk Adjusted Capital Revenues Return on Assets Return on Equity Risk-Adjusted Return on Capital Return on Risk-Adjusted Capital Evolution of Performance Measures Risk-Adjusted Return on Risk-Adjusted Capital Leading Edge Methodology 30
 Framework - Methodologies n Calculating Risk Adjusted Return on Risk Adjusted Capital (RARORAC) RARORAC = f( u u u Direct & Indirect Revenues Direct & Indirect Expenses Credit Risk Factors Market Risk Factors Correlation Effect Balance Sheet Constraints ) 31
 Framework - Infrastructure Technology Accurate Data Operations Independent First Class Proactive Risk Management People (Skills) 32
 Framework - Infrastructure n Frontier - Risk MIS 6 Regions Analytical Engine RMU Information Delivery RISK WAREHOUSE Transformation 3 -D Interface 33
 III. Transforming Risk into Value 34
 We are on the verge of a transformational shift Advances in Risk Management are being borrowed from the trading world in order to transform the approach to capital and balance sheet management 35
 Today The regulatory community is: n Finding it increasingly difficult to keep pace n Beginning to acknowledge that standardized regulatory measures fail to provide sufficient transparency 36
 Why is this so? Let’s take a look at a few examples 37
 Example #1: Short Term Revolvers n An unfunded revolver with a term of less than one year does not require any regulatory capital 38
 Example #2: Corporations vs. OECD Banks n A loan to GE requires 5 times as much regulatory capital as a loan to Hokkaido Takushoku % 8. 0 1. 6 Hokkaido Takushoku General Electric 39
 Example #3: Investment Grade vs. Non-investment Grade Lending n A loan to a AA-rated corporate requires the same amount of capital as a loan to a B-rated corporate % 8. 0 AA B 40
 Example #4: Level of Diversification n A single loan requires the same amount of regulatory capital as a diversified portfolio % 8. 0 1 loan of $100 8. 0 100 loans of $1 each 41
 Recent Events and Emerging Trends 42
 Trend #1: Regulatory approval of internal models for trading book n Banks have a choice of using either a standardized or an internal model to calculate regulatory capital for the trading book (1998 Rules) 43
 Greater transparency and improved ability to manage and price risk e sk g in sf n a Tr rm o u Ri u I to n u al V u Internal models Standardized risk-weighted assets Nominal Assets Increasing model sophistication 44
 Opportunities for a Regulatory Capital Advantage n Example: 30 year Corporate Bond Standardized Model Internal Model Capital Market Credit 98 Rules 45
 Trend #2: Internal Models which measure Intersection of Market Risk and Credit Risk in the Trading Book Price Risk in the trading book Market Risk Credit Risk 46
 Trend #2: Internal Models which measure Intersection of Market Risk and Credit Risk in the Trading Book PRICE RISK IN THE TRADING BOOK Market Risk Credit Risk Liquidity Risk 47
 The Asian Contagion Trading Market Risk Liquidity Risk Trading Credit Risk Asian Currencies Declined Market Liquidity Dried Up Credit Spreads Widened Equities Fell Enterprise Liquidity Dried Up Declining Credit Quality Interest Rates Unstable Financial System Under Stress Defaults Increased 48
 Trend #3: Development of Internal Models for the Banking Book n Sophisticated banks are working hard to develop internal models – JP Morgan n So are leading model vendors – KMV 49
 Our internal analytic risk models are being used to assign capital based on risk for the banking book Capital A BBB BB B Credit Rating 50
 Our internal analytic risk models reflect the level of concentration risk Capital 1 loan of $100 loans of $1 each Increasing Diversification 51
 Trend #4: Regulatory Approval for the Banking Book Today Internal models for the TRADING book Future Internal models for the BANKING book Transforming Risk into Value 52
 Knowledge Transfer from Trading to Banking Book ue l ng i rm o T sf an r u is R k to n I u Va u Integrated Internal models for banking book Knowledge transfer from trading book to banking book Integrated Internal models for trading book Increasing Model Sophistication 53
 Trend #5: Regulators will encourage the use of internal models n Regulators concerned about significant reduction in regulatory capital brought about by – allowing banks to use their internal models – regulatory arbitrage 54
 Future: Regulatory Response n Implications: If regulators scale up regulatory capital, then sophisticated banks that have internal models will continue to have a relative capital advantage 55
 IV. New Capital Adequacy Framework* * For more details, see Chapter-2, “Risk Management” by Crouhy, Galai and Mark 56
 Menu of Approaches n For Measuring Market Risk - BIS 98 – Standardized Approach – Internal Va. R Models n For Measuring Credit Risk - BIS 2000+ – Standardized Approach – Foundation Internal Ratings-based Approach – Advanced Internal Ratings-based Approach n For Measuring Operational Risk - BIS 2000+ – Basic Indicator Approach – Standardized Business Line Approach – Internal Measurement Approach 57
 V. BIS 98* * For more details, see Chapters 2 and 4, “Risk Management” by Crouhy, Galai and Mark 58
 The New 1998 BIS and CAD II Accord Applies to the trading book and encompasses: n General market risk – Change in market value resulting from broad market movements n Specific risk (idiosyncratic or credit risk) – Adverse price movements due to idiosyncratic factors related to individual issuers 59
 BIS 98 n Regulatory capital required for market risk associated with the trading book: – General market risk {3 * sqr(10) * market-risk Va. R}* (trigger/8) – Specific risk (equities and corporate bonds) {4 * sqr(10) * specific-risk Va. R}*(trigger/8) 60
 BIS 98 n Multipliers (3 for general market risk and 4 for specific risk) reward the quality of the models n The “trigger” relates to the control process (8 to 25) n Total Capital – 1998 BIS Accord + – Modified 1988 BIS Accord 61
 BIS 98 n Internal models vs Standardized approach – capture portfolio effects – allow to incorporate credit risk mitigation techniques and hedging strategies – provide opportunity for capital reduction through a better risk assessment 62
 BIS 98 n …but also for a more accurate allocation of capital Example: Portfolio of 100 $1 bonds diversified across industries Capital charge for specific risk (%) Internal model Standardized approach AAA 0. 26 1. 6 AA 0. 77 1. 6 A 1. 00 1. 6 BBB 2. 40 1. 6 BB 5. 24 8 B 8. 45 8 CCC 10. 26 8 63
 BIS 98 Standardized Approach AAA AA Internal model A BBB BB B CCC 64
 VI. The New Basel Capital Accord* (BIS 2000+) * For more details, see Chapter-2, “Risk Management” by Crouhy, Galai and Mark 65
 BIS 2000+ n In 1999 several consultative papers have been issued – Credit Risk Modeling (April) – A new Capital Adequacy Framework (June) – Credit Risk Disclosure – Principles for the management of credit risk – Settlement risk in foreign exchange n January 16, 2001 – New Basel Accord (BIS is seeking comments by the end of May 2001, with expectation that the final version will be published by the end of 2001, and come into effect in 2004) 66
 Some existing shortfalls n Credit Risk – Undifferentiated by risk – No benefit for diversification – Tenor and structural arbitrage n Interest rate risk in banking book – No (explicit) capital n Operational risk – No (explicit) capital 67
 The New Basel Capital Accord Three Basic Pillars Minimum Capital Requirement Supervisory Review Process Market Discipline Requirements 68
 Scope of Application n Current Accord Applicable to banks on a consolidated basis • including subsidiaries undertaking banking and financial business • but without further specification 69
 New Scope of Application Diversified Financial Group Holding Company Internationally Active Bank Domestic Bank Internationally Active Bank Securities Firm 70
 Subsidiaries and Other Financial Activities Banking Activities (as defined under national legislation) Majority Owned or Controlled Significant Minority. Owned Investments Principle Full Consolidation Pro-rate Consolidation Deduction of Investment Otherwise Deduction 71
 Minimum Capital Requirement Pillar One Standardized Credit Risk Internal Ratings Credit Risk Models Credit Mitigation Risks Market Risk Other Risks Trading Book Banking Book Operational Other 72
 1. Minimum Capital Requirements (Pillar One) n n Standardized approach (External Ratings) Internal ratings-based approach • Foundation approach Minimum Capital Requirement • Advanced approach n Credit risk modeling (Sophisticated banks in the future) 73
 Evolutionary Structure of the Accord Credit Risk Modeling ? Advanced IRB Approach Foundation IRB Approach Standardized Approach Increased level of sophistication 74
![The New Basel Capital Accord n Securitization [Additional work required] n Project Finance [Additional The New Basel Capital Accord n Securitization [Additional work required] n Project Finance [Additional](https://present5.com/presentation/9dde63d1d4d027de6af28fc61a749f58/image-75.jpg) The New Basel Capital Accord n Securitization [Additional work required] n Project Finance [Additional Work Required] n Equity [Additional Work Required] – Merchant Banking Book 75
The New Basel Capital Accord n Securitization [Additional work required] n Project Finance [Additional Work Required] n Equity [Additional Work Required] – Merchant Banking Book 75
 The New Basel Capital Accord Standardized Approach • • • Provides Greater Risk Differentiation than 1988 Risk Weights based on external ratings Five categories [0%, 20%, 50%, 100%, 150%] Certain Reductions – e. g. short term bank obligations Certain Increases – e. g. 150% category for lowest rated obligors 76
 Standardized Approach Based on assessment of external credit assessment institutions External Credit Assessments Sovereigns Banks/Securities Firms Corporates Public-Sector Entities Asset Securitization Programs 77
 Standardized Approach: New Risk Weights (June 1999) Assessment Claim AAA to A+ to A- BBB+ to AA- Sovereigns Banks BBB- Below B- Unrated B- 0% 20% 50% 100% 150% 100% Option 11 20% 50% 100% 150% 100% Option 22 20% 50% 3 100% 150% 20% 100% 150% Corporates 1 BB+ to 3 3 50% 3 100% Risk weighting based on risk weighting of sovereign in which the bank is incorporated. Risk weighting based on the assessment of the individual bank. 3 Claims on banks of a short original maturity, for example less than six months, . would receive a weighting that is one category more favourable than the usual risk weight on the bank’s claims 2 78
 Standardized Approach: New Risk Weights (January 2001) Assessment Claim AAA to A+ to A- BBB+ to BBB- AASovereigns Banks BB- (B-) 0% 20% 50% 100% 150% 100% Option 11 20% 50% 100% 150% 100% Option 22 20% 50% Corporates 1 BB+ to Below BB- Unrated 20% 3 50% 3 100% 3 150% 50%(100%) 100% 150% 3 100% Risk weighting based on risk weighting of sovereign in which the bank is incorporated. Risk weighting based on the assessment of the individual bank. 3 Claims on banks of a short original maturity, for example less than six months, . would receive a weighting that is one category more favourable than the usual risk weight on the bank’s claims 2 79
 Internal Ratings-Based Approach n Two-tier ratings system: – Obligor rating • represents probability of default by a borrower – Facility rating • represents expected loss of principal and/or interest Pillar 1 80
 ISDA proposed “standard approach” Example: Relative Capital Weights: 99. 5% confidence level; LGD = 100% Prob. Def. % £ 0. 5 Yr 0. 5 -1 Yr 1 -2 Yr 2 -3 Yr 3 -4 Yr 4 -5 Yr 5 -6 Yr 6 -7 Yr 7 -8 Yr 8 -9 Yr > 9 Yr 0. 00 - 0. 025 6 8 12 17 21 25 28 32 36 40 43 0. 025 - 0. 035 9 12 17 23 29 35 40 46 51 56 60 0. 03 5 - 0. 045 13 17 24 31 38 46 52 58 66 73 80 0. 04 5 - 0. 055 16 20 28 36 44 52 59 65 74 81 89 0. 055 - 0. 065 18 24 32 41 49 58 65 73 81 89 98 0. 065 - 0. 085 22 29 38 47 56 65 73 81 91 100 109 0. 085 - 0. 115 27 34 45 56 66 76 85 94 104 114 123 0. 115 - 0. 165 36 46 59 72 86 97 108 119 130 140 151 0. 165 - 0. 255 48 60 80 100 118 134 149 164 178 191 203 0. 255 - 0. 405 72 86 108 130 150 168 186 202 216 230 241 0. 405 - 0. 635 100 119 145 172 195 216 236 254 269 283 294 0. 635 - 0. 915 140 163 190 215 238 257 275 292 305 317 327 0. 915 - 1. 335 181 207 231 253 273 290 307 321 331 342 351 1. 335 1. 945 240 271 293 312 330 345 359 371 379 388 395 1. 945 - 3. 875 370 409 420 430 440 457 463 466 473 476 3. 875 - 7. 705 662 716 719 721 724 726 727 727 727 7. 705 - 14. 995 1083 1164 1166 1168 1168 14. 995 - 20. 000 1619 1718 1718 1718 Weights are average values derived by 6 international banks and sponsored by ISDA (BBB 3 yr = 3. 45% ) 81
 Standardized Approach Internal rating system & Credit Va. R New standardized model 16 12 PER CENT 3 4 4. 5 5 5. 5 6 CCC B BB- BB+ BBB 2 A- 1 A+ S&P: AA 1. 6 0 AAA 8 6. 5 7 RATING 82
![Internal Ratings-Based Approach • Three elements: – Risk Components [PD, LGD, EAD] – Risk Internal Ratings-Based Approach • Three elements: – Risk Components [PD, LGD, EAD] – Risk](https://present5.com/presentation/9dde63d1d4d027de6af28fc61a749f58/image-83.jpg) Internal Ratings-Based Approach • Three elements: – Risk Components [PD, LGD, EAD] – Risk Weight conversion function – Minimum requirements for the management of policy and processes – Emphasis on full compliance Definitions; PD = Probability of default [“conservative view of long run average (pooled) for borrowers assigned to a RR grade. ”] LGD = Loss given default EAD = Exposure at default Note: BIS is Proposing 75% for unused commitments EL = Expected Loss 83
Internal Ratings-Based Approach • Three elements: – Risk Components [PD, LGD, EAD] – Risk Weight conversion function – Minimum requirements for the management of policy and processes – Emphasis on full compliance Definitions; PD = Probability of default [“conservative view of long run average (pooled) for borrowers assigned to a RR grade. ”] LGD = Loss given default EAD = Exposure at default Note: BIS is Proposing 75% for unused commitments EL = Expected Loss 83
 Internal Ratings-Based Approach Risk Components • Foundation Approach – PD set by Bank – LGD, EAD set by Regulator 50% LGD for Senior Unsecured Will be reduced by collateral (Financial or Physical) • Advanced Approach – PD, LGD, EAD all set by Bank – Between 2004 and 2006: floor for advanced approach @ 90% of foundation approach Notes • Consideration is being given to incorporate maturity explicitly into the “Advanced”approach • Granularity adjustment will be made. [not correlation, not models] • Will not recognize industry, geography. • Based on distribution of exposures by RR. • Adjustment will increase or reduce capital based on comparison to a reference portfolio [different for foundation vs. advanced. ] 84
 Exposure at Default n n On-balance-sheet items: nominal outstanding amount. Off-balance-sheet positions – Foundation approach • Same credit conversion factors as in 1988 Accord. • Exception: commitments >75% for undrawn amount – Advanced Approach • Banks can use their own internal estimates 85
 Credit conversion factors for non-derivative off-balance sheet exposures 86
 Approach Variations 87
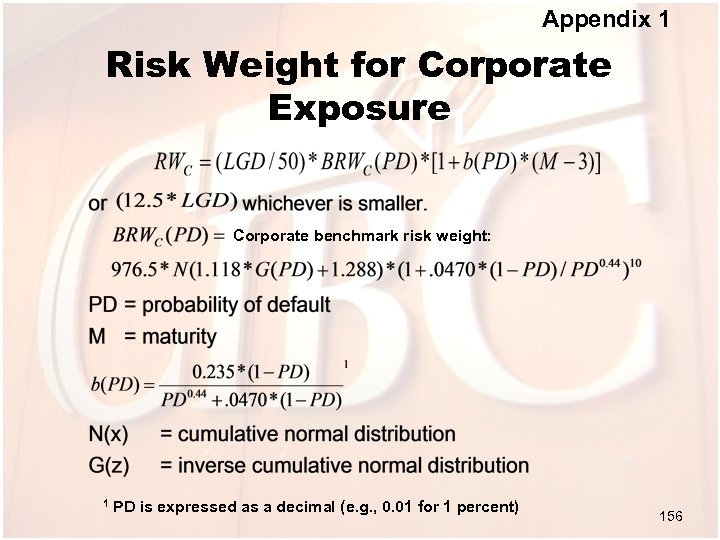
 Corporate benchmark risk weight: 1 PD is expressed as a decimal (e. g. , 0. 01 for 1 percent) 88
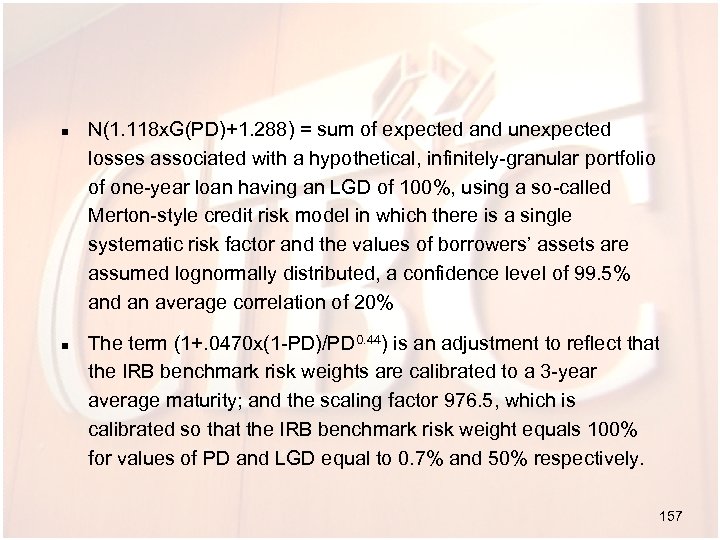
 n n N(1. 118 x. G(PD)+1. 288) = sum of expected and unexpected losses associated with a hypothetical, infinitely-granular portfolio of one-year loan having an LGD of 100%, using a so-called Merton-style credit risk model in which there is a single systematic risk factor and the values of borrowers’ assets are assumed lognormally distributed, a confidence level of 99. 5% and an average correlation of 20% The term (1+. 0470 x(1 -PD)/PD 0. 44) is an adjustment to reflect that the IRB benchmark risk weights are calibrated to a 3 -year average maturity; and the scaling factor 976. 5, which is calibrated so that the IRB benchmark risk weight equals 100% for values of PD and LGD equal to 0. 7% and 50% respectively. 89
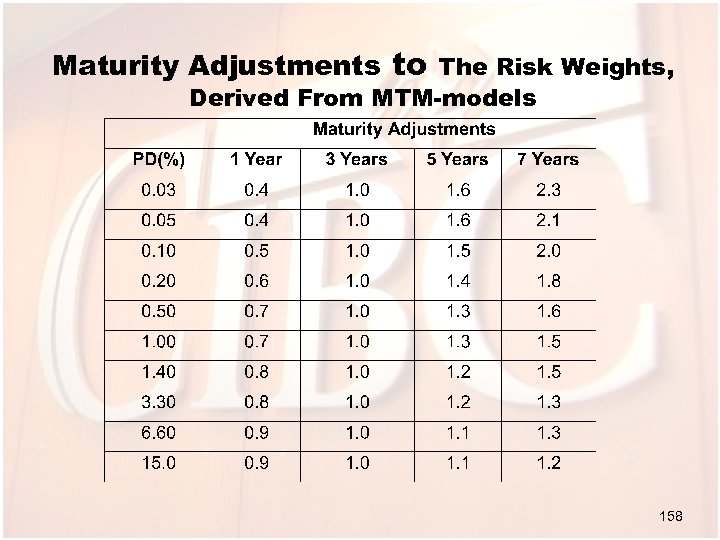
 Maturity Adjustments to The Risk Weights, Derived From MTMmodels 90
 IRB - Risk Weight Function n Risk weighted assets = risk weight x exposure n Risk weight = f (PD, LGD, EAD, M) n PD estimation – Underlying historical observation period at least 5 years. – Transition period 2004 -2007 (start 2 years observation period) n Rating system in use for at least 3 years – Transition period 2004 - 2007 91
 Standardized vs. Foundation IRB Approach vs. Internal Model Approach Foundation IRB attributes more than twice as much capital as Internal Models (ISDA) Capital Charges for Standard and Poor’s Rating Categories BRW = Benchmark Risk Weight Note: 1 Formula supplied by BIS. 92
 Risk Weights Standardized vs. Foundation IRB Approach 1 Note: 1 Benchmark set at 0. 7% PD, 50% LGD, M=3 years 93
 Note: Assumption LGD=100% 94
 Encouragement of models n n Regulators welcome the use of credit risk models as part of internal risk management process to manage risk Regulators will recognize the use of credit risk models as part of their supervisory review process 95
 VII. Credit Risk Mitigation 96
 Credit Risk Mitigation n Recognition of wider range of mitigants Subject to meeting minimum requirements Applies to both Standardized and IRB Approaches 97
 Collateral 98
 Collateral Comprehensive Approach 99
 Collateral Comprehensive Approach n n H - should reflect the volatility of the collateral w - should reflect legal uncertainty and other residual risks. Represents a floor for capital requirements 100
 Collateral Example n $1, 000 loan to BBB rated corporate n $800 collateralised by bond issued by AAA rated bank n Residual maturity of both: 2 years 101
 Collateral Example Simple Approach n n n Collateralized claims receive the risk weight applicable to the collateral instrument, subject to a floor of 20% Example: $1, 000 - $800 = $200 x $100% = $200 $800 x $20% = $160 Risk Weighted Assets: $200+$160 = $360 102
 Collateral Example Comprehensive Approach n C = Current value of the collateral received (e. g. $800) n HE = Haircut appropriate to the exposure (e. g. = 6%) n n HC = Haircut appropriate for the collateral received (e. g. = 4%) CA = Adjusted value of the collateral (e. g. $770) 103
 Collateral Example Comprehensive Approach n Calculation of risk weighted assets based on following formula: r* x E = r x [E-(1 -w) x CA] 104
 Collateral Example Comprehensive Approach n n n r* = Risk weight of the position taking into account the risk reduction (e. g. 34. 5%) w 1 = 0. 15 r = Risk weight of uncollateralized exposure (e. g. 100%) E = Value of the uncollateralized exposure (e. g. $1000) Risk Weighted Assets 34. 5% x $1, 000 = 100% x [$1, 000 - (1 -0. 15) x $770] = $345 Note: 1 Discussions ongoing with BIS re double counting of w factor with Operational Risk 105
 Collateral Example Comprehensive Approach n Risk Weighted Assets 34. 5% x $1, 000 = 100% x [$1, 000 - (1 -0. 15) x $770] = $345 Note: comprehensive Approach saves 106
 Collateral Example Simple and Comprehensive Approaches 107
 Guarantees & Credit Derivatives n n n Based on substitution approach of existing Accord Minimum operational requirements Guarantees, must be • • Direct Explicit Irrevocable Unconditional 108
 Guarantee - Example n n r* = g+ w * (r-g) r* = effective risk weight of the position r = risk weight of the obligor w = weight applied to the underlying exposure (w = 0. 15 or 0 for sovereigns and banks) n g = risk weight of the guarantor 109
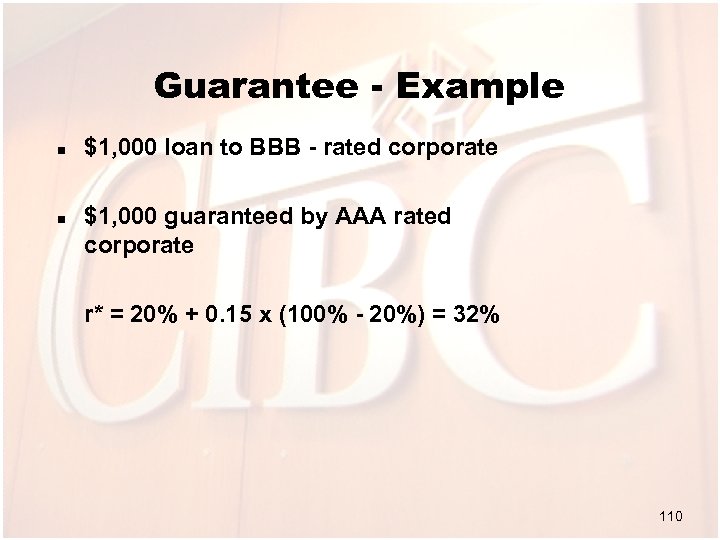 Guarantee - Example n n $1, 000 loan to BBB - rated corporate $1, 000 guaranteed by AAA rated corporate r* = 20% + 0. 15 x (100% - 20%) = 32% 110
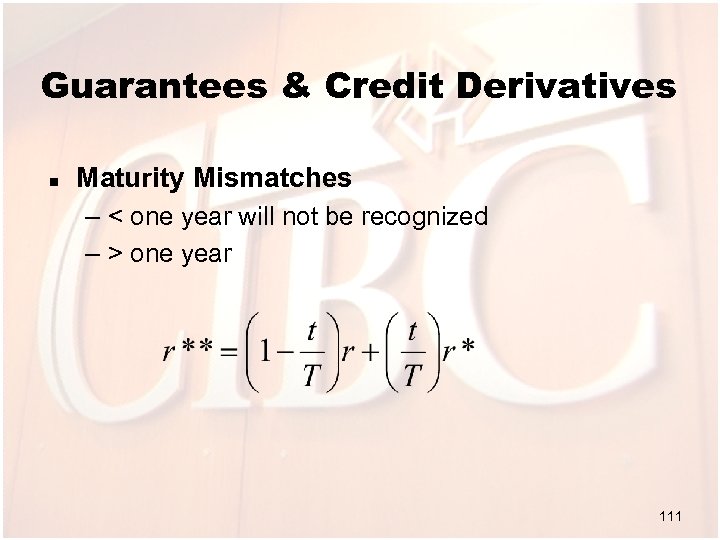 Guarantees & Credit Derivatives n Maturity Mismatches – < one year will not be recognized – > one year 111
 Guarantees & Credit Derivatives where r** = weight of the mismatched position r = weight of the unhedged position r* = weight if position hedged without mismatch t = residual maturity of the hedge T = residual maturity of exposure 112
 On-Balance Sheet Netting n Netting of loans and deposits will be permitted subject to the following conditions: – Well-founded legal basis enforceable in each relevant jurisdiction – Assets and liabilities must be determinable – Bank monitors roll-off risks – Bank monitors and controls relevant exposures on a net basis 113
 VIII. Counterparty Risk 114
 Contents n Forms of credit risk and credit exposure n Methods to measure counterparty credit exposure – simple add-on method – counterparty portfolio simulation n Economic Capital • Default only perspective • Change in economic value perspective 115
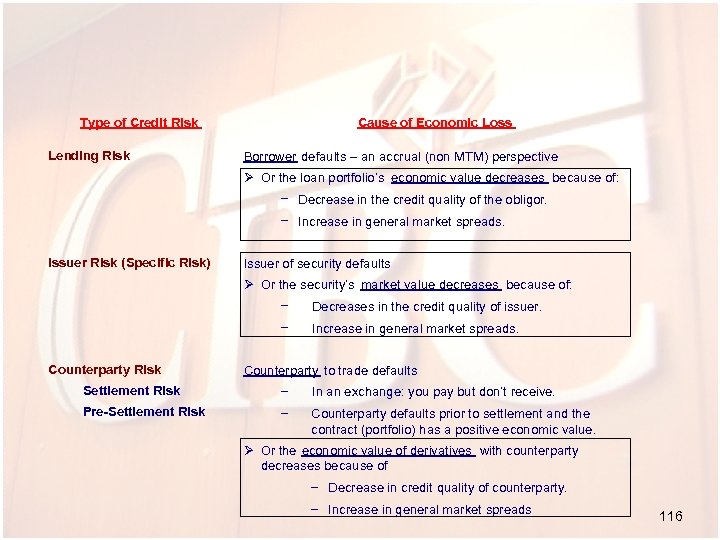 Type of Credit Risk Lending Risk Cause of Economic Loss Borrower defaults – an accrual (non MTM) perspective Ø Or the loan portfolio’s economic value decreases because of: - Decrease in the credit quality of the obligor. - Increase in general market spreads. Issuer Risk (Specific Risk) Issuer of security defaults Ø Or the security’s market value decreases because of: - Counterparty Risk Decreases in the credit quality of issuer. Increase in general market spreads. Counterparty to trade defaults Settlement Risk - In an exchange: you pay but don’t receive. Pre-Settlement Risk - Counterparty defaults prior to settlement and the contract (portfolio) has a positive economic value. Ø Or the economic value of derivatives with counterparty decreases because of - Decrease in credit quality of counterparty. - Increase in general market spreads 116
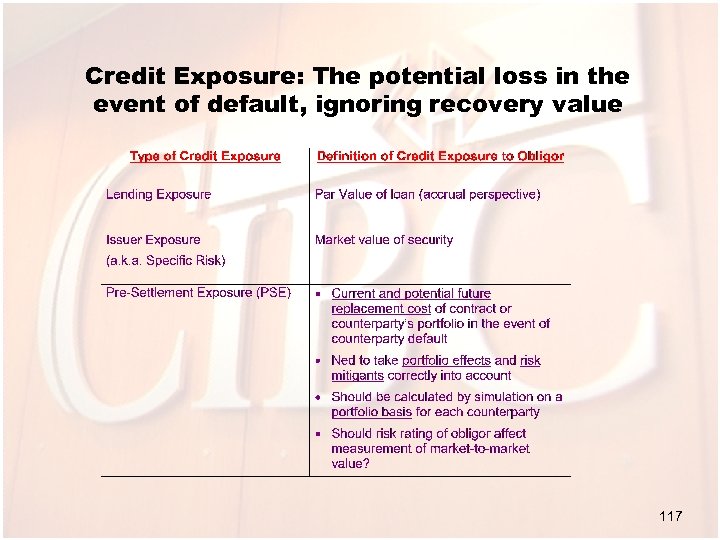 Credit Exposure: The potential loss in the event of default, ignoring recovery value 117
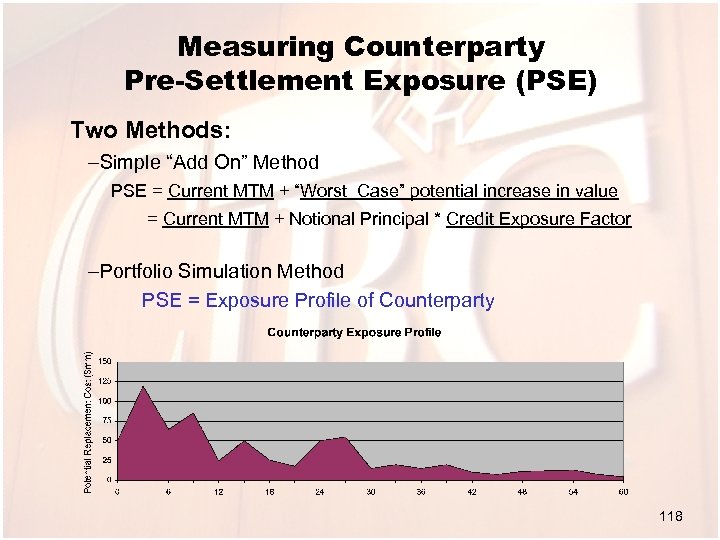 Measuring Counterparty Pre-Settlement Exposure (PSE) Two Methods: –Simple “Add On” Method PSE = Current MTM + “Worst Case” potential increase in value = Current MTM + Notional Principal * Credit Exposure Factor –Portfolio Simulation Method PSE = Exposure Profile of Counterparty 118
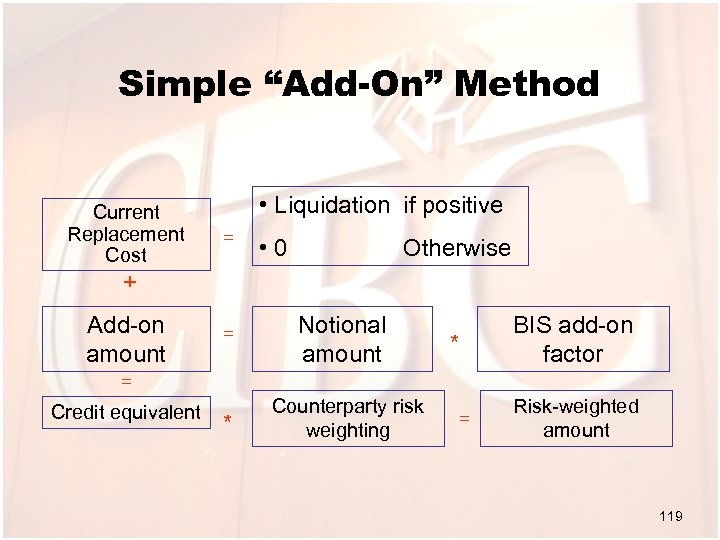 Simple “Add-On” Method Current Replacement Cost • Liquidation if positive = • 0 Otherwise + Add-on amount = Notional amount * BIS add-on factor = Credit equivalent * Counterparty risk weighting = Risk-weighted amount 119
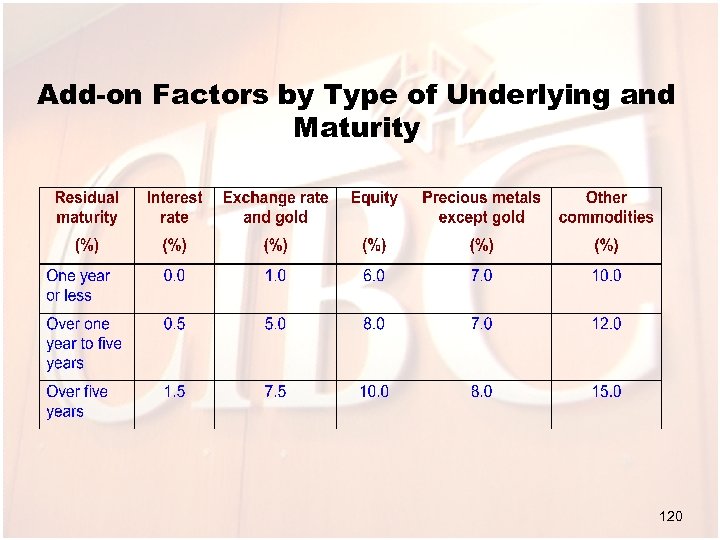 Add-on Factors by Type of Underlying and Maturity 120
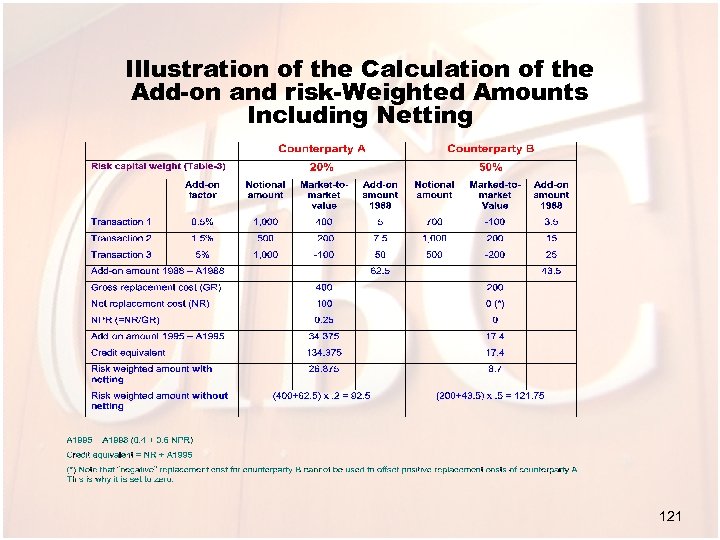 Illustration of the Calculation of the Add-on and risk-Weighted Amounts Including Netting 121
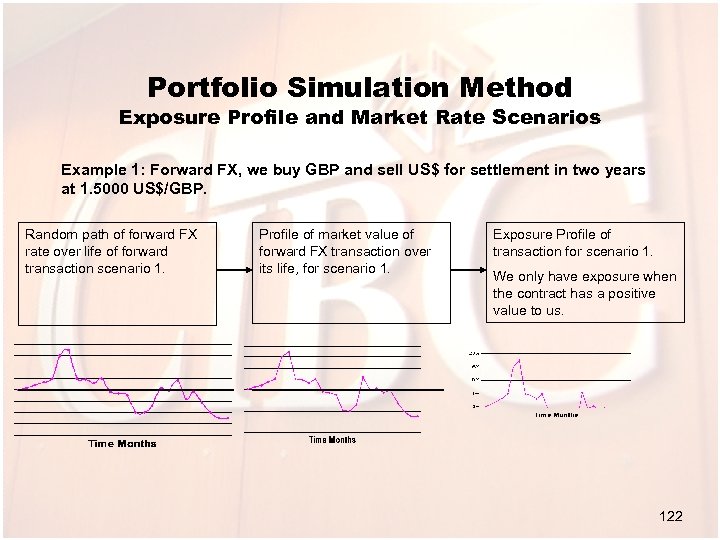 Portfolio Simulation Method Exposure Profile and Market Rate Scenarios Example 1: Forward FX, we buy GBP and sell US$ for settlement in two years at 1. 5000 US$/GBP. Random path of forward FX rate over life of forward transaction scenario 1. Profile of market value of forward FX transaction over its life, for scenario 1. Exposure Profile of transaction for scenario 1. We only have exposure when the contract has a positive value to us. 122
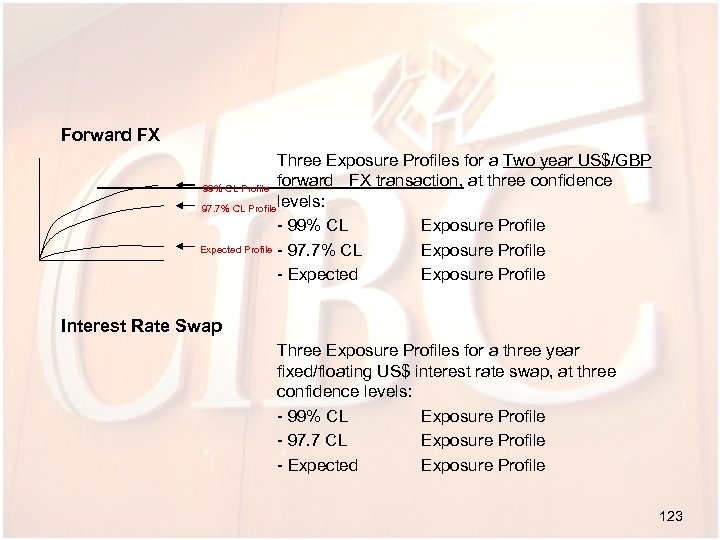 Forward FX Three Exposure Profiles for a Two year US$/GBP forward FX transaction, at three confidence 99% CL Profile levels: 97. 7% CL Profile - 99% CL Exposure Profile Expected Profile - 97. 7% CL Exposure Profile - Expected Exposure Profile Interest Rate Swap Three Exposure Profiles for a three year fixed/floating US$ interest rate swap, at three confidence levels: - 99% CL Exposure Profile - 97. 7 CL Exposure Profile - Expected Exposure Profile 123
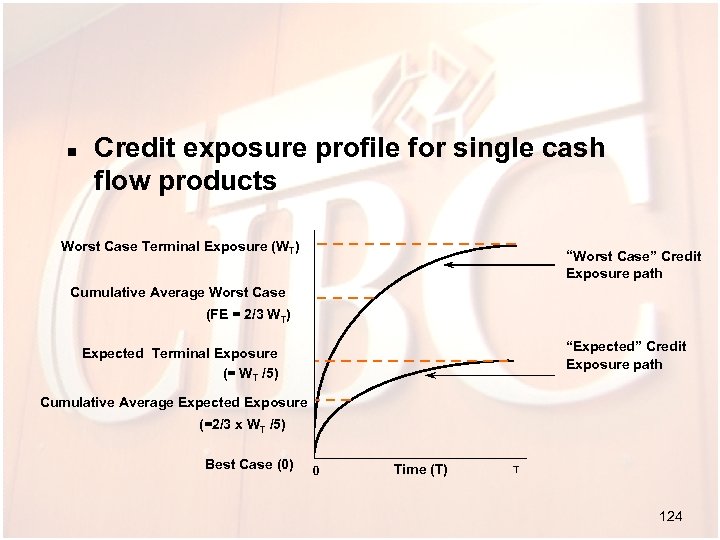 n Credit exposure profile for single cash flow products Worst Case Terminal Exposure (WT) “Worst Case” Credit Exposure path Cumulative Average Worst Case (FE = 2/3 WT) “Expected” Credit Exposure path Expected Terminal Exposure (= WT /5) Cumulative Average Expected Exposure (=2/3 x WT /5) Best Case (0) 0 Time (T) T 124
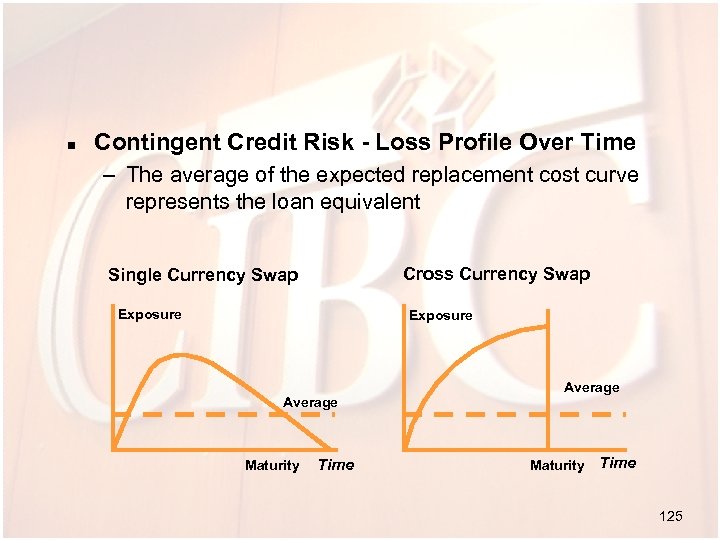 n Contingent Credit Risk - Loss Profile Over Time – The average of the expected replacement cost curve represents the loan equivalent Cross Currency Swap Single Currency Swap Exposure Average Maturity Time 125
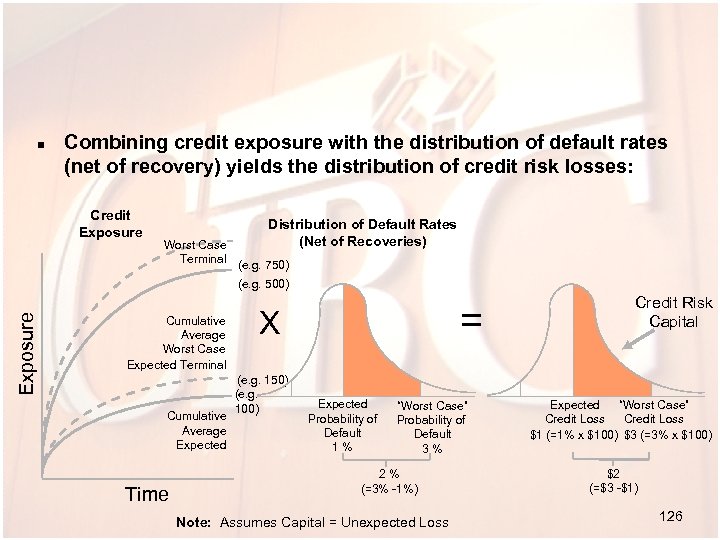 n Combining credit exposure with the distribution of default rates (net of recovery) yields the distribution of credit risk losses: Credit Exposure Distribution of Default Rates (Net of Recoveries) Worst Case Terminal (e. g. 750) Exposure (e. g. 500) Cumulative Average Worst Case Expected Terminal Cumulative Average Expected Time = X (e. g. 150) (e. g. 100) Expected Probability of Default 1% “Worst Case” Probability of Default 3% 2% (=3% -1%) Note: Assumes Capital = Unexpected Loss Credit Risk Capital Expected “Worst Case” Credit Loss $1 (=1% x $100) $3 (=3% x $100) $2 (=$3 -$1) 126
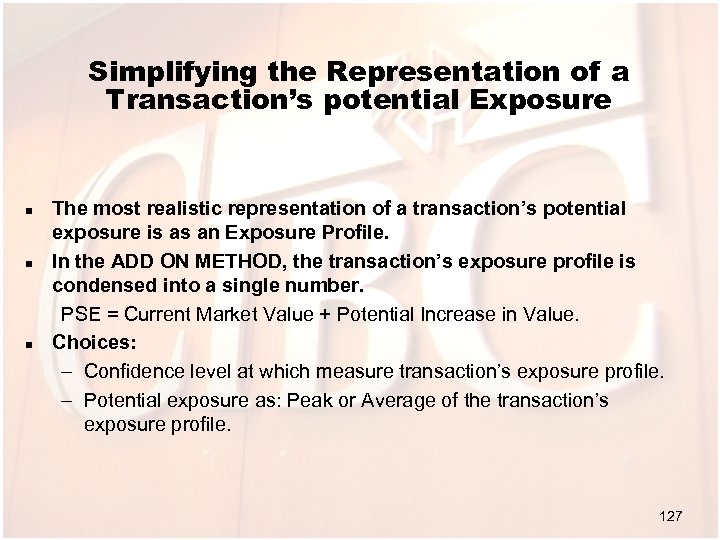 Simplifying the Representation of a Transaction’s potential Exposure n n n The most realistic representation of a transaction’s potential exposure is as an Exposure Profile. In the ADD ON METHOD, the transaction’s exposure profile is condensed into a single number. PSE = Current Market Value + Potential Increase in Value. Choices: – Confidence level at which measure transaction’s exposure profile. – Potential exposure as: Peak or Average of the transaction’s exposure profile. 127
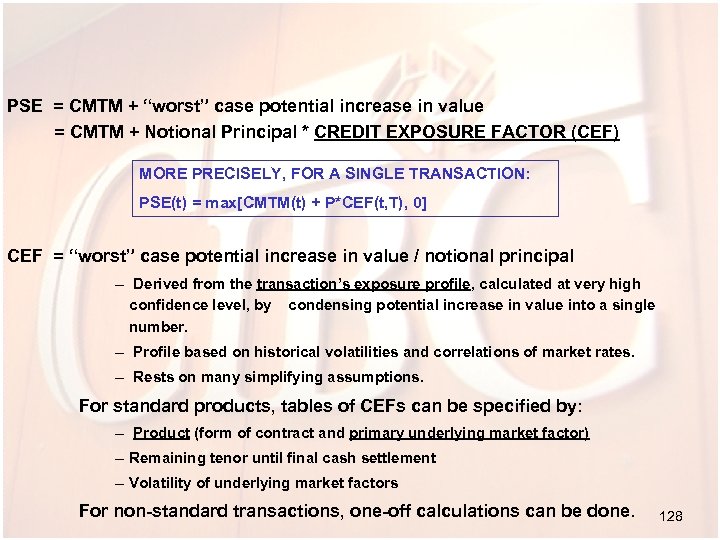 PSE = CMTM + “worst” case potential increase in value = CMTM + Notional Principal * CREDIT EXPOSURE FACTOR (CEF) MORE PRECISELY, FOR A SINGLE TRANSACTION: PSE(t) = max[CMTM(t) + P*CEF(t, T), 0] CEF = “worst” case potential increase in value / notional principal – Derived from the transaction’s exposure profile, calculated at very high confidence level, by condensing potential increase in value into a single number. – Profile based on historical volatilities and correlations of market rates. – Rests on many simplifying assumptions. For standard products, tables of CEFs can be specified by: – Product (form of contract and primary underlying market factor) – Remaining tenor until final cash settlement – Volatility of underlying market factors For non-standard transactions, one-off calculations can be done. 128
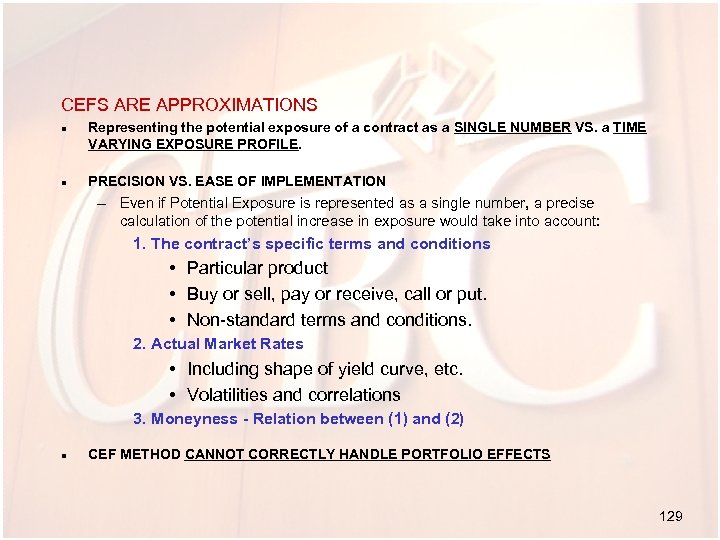 CEFS ARE APPROXIMATIONS n n Representing the potential exposure of a contract as a SINGLE NUMBER VS. a TIME VARYING EXPOSURE PROFILE. PRECISION VS. EASE OF IMPLEMENTATION – Even if Potential Exposure is represented as a single number, a precise calculation of the potential increase in exposure would take into account: 1. The contract’s specific terms and conditions • Particular product • Buy or sell, pay or receive, call or put. • Non-standard terms and conditions. 2. Actual Market Rates • Including shape of yield curve, etc. • Volatilities and correlations 3. Moneyness - Relation between (1) and (2) n CEF METHOD CANNOT CORRECTLY HANDLE PORTFOLIO EFFECTS 129
 n GENERAL ISSUES APPLICABLE TO SINGLE CONTRACTS OR PORTFOLIOS – – – n Accuracy of representation of market rates. Capturing specific terms and conditions of each contract. Representing exposure as a profile, not a single number. ISSUES SPECIFIC TO PORTFOLIOS Statistical factor Portfolio exposure tends to be less than sum of individual contract exposures. – A single market rate cannot increase and decrease simultaneously. – Market rates are correlated. Legal factors Potential reduction in exposure via contractual risk mitigating agreements: – Netting Agreements. – Margin Agreements (affects exposures of both single contract and portfolio). – Options to early termination agreements (affects both single contract and portfolio). 130
 General Method: Four Steps 1. Simulate changes in market rates Over Time. – Start with current market rates. – Simulate scenarios (or paths) of changes in market rates at many future dates, over many years, using tables of volatilities and correlations. 2. For each simulated scenario, measure potential market value of each transaction over time. – Start with feed of transaction details and legal information. – For each simulated scenario, calculate the potential market value of each contract at many future dates, using the contract’s terms and conditions, revaluation formula and the simulated state of the market. 3. For each simulated scenario, measure counterparty’s potential exposure over time. – For each simulated scenario, at each future point in time, transform the potential market value of each contract into the potential exposure of the portfolio through aggregation rules that take risk mitigants and legal context into account. 4. At each forward point in time, calculate potential exposure at some high confidence level 131
 132
132
 ECONOMIC CAPITAL 133
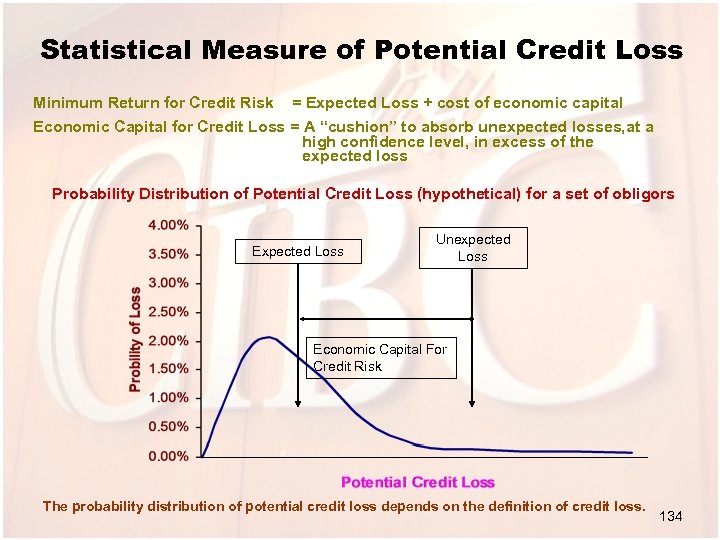 Statistical Measure of Potential Credit Loss Minimum Return for Credit Risk = Expected Loss + cost of economic capital Economic Capital for Credit Loss = A “cushion” to absorb unexpected losses, at a high confidence level, in excess of the expected loss Probability Distribution of Potential Credit Loss (hypothetical) for a set of obligors Expected Loss Unexpected Loss Economic Capital For Credit Risk The probability distribution of potential credit loss depends on the definition of credit loss. 134
 Importance of Definition of Credit Loss The PROBABILITY DISTRIBUTION of potential loss depends on: The Definition of Loss – Accounting basics • e. g. default only vs. economic loss – The type of risks(s) which give rise to loss • e. g. issuer risk, pre-settlement credit risk or any credit event – The time horizon over which economic loss could occur (e. g. one year) THE STATISTICAL PARAMETERS used to simulate potential loss ECONOMIC CAPITAL will depend on: The probability distribution of loss and The confidence level (e. g. 99. 9%, 99. 97%) at which EC is measured 135
 Simulating Loss Distribution of Loan Portfolio: Default Only Analysis ASSUME ONLY SOURCE OF CREDIT RISK IS DEFAULT FACTORS NEEDED TO SIMULATE LOSS DISTRIBUTION: – Credit Exposure per Obligor – Probability of Default (by risk rating, industry, etc. ) and correlations of probability of default – Probability distribution of Loss in the Event of Default (LIED) (a. k. a. LGD) 136
 Economic Capital Factors affecting the width of distribution of potential credit loss for default only analysis: – Statistical uncertainty in how many obligors will default - even if risk ratings, default probabilities and correlations of default were precisely known – Uncertainty in which obligors default - important for an inhomogeneous book – Uncertainty in credit exposure at default – Uncertainty in loss in the event of default – Uncertainty in assumptions/data • risk assessment of obligors – lack of transparency and lack of standardization of financial information. • Uncertainty in probability of default (e. g. effect of uncertain future economic conditions). • Uncertainty in correlations of default TWO PORTFOLIOS WITH CREDIT RISK COULD HAVE IDENTICAL EXPECTED LOSSES AND VASTLY DIFFERENT UNEXPECTED LOSSES. 137
 Simulating Loss Distribution of Loan Portfolio: Full Economic Analysis Factors needed for simulation: – Credit Exposure (particularly important for counterparty risk) – Volatilities and correlations of changes in general credit spreads (by risk rating, industry etc. ) – Migration of risk rating of individual obligors and correlations of migration. – Probability of default (by risk rating industry, etc. ) and correlations of probability of default. – Probablity distribution of Loss in the Event of Default (LIED) 138
 IX. Operational Risk 139
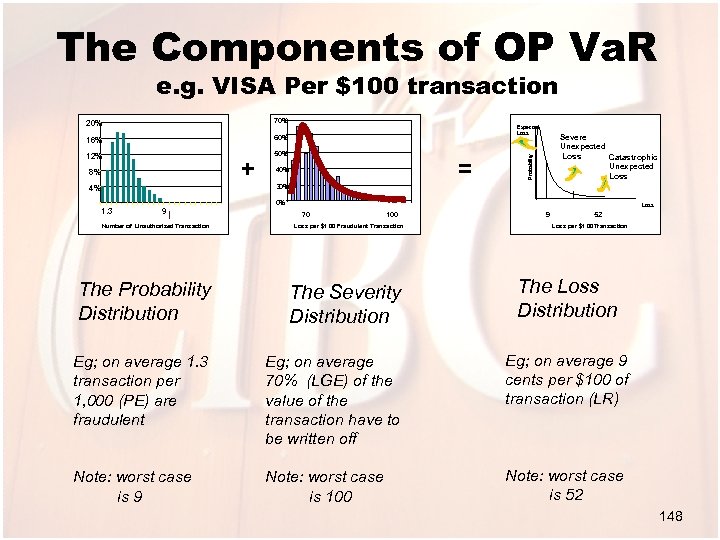
 Operational Risk n Definition: – Risk of direct or indirect loss resulting from inadequate or failed internal processes, people and systems of external events – Excludes “Business Risk” and “Strategic Risk” n Spectrum of approaches – Basic indicator - based on a single indicator – Standardized approach - divides banks’ activities into a number of standardized industry business lines – Internal measurement approach n Approximately 20% current capital charge 140
 CIBC Operational Risk Losses Types 1. Legal Liability: inludes client, employee and other third party law suits 2. Regulatory, Compliance and Taxation Penalties: fines, or the cost of any other penalties, such as license revocations and associated costs - excludes lost / forgone revenue. 3. Loss of or Damage to Assets: reduction in value of the firm’s non-financial asset and property 4. Client Restitution: includes restitution payments (principal and/or interest) or other compensation to clients. 5. Theft, Fraud and Unauthorized Activities: includes rogue trading 6. Transaction Processing Risk: includes failed or late settlement, wrong amount or wrong counterparty 141
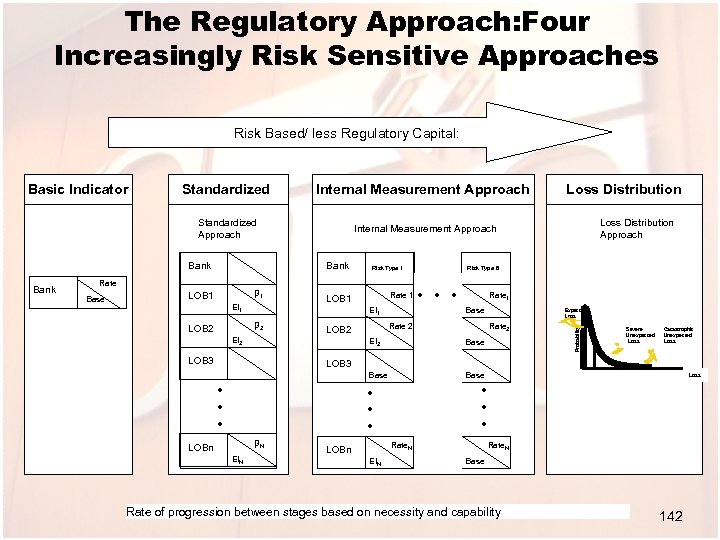 The Regulatory Approach: Four Increasingly Risk Sensitive Approaches Risk Based/ less Regulatory Capital: Standardized Internal Measurement Approach Standardized Approach Internal Measurement Approach Bank Rate Base 1 LOB 1 EI 1 Rate 1 LOB 1 Rate 1 Base Rate 2 LOB 2 EI 2 Expected Loss Rate 2 EI 2 Base LOB 3 Loss Distribution Approach Risk Type 6 EI 1 2 LOB 2 Risk Type 1 Loss Distribution Probability Bank • • • Basic Indicator Severe Unexpected Loss Catastrophic Unexpected Loss Base LOB 3 • • • N LOBn EIN Rate. N LOBn EIN Loss Rate. N Base Rate of progression between stages based on necessity and capability 142
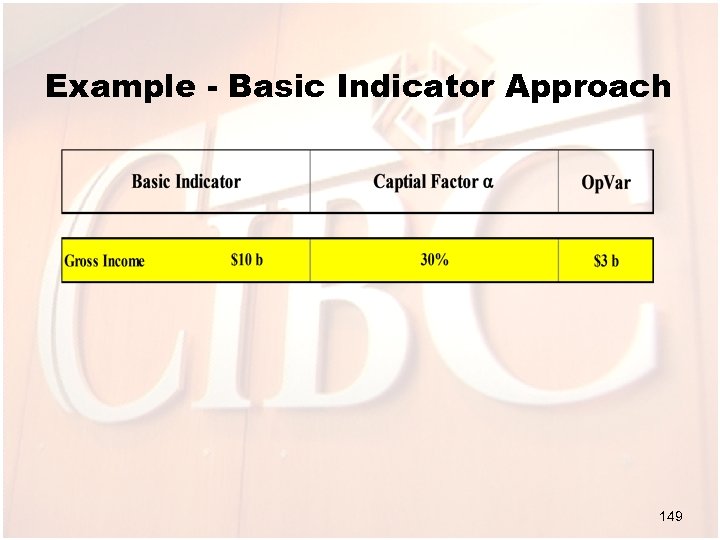
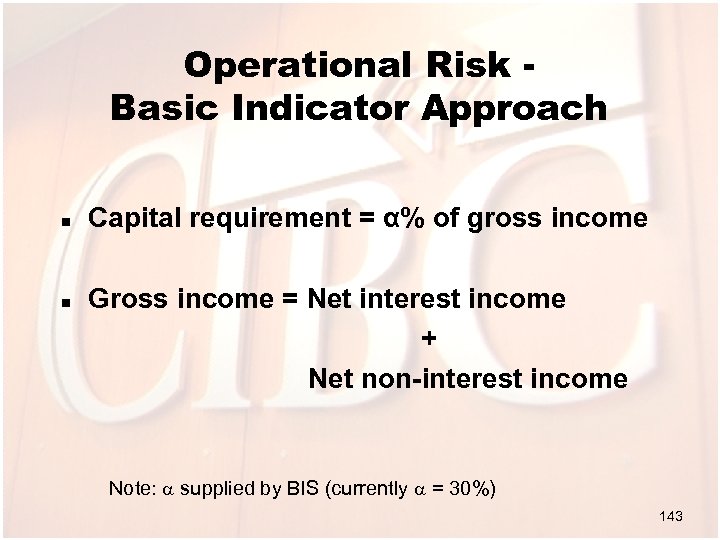 Operational Risk Basic Indicator Approach n n Capital requirement = α% of gross income Gross income = Net interest income + Net non-interest income Note: supplied by BIS (currently = 30%) 143
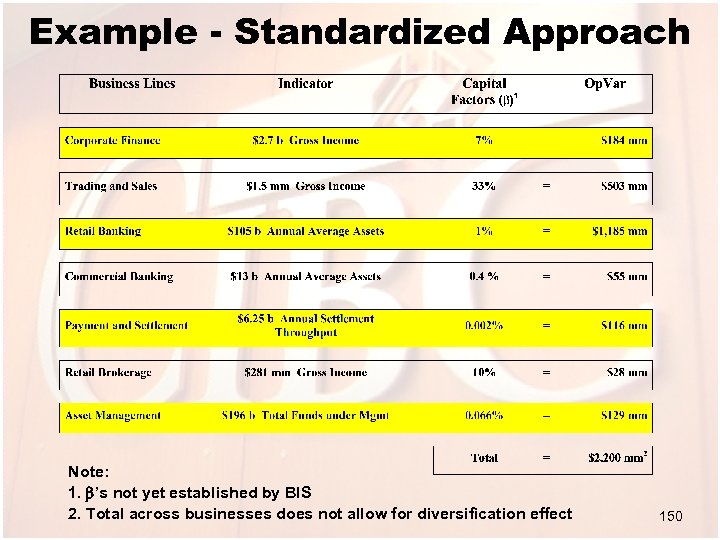
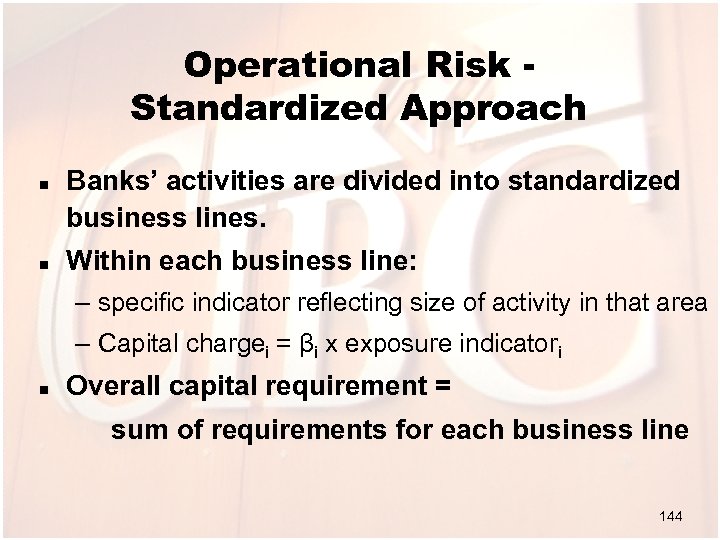 Operational Risk Standardized Approach n n Banks’ activities are divided into standardized business lines. Within each business line: – specific indicator reflecting size of activity in that area – Capital chargei = βi x exposure indicatori n Overall capital requirement = sum of requirements for each business line 144
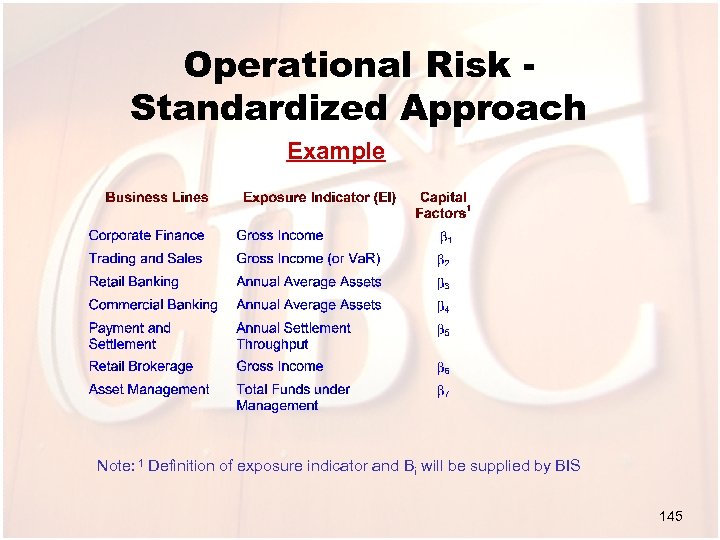 Operational Risk Standardized Approach Example Note: 1 Definition of exposure indicator and Bi will be supplied by BIS 145
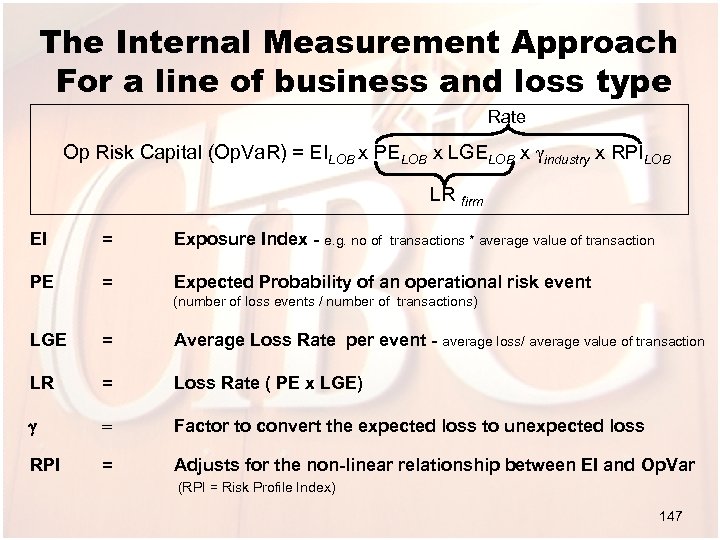
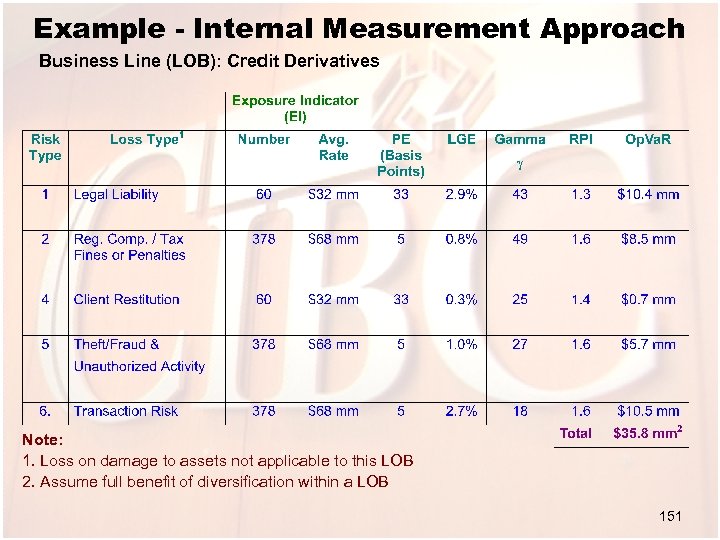
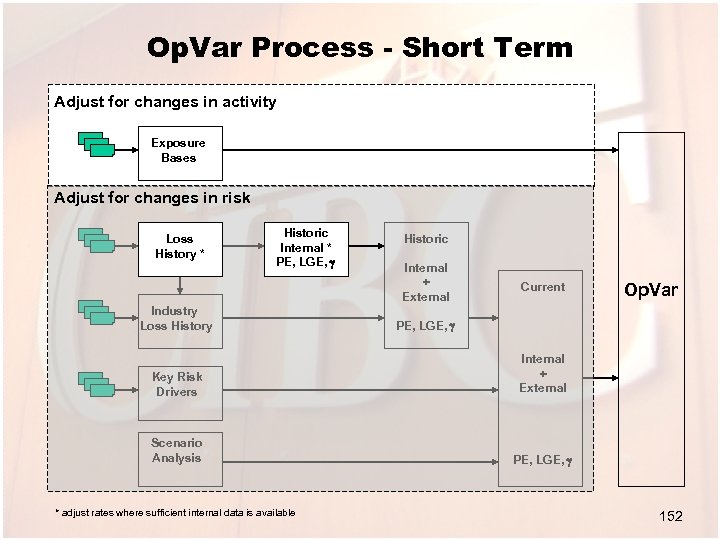
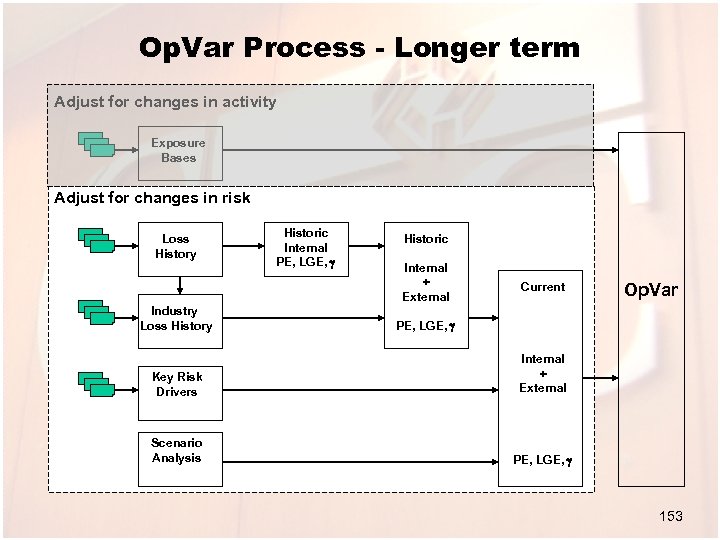
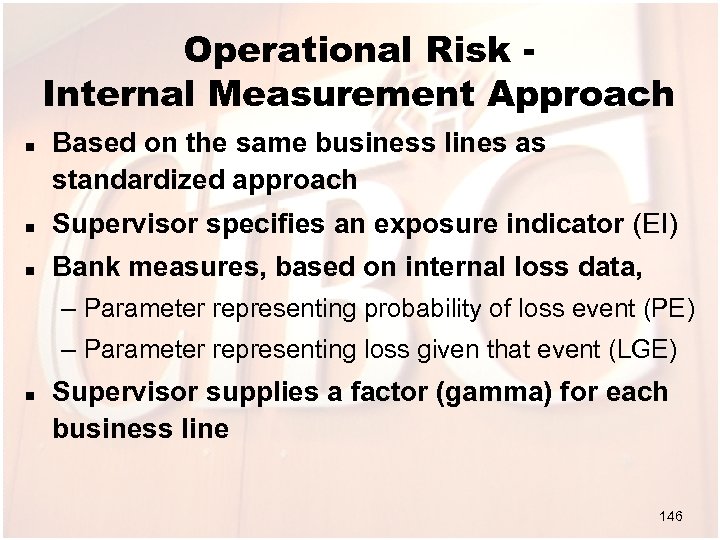 Operational Risk Internal Measurement Approach n Based on the same business lines as standardized approach n Supervisor specifies an exposure indicator (EI) n Bank measures, based on internal loss data, – Parameter representing probability of loss event (PE) – Parameter representing loss given that event (LGE) n Supervisor supplies a factor (gamma) for each business line 146
 The Internal Measurement Approach For a line of business and loss type Rate Op Risk Capital (Op. Va. R) = EILOB x PELOB x LGELOB x gindustry x RPILOB LR firm EI = Exposure Index - e. g. no of PE = Expected Probability of an operational risk event transactions * average value of transaction (number of loss events / number of transactions) LGE = Average Loss Rate per event - average loss/ average value of transaction LR = Loss Rate ( PE x LGE) g = Factor to convert the expected loss to unexpected loss RPI = Adjusts for the non-linear relationship between EI and Op. Var (RPI = Risk Profile Index) 147
 The Components of OP Va. R e. g. VISA Per $100 transaction 70% 16% 60% 12% 50% + 8% Expected Loss = 40% Severe Unexpected Loss Catastrophic Unexpected Loss Probability 20% 30% 4% 1. 3 0% 9 Number of Unauthorized Transaction Loss 70 100 Loss per $1 00 Fraudulent Transaction 9 52 Loss per $1 00 Transaction The Loss Distribution The Probability Distribution The Severity Distribution Eg; on average 1. 3 transaction per 1, 000 (PE) are fraudulent Eg; on average 70% (LGE) of the value of the transaction have to be written off Eg; on average 9 cents per $100 of transaction (LR) Note: worst case is 9 Note: worst case is 100 Note: worst case is 52 148
 Example - Basic Indicator Approach 149
 Example - Standardized Approach Note: 1. ’s not yet established by BIS 2. Total across businesses does not allow for diversification effect 150
 Example - Internal Measurement Approach Business Line (LOB): Credit Derivatives Note: 1. Loss on damage to assets not applicable to this LOB 2. Assume full benefit of diversification within a LOB 151
 Op. Var Process - Short Term Adjust for changes in activity Exposure Bases Adjust for changes in risk Loss History * Historic Internal * PE, LGE, g Industry Loss History Historic Internal + External Current Op. Var PE, LGE, g Key Risk Drivers Internal + External Scenario Analysis PE, LGE, g * adjust rates where sufficient internal data is available 152
 Op. Var Process - Longer term Adjust for changes in activity Exposure Bases Adjust for changes in risk Loss History Industry Loss History Historic Internal PE, LGE, g Historic Internal + External Current Op. Var PE, LGE, g Key Risk Drivers Internal + External Scenario Analysis PE, LGE, g 153
 X. Appendix 154
 1. Risk Weight for Corporate Exposure Operational Risk Related: 2. Operational Risk’s Loss Types 3. Exposure Base, PE, LGE 4. Eligibility Criteria for IMA 5. Operational Risk Disclosures: Pillar 3 6. Book announcement: Risk Management by M. Crouhy, D. Galai and R. Mark 155
 Appendix 1 Risk Weight for Corporate Exposure Corporate benchmark risk weight: 1 PD is expressed as a decimal (e. g. , 0. 01 for 1 percent) 156
 n n N(1. 118 x. G(PD)+1. 288) = sum of expected and unexpected losses associated with a hypothetical, infinitely-granular portfolio of one-year loan having an LGD of 100%, using a so-called Merton-style credit risk model in which there is a single systematic risk factor and the values of borrowers’ assets are assumed lognormally distributed, a confidence level of 99. 5% and an average correlation of 20% The term (1+. 0470 x(1 -PD)/PD 0. 44) is an adjustment to reflect that the IRB benchmark risk weights are calibrated to a 3 -year average maturity; and the scaling factor 976. 5, which is calibrated so that the IRB benchmark risk weight equals 100% for values of PD and LGD equal to 0. 7% and 50% respectively. 157
 Maturity Adjustments to The Risk Weights, Derived From MTM-models 158
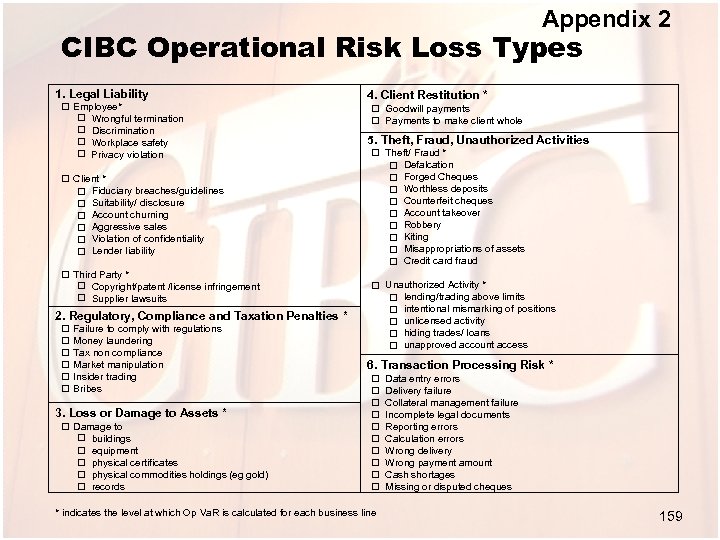 Appendix 2 CIBC Operational Risk Loss Types 1. Legal Liability Employee* Wrongful termination Discrimination Workplace safety Privacy violation 4. Client Restitution * Goodwill payments Payments to make client whole 5. Theft, Fraud, Unauthorized Activities Theft/ Fraud * Defalcation Forged Cheques Worthless deposits Counterfeit cheques Account takeover Robbery Kiting Misappropriations of assets Credit card fraud Client * Fiduciary breaches/guidelines Suitability/ disclosure Account churning Aggressive sales Violation of confidentiality Lender liability Third Party * Copyright/patent /license infringement Supplier lawsuits Unauthorized Activity * lending/trading above limits intentional mismarking of positions unlicensed activity hiding trades/ loans unapproved account access 2. Regulatory, Compliance and Taxation Penalties * Failure to comply with regulations Money laundering Tax non compliance Market manipulation Insider trading Bribes 6. Transaction Processing Risk * 3. Loss or Damage to Assets * Damage to buildings equipment physical certificates physical commodities holdings (eg gold) records * indicates the level at which Op Va. R is calculated for each business line Data entry errors Delivery failure Collateral management failure Incomplete legal documents Reporting errors Calculation errors Wrong delivery Wrong payment amount Cash shortages Missing or disputed cheques 159
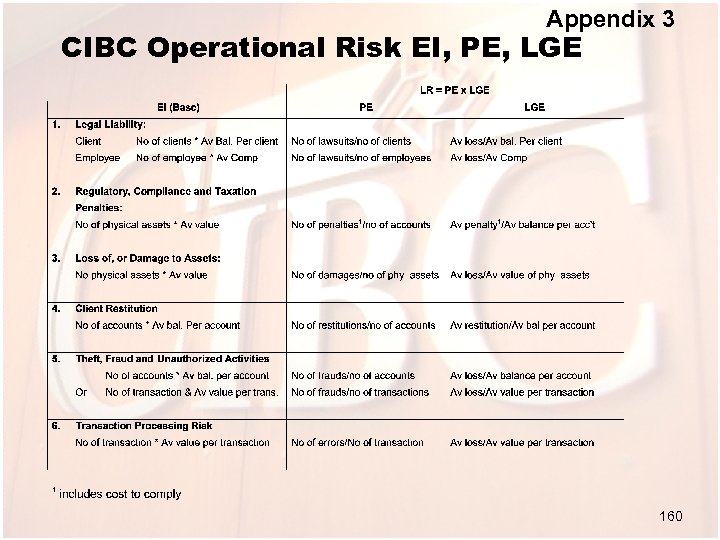 Appendix 3 CIBC Operational Risk EI, PE, LGE 160
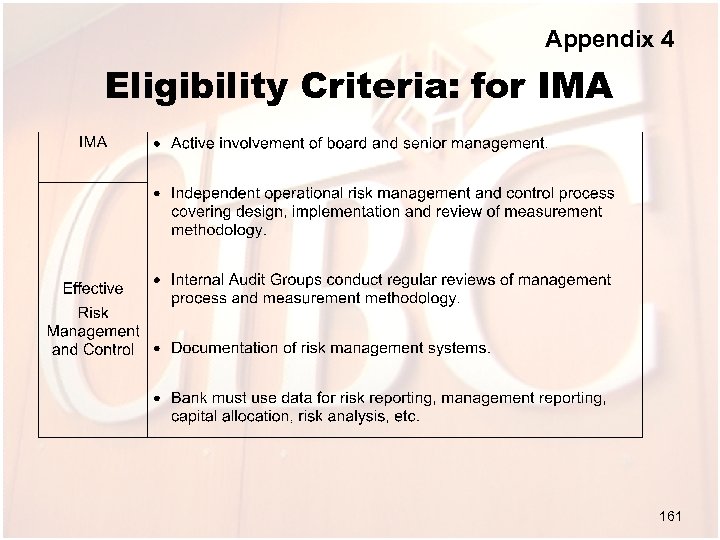 Appendix 4 Eligibility Criteria: for IMA 161
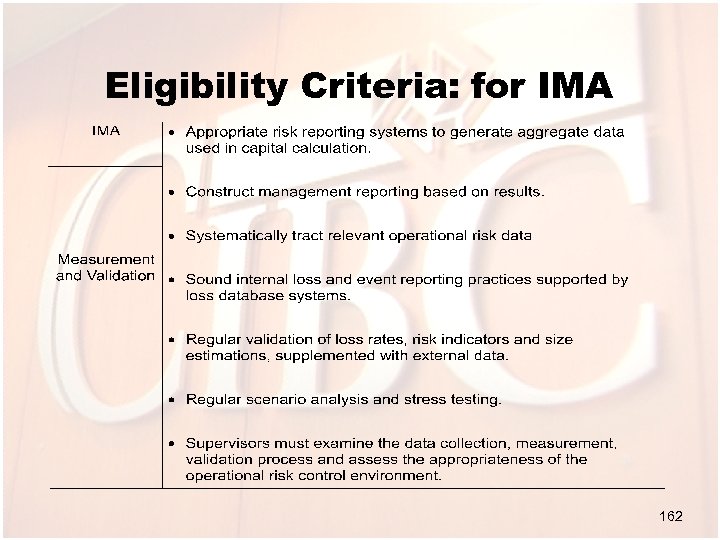 Eligibility Criteria: for IMA 162
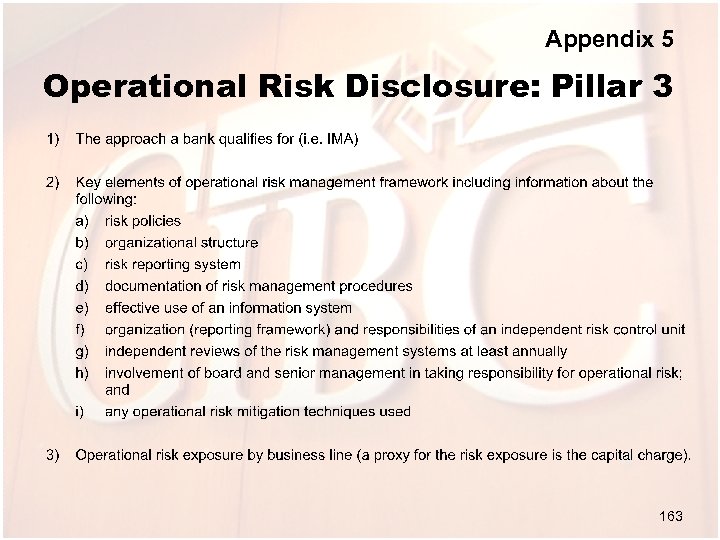 Appendix 5 Operational Risk Disclosure: Pillar 3 163
 164
164
 165
165
 ohg\2000yorku_2000. ppt Monday March 20, 2000 166


