
RESEARCH OF NANOPOWDERS PROPERTIES PURE AND DOPED METAL


2012_tomsk_11cmm_oral_report_sokovnin.ppt
- Размер: 7.5 Mегабайта
- Количество слайдов: 46
Описание презентации RESEARCH OF NANOPOWDERS PROPERTIES PURE AND DOPED METAL по слайдам
RESEARCH OF NANOPOWDERS PROPERTIES PURE AND DOPED METAL OXIDES PRODUCED BY A METHOD OF PULSED ELECTRON BEAM EVAPORATION S. Yu. Sokovnin¹, ² V. G. Il’ves¹ 1 -Institute of Electrophysics, Ural Branch RAS, 106 Amundsen St. , Yekaterinburg, Russia; 620216 2 — Ural Federal University named after First President of Russia B. N. Yeltsin, 19, ul. Mira, Yekaterinburg , e-mail: sokovnin@iep. uran. ru
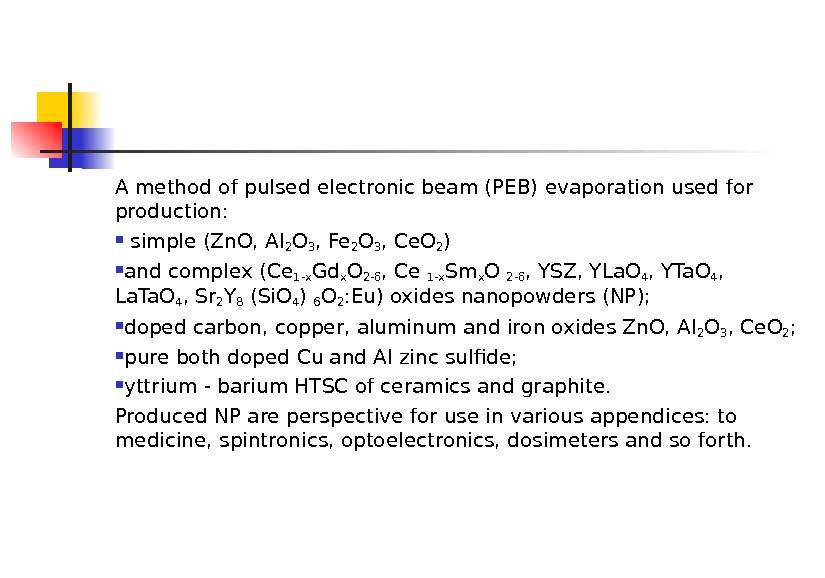
A method of pulsed electronic beam (PEB) evaporation used for production : simple (Zn. O, Al 2 O 3 , Fe 2 O 3 , Ce. O 2 ) and complex (Ce 1 -x Gd x O 2 -δ , Ce 1 -x Sm x O 2 -δ , YSZ, YLa. O 4 , YTa. O 4 , La. Ta. O 4 , Sr 2 Y 8 (Si. O 4 ) 6 O 2 : Eu) oxides nanopowders (NP); doped carbon, copper, aluminum and iron oxides Zn. O, Al 2 O 3 , Ce. O 2 ; pure both doped С u and Al zinc sulfide; yttrium — barium HTSC of ceramics and graphite. Produced NP are perspective for use in various appendices: to medicine, spintronics, optoelectronics, dosimeters and so forth.
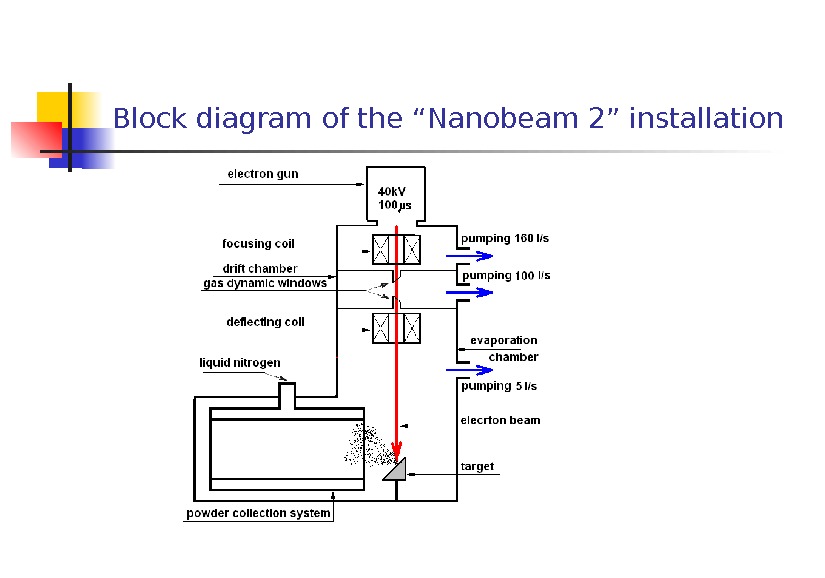
Block diagram of the “Nanobeam 2” installation
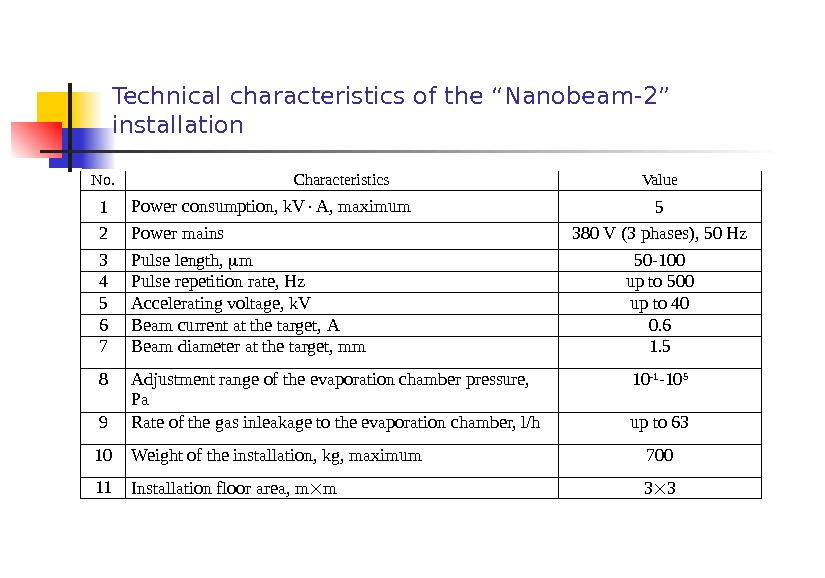
Technical characteristics of the “Nanobeam-2” installation No. Characteristics Value 1 Power consumption, k. V A, maximum 5 2 Power mains 380 V (3 phases ), 50 Hz 3 Pulse length, m 50 -100 4 Pulse repetition rate , Hz up to 500 5 Accelerating voltage, k. V up to 40 6 Beam current at the target, А 0. 6 7 Beam diameter at the target, mm 1. 5 8 Adjustment range of the evaporation chamber pressure, Pa 10 -1 -10 5 9 Rate of the gas inleakage to the evaporation chamber, l/h up to 63 10 Weight of the installation, kg, maximum 700 11 Installation floor area, m m
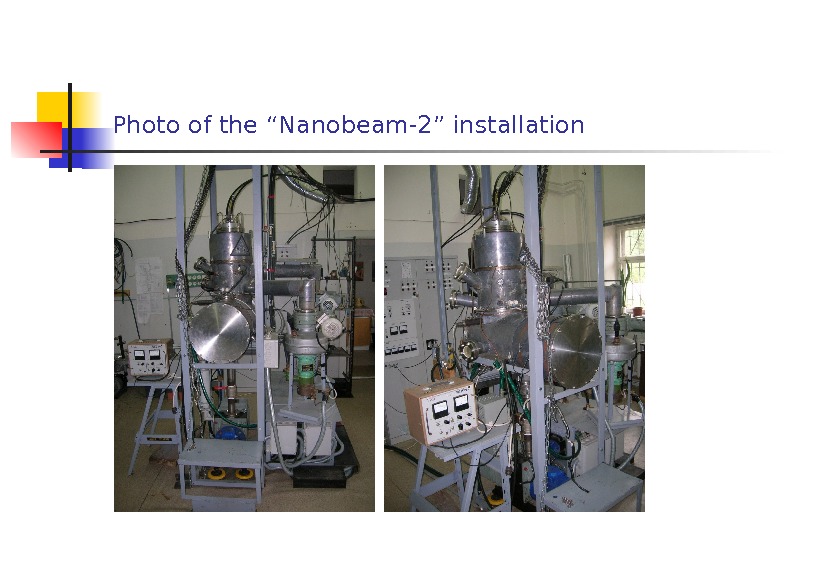
Photo of the “Nanobeam-2” installation
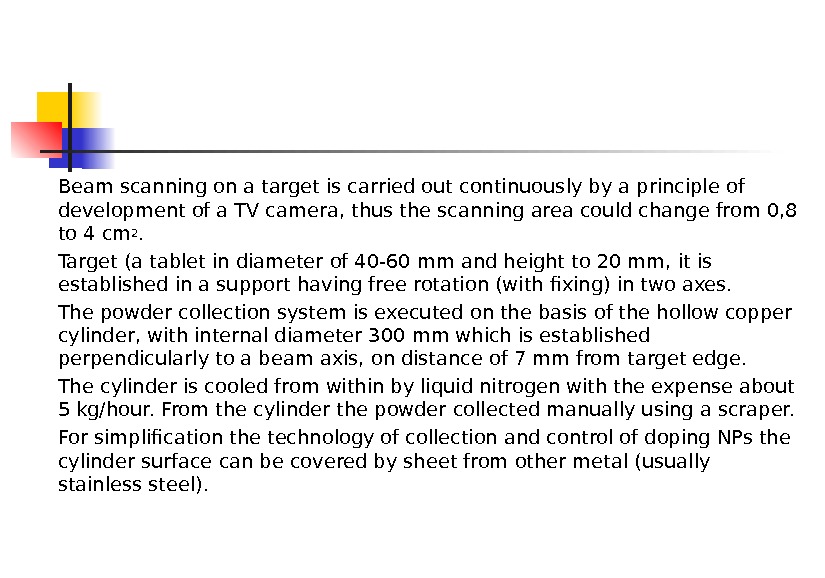
Beam scanning on a target is carried out continuously by a principle of development of a TV camera, thus the scanning area could change from 0, 8 to 4 cm 2. Target (a tablet in diameter of 40 -60 mm and height to 20 mm, it is established in a support having free rotation (with fixing) in two axes. The powder collection system is executed on the basis of the hollow copper cylinder, with internal diameter 300 mm which is established perpendicularly to a beam axis, on distance of 7 mm from target edge. The cylinder is cooled from within by liquid nitrogen with the expense about 5 kg/hour. From the cylinder the powder collected manually using a scraper. For simplification the technology of collection and control of doping NPs the cylinder surface can be covered by sheet from other metal (usually stainless steel).
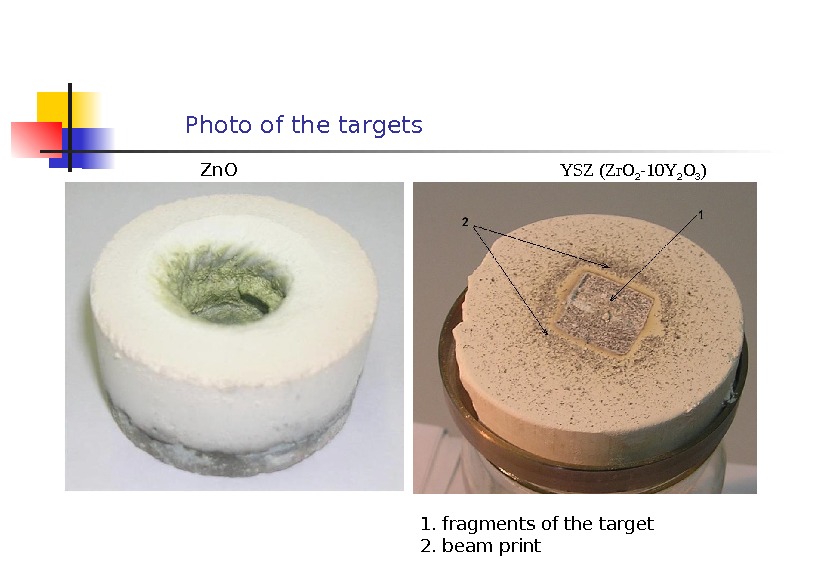
Photo of the targets Zn. O YSZ (Zr. O 2 -10 Y 2 O 3 ) 1. fragments of the target 2. beam print
Photo of the “Nanobeam-2” powder collection system
For examination of the materials were used: The specific surface of the powders S s was measured by the BET method on a Tri. Star 3000 V 6. 03 analyzer. The chemical composition of the powders was determined and the X-ray diffraction analysis was performed using standard methods on a D 8 Discover X-ray diffractometer. С hemical analyses was made by ICP method. The microscopic analysis was made in LEO-982 and JEOL 2100 scanning electron microscopes. A Faraday balance and a KLAVI analyzer were used for measurements of magnetic and luminescence characteristics of NPs.
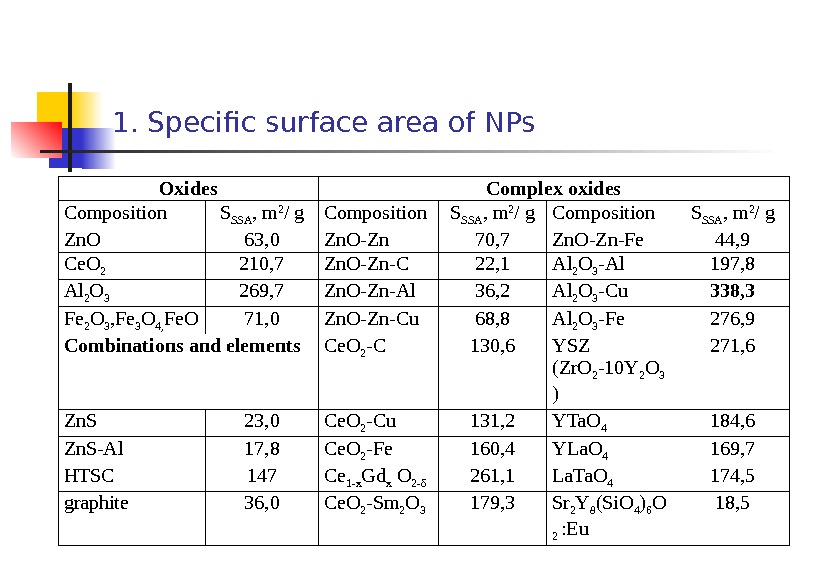
1. Specific surface area of NPs Oxides Complex oxides С omposition S SSA , m 2 / g Composition S SSA , m 2 / g Zn. O 63, 0 Zn. O-Zn 70, 7 Zn. O-Zn-Fe 44, 9 Ce. O 2 210, 7 Zn. O-Zn-C 22, 1 Al 2 O 3 -Al 197, 8 Al 2 O 3 269, 7 Zn. O-Zn-Al 36, 2 Al 2 O 3 -Cu 338, 3 Fe 2 O 3 , Fe 3 O 4, Fe. O 71, 0 Zn. O-Zn-Cu 68, 8 Al 2 O 3 -Fe 276, 9 Combinations and elements Ce. O 2 -C 130, 6 YSZ (Zr. O 2 -10 Y 2 O 3 ) 271, 6 Zn. S 23, 0 Ce. O 2 -Cu 131, 2 YTa. O 4 184, 6 Zn. S-Al 17, 8 Ce. O 2 -Fe 160, 4 YLa. O 4 169, 7 HTSC 147 Ce 1 -x Gd x O 2 -δ 261, 1 La. Ta. O 4 174, 5 graphite 36, 0 Ce. O 2 -Sm 2 O 3 179, 3 Sr 2 Y 8 (Si. O 4 ) 6 O 2 : Eu 18,
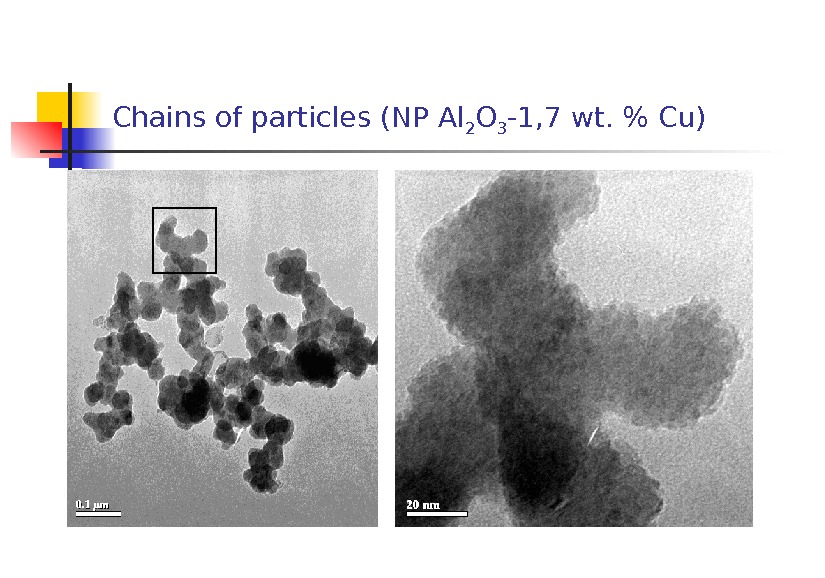
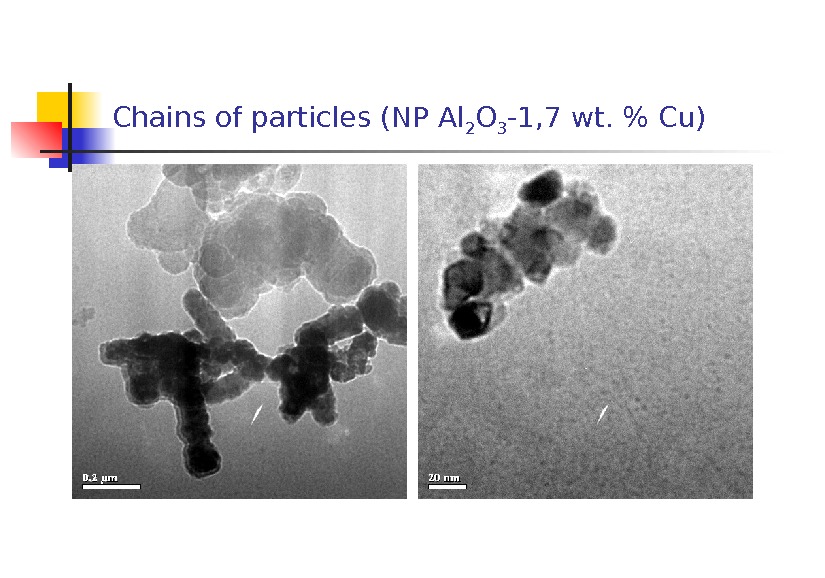
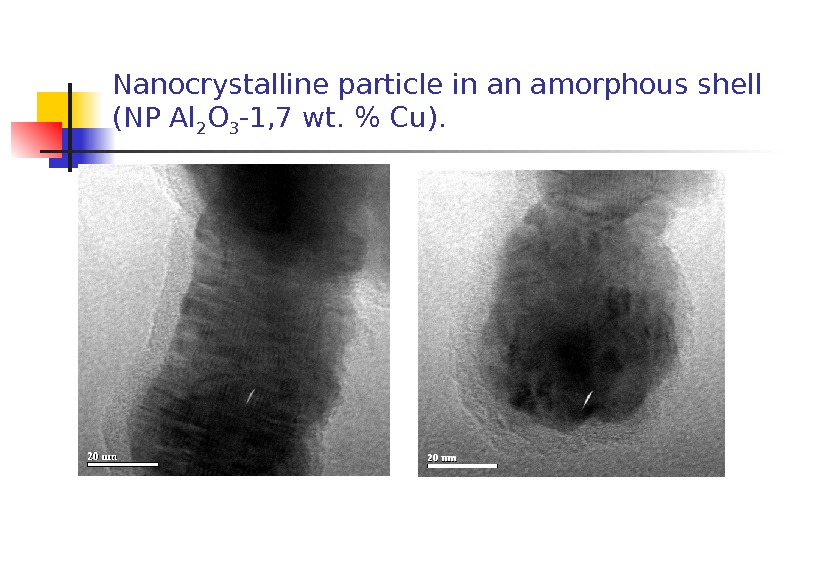
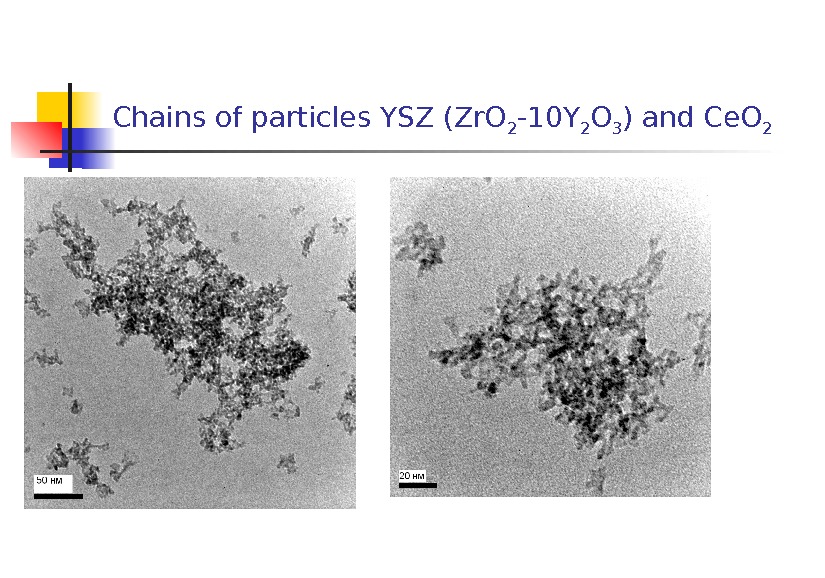
2. Features in common of the morphology of the NPs were as follows: 1) coarse shapeless and spherical particles up to 10 m in size most probably presenting fragments of the target; 2) shapeless amorphous particles 40 nm to 1 m in size whose electron diffraction pattern of a selected area was a characteristic halo; 3) chains of particles 50 -70 nm in size , each representing agglomerates of particles about 5 nm in size; 4) crystals covered with an amorphous layer 2 to 10 nm thick.
Chains of particles (NP Al 2 O 3 -1, 7 wt. % С u)
Chains of particles (NP Al 2 O 3 -1, 7 wt. % С u)
Nanocrystalline particle in an amorphous shell (NP Al 2 O 3 -1, 7 wt. % С u).
Chains of particles YSZ (Zr. O 2 -10 Y 2 O 3 ) and Ce. O
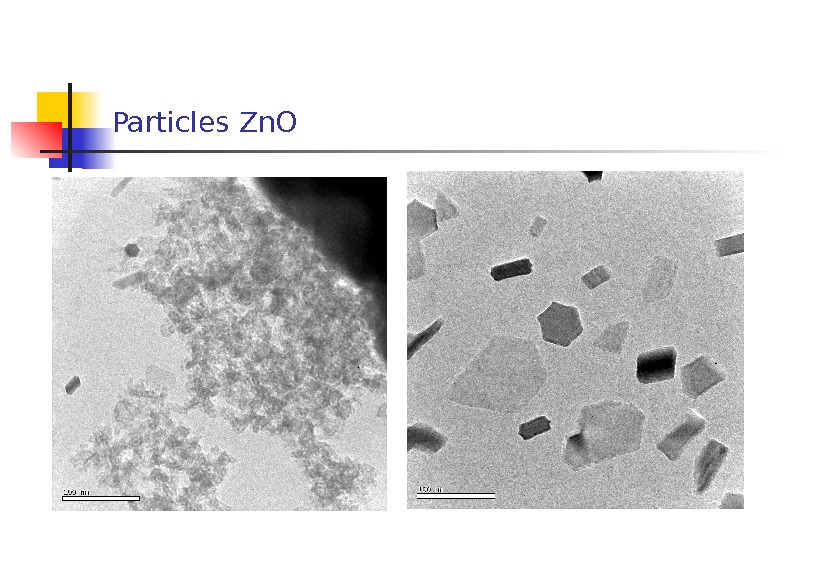
Particles Zn. O
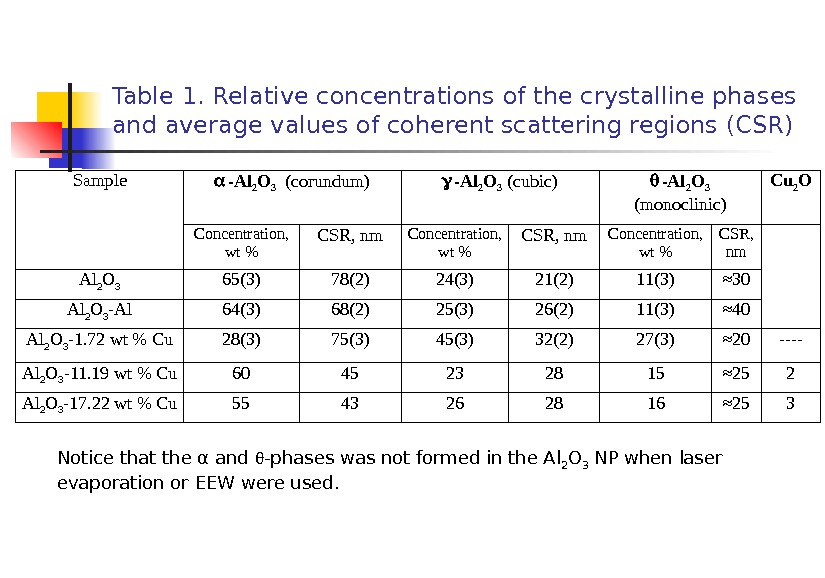
3. There is formation NP different on the phase structure from an evaporated material An XRD analysis showed that all the NPs contained three crystalline phases: -Al 2 O 3 ( corundum) , -Al 2 O 3 (cubic), and -Al 2 O 3 (monoclinic) phases. Of rough powder Fe 2 O 3 it was formed NP in the form of a mix of three phases of iron oxide and an amorphous phase. For NP on the basis of Zn. O targets produced by evaporation from metal zinc or various mixes from micron powder Zn. O, bimodal distribution of phase Zn. O and presence of an amorphous phase is characteristic. All the NPs also contained an amorphous component.
Table 1. Relative concentrations of the crystalline phases and average values of coherent scattering regions (CSR) Sample -Al 2 O 3 ( corundum) -Al 2 O 3 ( cubic ) -Al 2 O 3 ( monoclinic ) С u 2 O Concentration , wt % CSR, nm Concentration, wt % CSR, nm Al 2 O 3 65(3) 78(2) 24(3) 21(2) 11(3) ≈ 30 Al 2 O 3 -Al 64(3) 68(2) 25(3) 26(2) 11(3) ≈ 40 Al 2 O 3 -1. 72 wt % Cu 28(3) 75(3) 45(3) 32(2) 27(3) ≈ 20 —- Al 2 O 3 -11. 19 wt % Cu 60 45 23 28 15 ≈ 25 2 Al 2 O 3 -17. 22 wt % Cu 55 43 26 28 16 ≈ 25 3 Notice that the α and -phases was not formed in the Al 2 O 3 NP when laser evaporation or EEW were used.
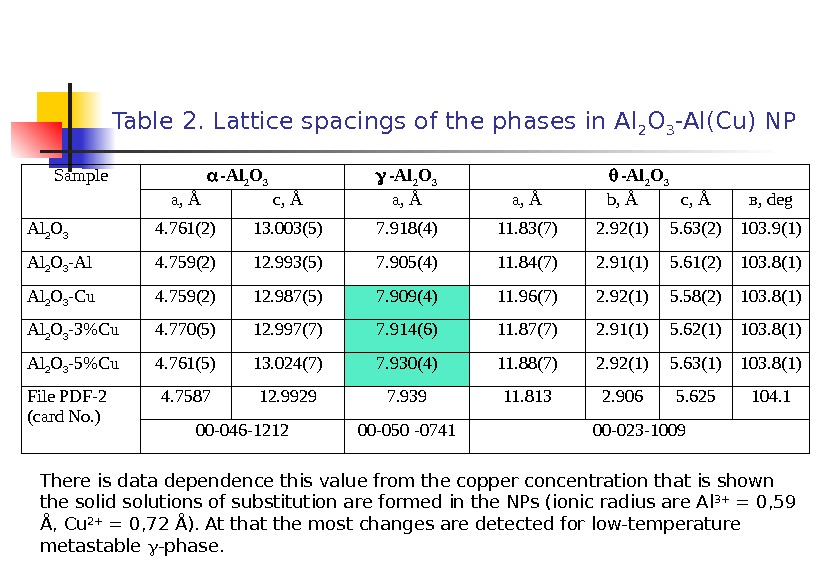
Table 2. Lattice spacings of the phases in Al 2 O 3 -Al(Cu) NP Sample -Al 2 O 3 a, Å c, Å a, Å b , Å c , Å в, deg Al 2 O 3 4. 761(2) 13. 003(5) 7. 918(4) 11. 83(7) 2. 92(1) 5. 63(2) 103. 9(1) Al 2 O 3 -Al 4. 759(2) 12. 993(5) 7. 905(4) 11. 84(7) 2. 91(1) 5. 61(2) 103. 8(1) Al 2 O 3 -Cu 4. 759(2) 12. 987(5) 7. 909(4) 11. 96(7) 2. 92(1) 5. 58(2) 103. 8(1) Al 2 O 3 -3%Cu 4. 770(5) 12. 997(7) 7. 914(6) 11. 87(7) 2. 91(1) 5. 62(1) 103. 8(1) Al 2 O 3 -5%Cu 4. 761(5) 13. 024(7) 7. 930(4) 11. 88(7) 2. 92(1) 5. 63(1) 103. 8(1) File PDF -2 ( card No. ) 4. 7587 12. 9929 7. 939 11. 813 2. 906 5. 625 104. 1 00 -046 -1212 00 -050 -0741 00 -023 -1009 There is data dependence this value from the copper concentration that is shown the solid solutions of substitution are formed in the NPs (ionic radius are Al 3+ = 0, 59 Å, С u 2+ = 0, 72 Å). At that the most changes are detected for low-temperature metastable -phase.
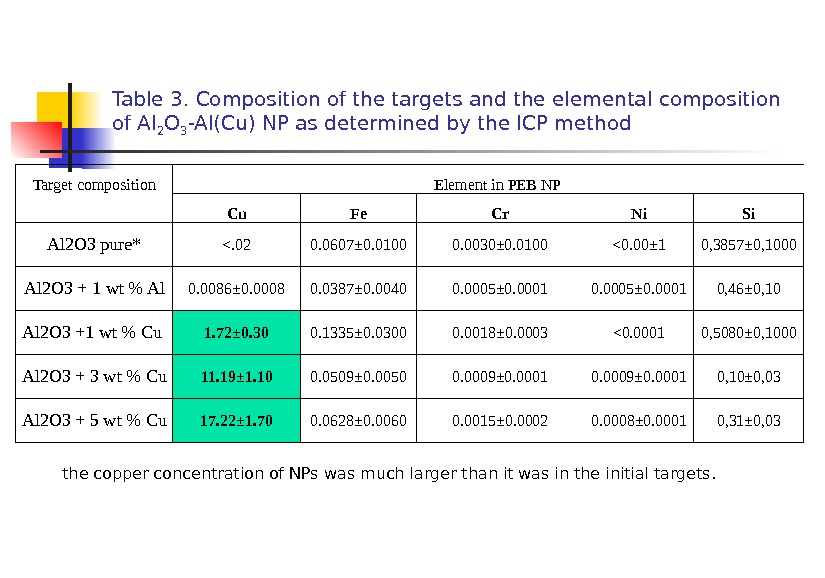
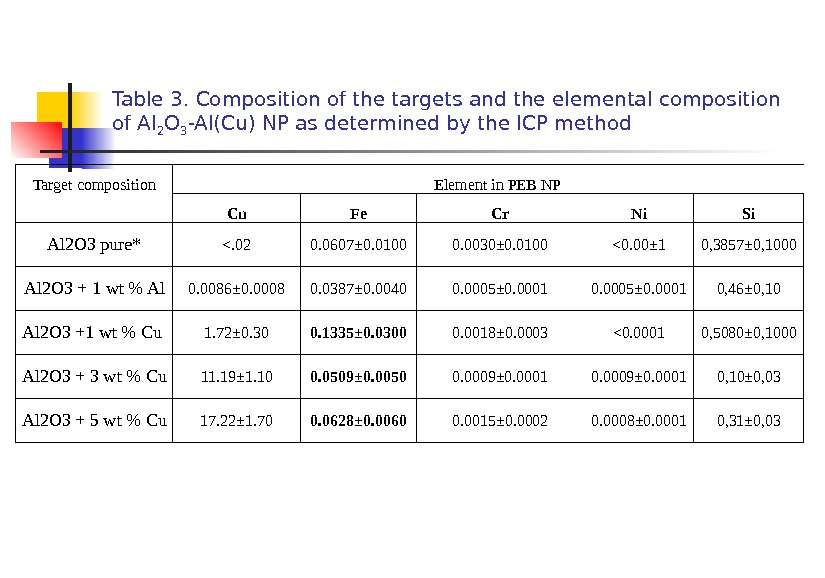
Table 3. Composition of the targets and the elemental composition of Al 2 O 3 -Al(Cu) NP as determined by the ICP method Target composition Element in PEB NP Cu Fe Cr Ni Si Al 2 O 3 pure* <. 02 0. 0607± 0. 0100 0. 0030± 0. 0100 <0. 00± 1 0, 3857± 0, 1000 Al 2 O 3 + 1 wt % Al 0. 0086± 0. 0008 0. 0387± 0. 0040 0. 0005± 0. 0001 0, 46± 0, 10 Al 2 O 3 +1 wt % Cu 1. 72± 0. 30 0. 1335± 0. 0300 0. 0018± 0. 0003 <0. 0001 0, 5080± 0, 1000 Al 2 O 3 + 3 wt % Cu 11. 19± 1. 10 0. 0509± 0. 0050 0. 0009± 0. 0001 0, 10± 0, 03 Al 2 O 3 + 5 wt % Cu 17. 22± 1. 70 0. 0628± 0. 0060 0. 0015± 0. 0002 0. 0 008± 0. 0001 0, 31± 0, 03 the copper concentration of NPs was much larger than it was in the initial targets.
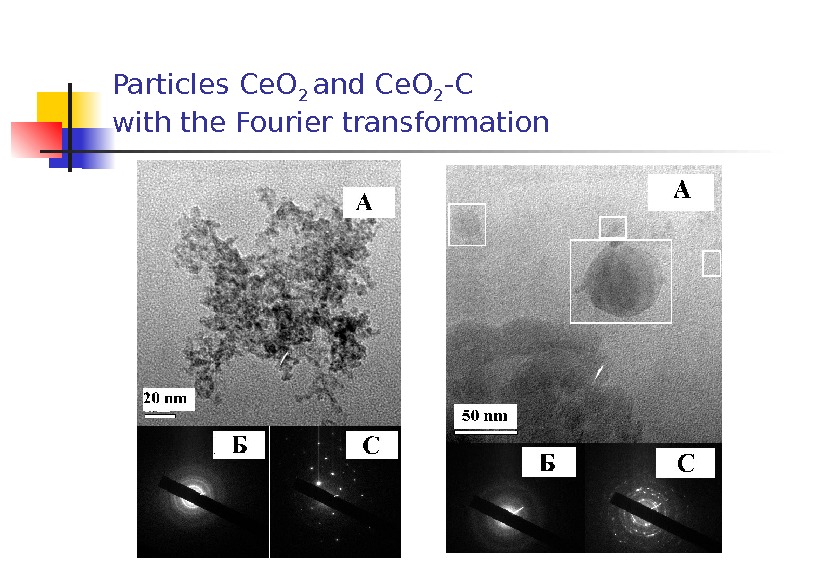
Particles Ce. O 2 and Ce. O 2 — C with the Fourier transformation
The ferromagnetic properties of Al 2 O 3 nanoparticles (NPTs) were found for the first time in Sunderesan et al. A. Physical Review. B. 74 , 161306 (2006). The specific magnetization of NPTs, which were synthesized by annealing of Al(OH) 3 at 500 C was ~3. 5 103 emu/g at 300 K. The NPTs retained their ferromagnetic properties to a temperature of 390 K. It follows from a TEM image in paper that the NPTs had amorphous state.
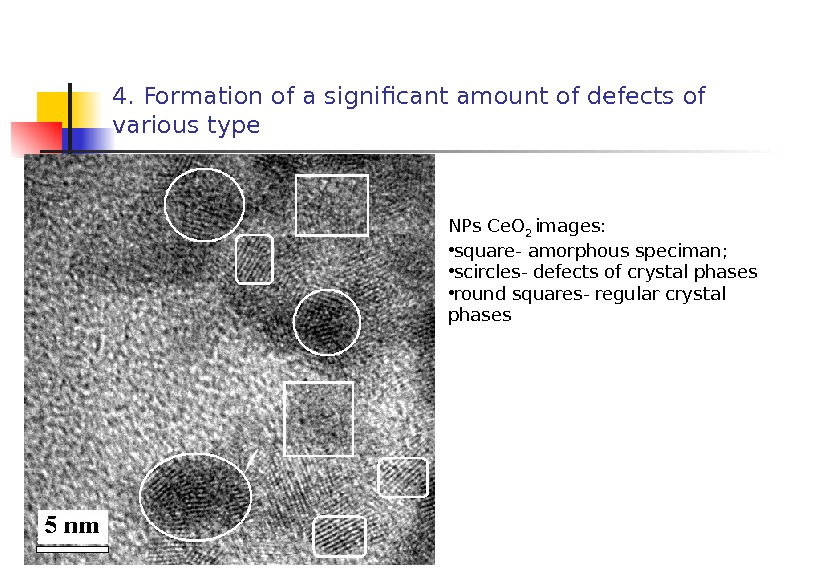
4. Formation of a significant amount of defects of various type NPs С e. O 2 images: • square- amorphous speciman; • scircles- defects of crystal phases • round squares- regular crystal phases
4. Formation of a significant amount of defects of various type NPs С e. O 2 images: • square- amorphous speciman; • scircles- defects of crystal phases • round squares- regular crystal phases
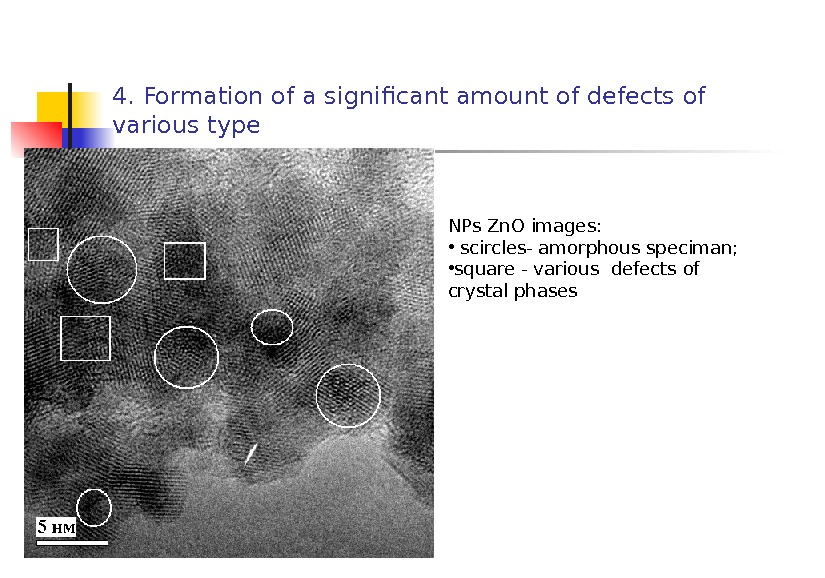
4. Formation of a significant amount of defects of various type NPs Zn. O images: • scircles- amorphous speciman; • square — various defects of crystal phases
The ferromagnetic properties of Al 2 O 3 nanoparticles (NPTs) were found for the first time in Sunderesan et al. A. Physical Review. B. 74 , 161306 (2006). The specific magnetization of NPTs, which were synthesized by annealing of Al(OH) 3 at 500 C was ~3. 5 103 emu/g at 300 K. The NPTs retained their ferromagnetic properties to a temperature of 390 K. It follows from a TEM image in paper that the NPTs had amorphous state.
The ferromagnetic properties of Al 2 O 3 nanoparticles (NPTs) were found for the first time in Sunderesan et al. A. Physical Review. B. 74 , 161306 (2006). The specific magnetization of NPTs, which were synthesized by annealing of Al(OH) 3 at 500 C was ~3. 5 103 emu/g at 300 K. The NPTs retained their ferromagnetic properties to a temperature of 390 K. It follows from a TEM image in paper that the NPTs had amorphous state.
Al 2 O 3 and Al 2 O 3 -Al NPs were extremely inhomogeneous in the magnetic respect as could be seen from a considerable difference in magnetization measured on different portions of the powders. A high inhomogeneity could be due to the presence of magnetic impurities in the powders. The magnetization data were reproduced only for Al 2 O 3 — С u NPs on a glass substrate. Magnetization of Al 2 O 3 -1. 7% Cu NP was about 0. 02 Gs cm 3 /g, which was much larger than the ferromagnetic response from the target ( 0. 001 Gs cm 3 /g) resulting, most probably, from impurities.
Generally, magnetization of the Al 2 O 3 -Cu powders was higher than that of Al 2 O 3 NPs [Sunderesan et al. A. Physical Review. B. 74 , 161306 (2006). ] synthesized by thermal heating of aluminum hydroxide. Most probably, this was due to the presence of magnetic Cu 2+ ions and a high defect content of the NPs synthesized by PEB evaporation. The defect content of the structure was much smaller when a chemical method was used.
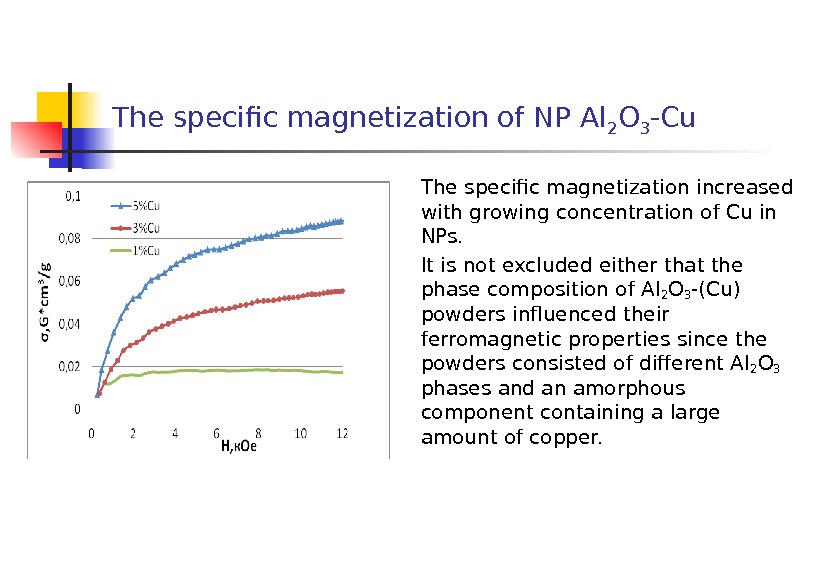
The specific magnetization of NP Al 2 O 3 -Cu The specific magnetization increased with growing concentration of Cu in NPs. It is not excluded either that the phase composition of Al 2 O 3 -(Cu) powders influenced their ferromagnetic properties since the powders consisted of different Al 2 O 3 phases and an amorphous component containing a large amount of copper.
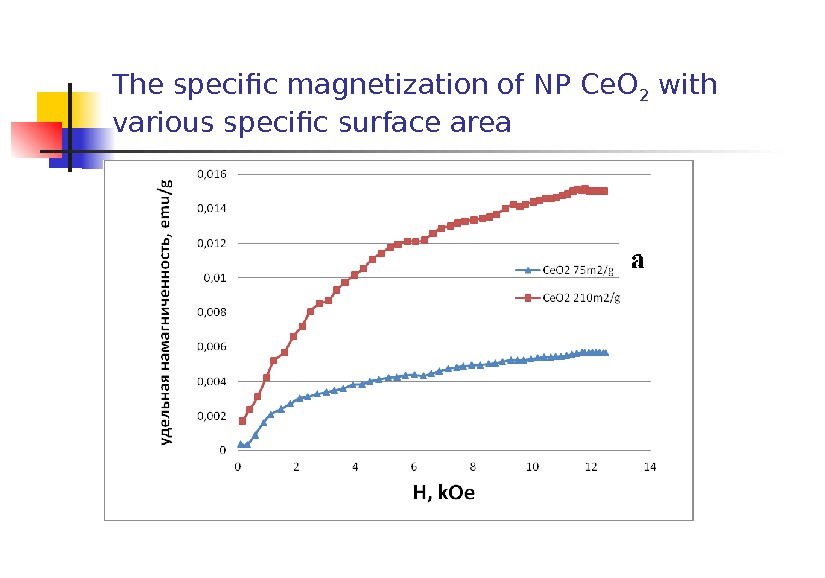
The specific magnetization of NP Ce. O 2 with various specific surface area
The specific magnetization of NP Al 2 O 3 -Cu The specific magnetization increased with growing concentration of Cu in NPs. It is not excluded either that the phase composition of Al 2 O 3 -(Cu) powders influenced their ferromagnetic properties since the powders consisted of different Al 2 O 3 phases and an amorphous component containing a large amount of copper.
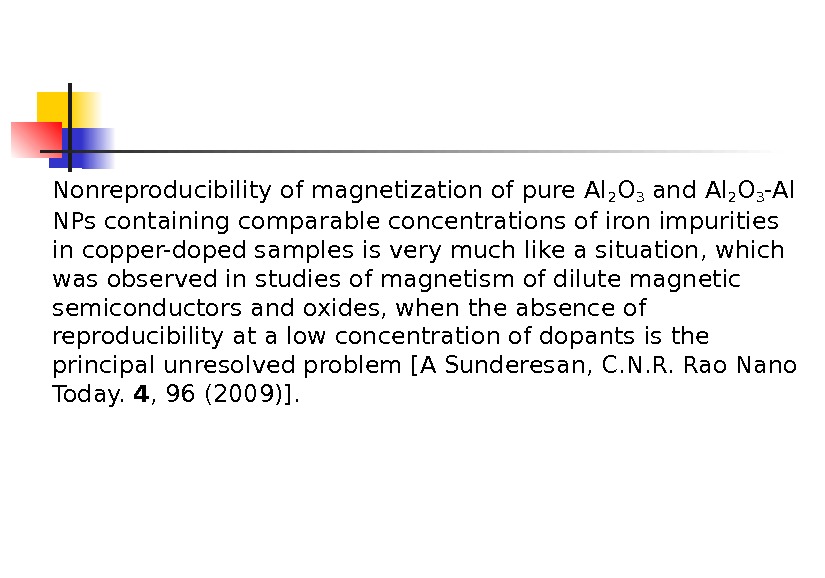
Nonreproducibility of magnetization of pure Al 2 O 3 and Al 2 O 3 -Al NPs containing comparable concentrations of iron impurities in copper-doped samples is very much like a situation, which was observed in studies of magnetism of dilute magnetic semiconductors and oxides, when the absence of reproducibility at a low concentration of dopants is the principal unresolved problem [A Sunderesan, C. N. R. Rao Nano Today. 4 , 96 (2009)].
Table 3. Composition of the targets and the elemental composition of Al 2 O 3 -Al(Cu) NP as determined by the ICP method Target composition Element in PEB NP Cu Fe Cr Ni Si Al 2 O 3 pure* <. 02 0. 0607± 0. 0100 0. 0030± 0. 0100 <0. 00± 1 0, 3857± 0, 1000 Al 2 O 3 + 1 wt % Al 0. 0086± 0. 0008 0. 0387± 0. 0040 0. 0005± 0. 0001 0, 46± 0, 10 Al 2 O 3 +1 wt % Cu 1. 72± 0. 30 0. 1335± 0. 0300 0. 0018± 0. 0003 <0. 0001 0, 5080± 0, 1000 Al 2 O 3 + 3 wt % Cu 11. 19± 1. 10 0. 0509± 0. 0050 0. 0009± 0. 0001 0, 10± 0, 03 Al 2 O 3 + 5 wt % Cu 17. 22± 1. 70 0. 0628± 0. 0060 0. 0015± 0. 0002 0. 0 008± 0. 0001 0, 31± 0,
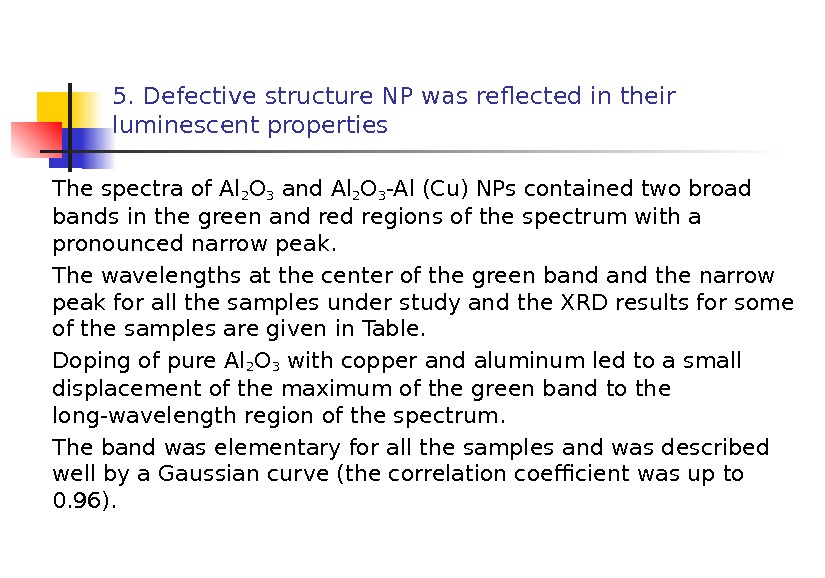
5. Defective structure NP was reflected in their luminescent properties The spectra of Al 2 O 3 and Al 2 O 3 -Al (Cu) NPs contained two broad bands in the green and regions of the spectrum with a pronounced narrow peak. The wavelengths at the center of the green band the narrow peak for all the samples under study and the XRD results for some of the samples are given in Table. Doping of pure Al 2 O 3 with copper and aluminum led to a small displacement of the maximum of the green band to the long-wavelength region of the spectrum. The band was elementary for all the samples and was described well by a Gaussian curve (the correlation coefficient was up to 0. 96).
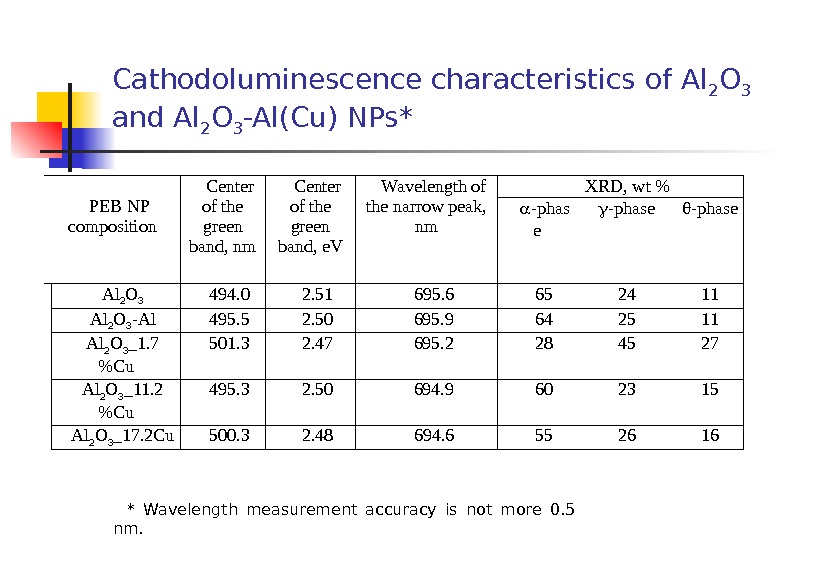
Cathodoluminescence characteristics of Al 2 O 3 and Al 2 O 3 -Al(Cu) NPs* * Wavelength measurement accuracy is not more 0. 5 nm. PEB NP composition Center of the green band, nm Center of the green band, e. V Wavelength of the narrow peak, nm XRD, wt % — phas e — phase Al 2 O 3 494. 0 2. 51 695. 6 65 24 11 Al 2 O 3 — Al 495. 5 2. 50 695. 9 64 25 11 Al 2 O 3 _1. 7 %Cu 501. 3 2. 47 695. 2 28 45 27 Al 2 O 3 _11. 2 %Cu 495. 3 2. 50 694. 9 60 23 15 Al 2 O 3 _17. 2 Cu 500. 3 2. 48 694.
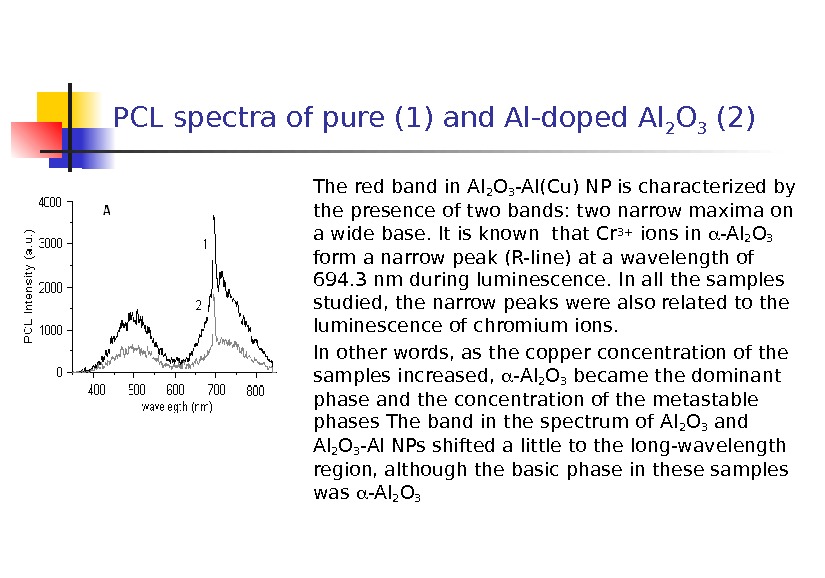
PCL spectra of pure (1) and Al-doped Al 2 O 3 (2) The red band in Al 2 O 3 -Al(Cu) NP is characterized by the presence of two bands: two narrow maxima on a wide base. It is known that Cr 3+ ions in -Al 2 O 3 form a narrow peak (R-line) at a wavelength of 694. 3 nm during luminescence. In all the samples studied, the narrow peaks were also related to the luminescence of chromium ions. In other words, as the copper concentration of the samples increased, -Al 2 O 3 became the dominant phase and the concentration of the metastable phases The band in the spectrum of Al 2 O 3 and Al 2 O 3 -Al NPs shifted a little to the long-wavelength region, although the basic phase in these samples was -Al 2 O
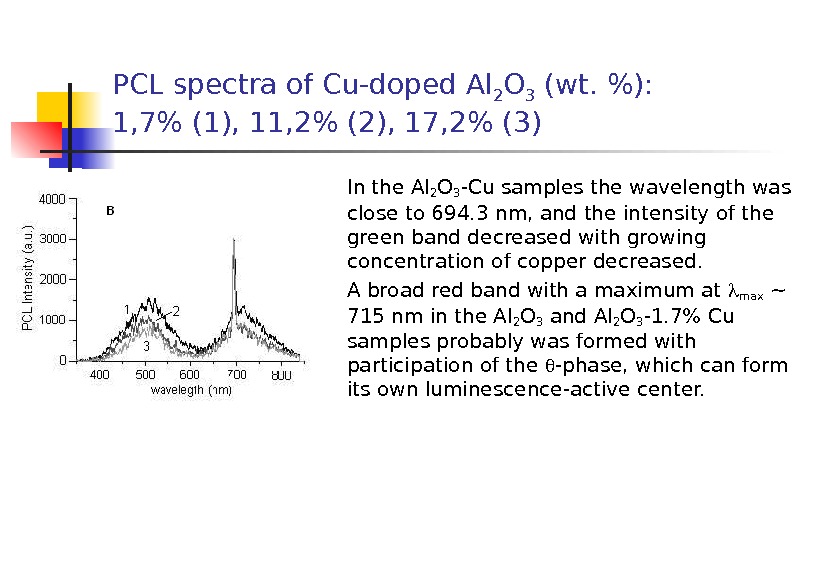
PCL spectra of Cu-doped Al 2 O 3 (wt. %): 1, 7% (1), 11, 2% (2), 17, 2% (3) In the Al 2 O 3 -Cu samples the wavelength was close to 694. 3 nm, and the intensity of the green band decreased with growing concentration of copper decreased. A broad red band with a maximum at max ~ 715 nm in the Al 2 O 3 and Al 2 O 3 -1. 7% Cu samples probably was formed with participation of the -phase, which can form its own luminescence-active center.
PCL spectra of Cu-doped Al 2 O 3 (wt. %): 1, 7% (1), 11, 2% (2), 17, 2% (3) In the Al 2 O 3 -Cu samples the wavelength was close to 694. 3 nm, and the intensity of the green band decreased with growing concentration of copper decreased. A broad red band with a maximum at max ~ 715 nm in the Al 2 O 3 and Al 2 O 3 -1. 7% Cu samples probably was formed with participation of the -phase, which can form its own luminescence-active center.
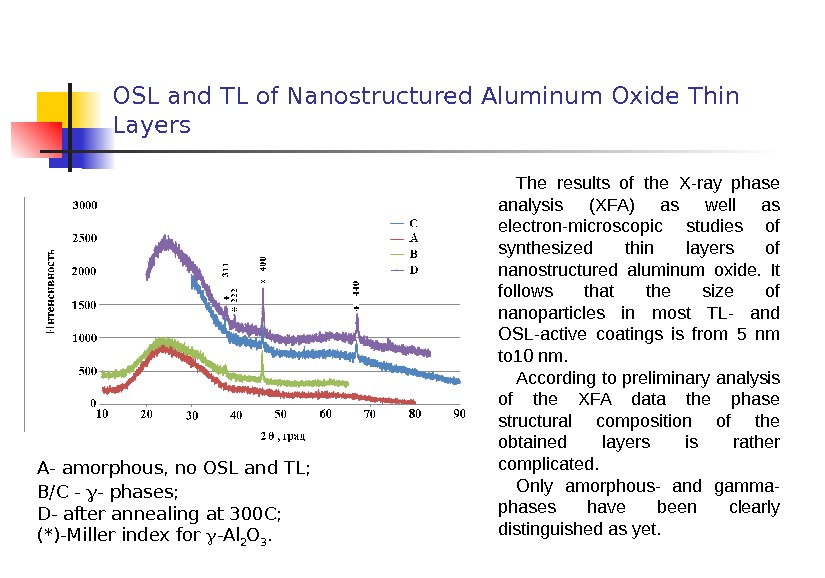
OSL and TL of Nanostructured Aluminum Oxide Thin Layers To define the absorbed doses of short range particles in mixed radiation fields needs sensible thin layer detectors. The layer thickness must be close to a free path of the given particles and in most practically important cases must not exceed 20 to 40 µm. It is shown that thin layers obtained by evaporation of a target using electron pulse beam (E=100 ke. V, =20 — 300 µs, j 1 MJ/cm 2 ), with subsequent sedimentation on cooled aluminum, copper, steel, quartz, and glass substrates demonstrate high TL- and OSL- yields. The TL- and OSL-yields of the given coatings with standard square and thickness are close to those for TL- and OSL – detectors based on anion-defective corundum (~ TLD-500).
OSL and TL of Nanostructured Aluminum Oxide Thin Layers The TL glow curve shows an unusually wide peak within the 300 -800 K range with its maximum at 450 К ( =2 K/s) and features at 370 and 670 K. At continuous blue LED stimulation ( max =470 nm) the OSL decay curve can be described by two exponents ( 1 12 s and 2 110 s) with considerable contribution from the slow component (I 1 1 /(I 2 2 ) 0. 5). Dose dependences of the TL- and OSL- yields are linear within the 20 -4 10 4 m. Gy range. Above all, the influence of the active layer thickness, substrate material, and the isochronous annealing temperature on the TL- and OSL- yields has been studied.
OSL and TL of Nanostructured Aluminum Oxide Thin Layers The results of the X-ray phase analysis (XFA) as well as electron-microscopic studies of synthesized thin layers of nanostructured aluminum oxide. It follows that the size of nanoparticles in most TL- and OSL-active coatings is from 5 nm to 10 nm. According to preliminary analysis of the XFA data the phase structural composition of the obtained layers is rather complicated. Only amorphous- and gamma- phases have been clearly distinguished as yet. A — amorphous, no OSL and TL; B/C — — phases; D — after annealing at 300 C ; (*)- Miller index for -Al 2 O 3.
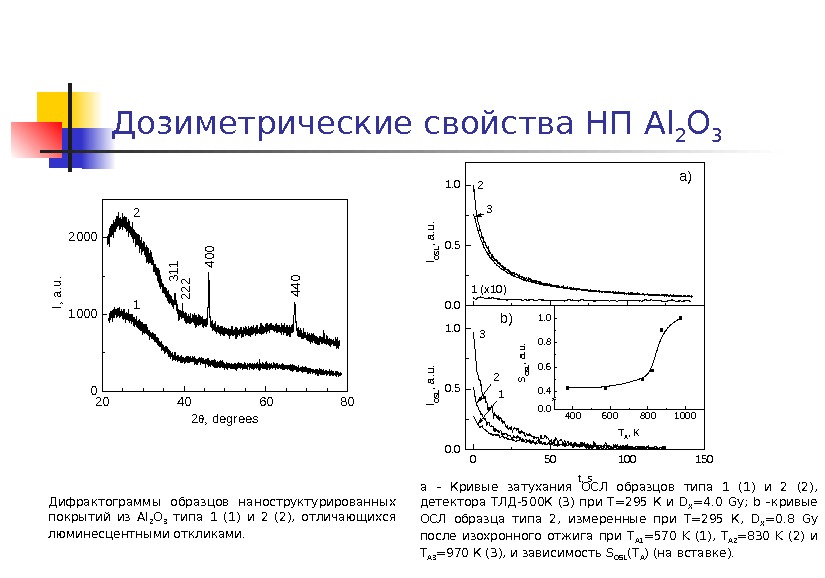
Дозиметрические свойства НП Al 2 O 3 Дифрактограммы образцов наноструктурированных покрытий из Al 2 O 3 типа 1 (1) и 2 (2), отличающихся люминесцентными откликами. a – Кривые затухания ОСЛ образцов типа 1 (1) и 2 (2), детектора ТЛД-500 К (3) при Т=295 К и D X =4. 0 Gy ; b –кривые ОСЛ образца типа 2, измеренные при Т=295 К, D X =0. 8 Gy после изохронного отжига при T A 1 =570 K (1), T A 2 =830 K (2) и T A 3 =970 К (3), и зависимость S OSL ( T A ) (на вставке). 0. 00. 51. 0 0 50 100 1500. 51. 040060080010000. 0 0. 4 0. 6 0. 8 1. 0 2 1 (x 10) a) IOSL, a. u. 3 b) IOSL, a. u. t, s 123 SOSL, a. u. T A, K 20406080 0 1000 2000 1 I, a. u. 2, degrees
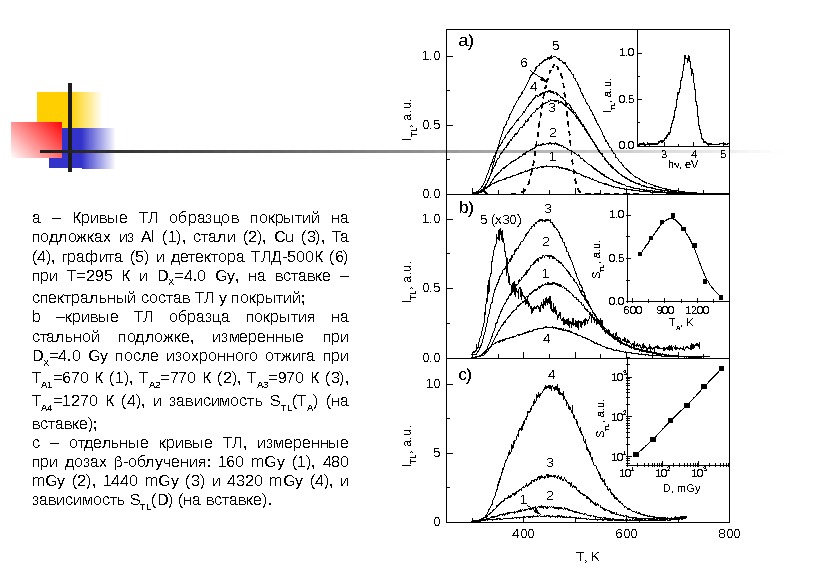
a – Кривые ТЛ образцов покрытий на подложках из Al (1), стали (2), Сu (3), Ta (4), графита (5) и детектора ТЛД-500 К (6) при Т=295 К и D X =4. 0 Gy , на вставке – спектральный состав ТЛ у покрытий; b –кривые ТЛ образца покрытия на стальной подложке, измеренные при D X =4. 0 Gy после изохронного отжига при T A 1 =670 К (1), T A 2 =770 К (2), T A 3 =970 К (3), T A 4 =1270 К (4), и зависимость S TL ( T A ) (на вставке); с – отдельные кривые ТЛ, измеренные при дозах -облучения: 160 m. Gy (1), 480 m. Gy (2), 1440 m. Gy (3) и 4320 m. Gy (4), и зависимость S TL ( D ) (на вставке). 0. 00. 51. 0 400 600 8000510 ITL, a. u. 5 4 3 2 16 a) ITL, a. u. 12 3 45 (x 30)b) ITL, a. u. 4 3 2 Т, K 1 c) 3 4 50. 00. 51. 0 ITL, a. u. h , e. V 600 900 12000. 51. 0 STL, a. u. T A , K 10 1 10 2 10 310 110 210 3 STL, a. u. D, m. Gy
Conclusions The conducted researches have shown that by means of PEB evaporation it is possible to produce nanopowder with a high specific surface and similar morphology into which structure necessarily enters amorphous a component. NP possesses high defective structure. Which together with complex phase structure NP influences on their magnetic, luminescent and etc. properties.
The authors wish to thank: Prof. for fruitfuc discussions, T. M. Demina, who measured the specific surface of the powders, Dr. N. I. Moskalenko, who performed the ICP analysis, A. V. Bagazeyev for the EEW powders, Prof. V. I. Solomonov for the e-beams luminescent analysis of the samples. Yu. A. Kotov