

3926e52c0e262fe0b0fa9b7c0428c544.ppt
- Количество слайдов: 42
 Remote Monitoring And Network Models: Their Potential For Protecting The Nation’s Water Supplies By Robert M. Clark Roy Haught Sri Panguluri
 Will Discuss n n n Concern over water system security in the US Basics of Network Modeling Application of water quality modeling in drinking water networks Example of real time monitoring in Wash DC Potential for future integration of remote monitoring and water quality
 9/11 Raised Concerns About Critical Infrastructure in the US n n In response, EPA created the Water Protection Task Force in October, 2001 Early in 2002 EPA’s ORD Initiated Home Land Security Research Plan HLSRP identified the vulnerability of drinking water distribution systems to security threats as a major concern Emphasized importance of environmental monitoring in maintaining water security
 Drinking Water Systems In The U. S. n n n There are 54, 000 community water systems in US serving 264 million people 79% of the population receives drinking water from large utilities (serving 10, 000 or more), representing 14% of the systems 21% of the population receives water from small utilities (serving less than 10, 000 people) representing 86% of the systems
 U. S. Water Supplies Have Common Characteristics Water source n A lake, reservoir, river or ground water from an aquifer Surface supplies generally have conventional treatment facilities and disinfection Ground water systems n May have full range of treatment technology but some practice chlorination only or do not disinfect at all Transmission systems n Tunnels; reservoirs and/or pumping facilities; and storage facilities Distribution system n Carrying finished water pipes to consumer
 Generally Agreed that Distribution System is Most Vulnerable Part of Water System +Community water supplies designed to deliver water under pressure and most of the system capacity is reserved for fire fighting purposes +Could damage or destroy a tank or reservoir +Potential for the deliberate introduction of contaminants into a distribution system (back flow, cross connections) +Need to be able to predict contaminant transport pathways and to measure concentration of contaminants in networks +Cyber attack could also provide a serious threat to an utilities operations. However many SCADA systems are not connected to the Internet
 Predicting Contaminant Movement In Drinking Water Distribution Systems n n Movement of water in distribution systems is complex The ability to predict movement is still relatively crude Need to be able to predict changes in concentration of contaminants Few attempts to integrate monitoring and modeling
 Contaminants May Be Conservative, or May Experience Decay or Growth As they Move Through Distribution Systems n n Changes may take place in the bulk phase or at the pipe wall Quality may be influenced by: u Cross Connections u Failures at the Treatment Barrier u Transformations in the bulk phase


 Hydraulic and Water Quality Models n n n Movement of contaminants a function of system hydraulics Hardy Cross proposed the use of mathematical models to analyze the flow in networks (1936) Computer based hydraulic models developed in 1950 s and 1960 s Pipe optimization modules included in many hydraulic models Steady and Dynamic or Extended Period Simulation Models
 Water Quality Models Developed to Ride on Hydraulic Models n n Steady-state models developed in 1980 s Dynamic models developed in 1990 s
 Transport / Water Quality Equation ¶ Ci Qi ¶ Ci = + qi (Ci ) i = 1. . n ¶ t Ai ¶ x where Ci = concentration in pipe i Q 1 = flow rate in pipe i Ai = cross - sec tional area of pipe q (Ci ) = reaction term
 Model Interaction Water quality models are generally piggy backed on hydraulic models. Hydraulic Model Flows and velocities Water Quality Model Water quality results
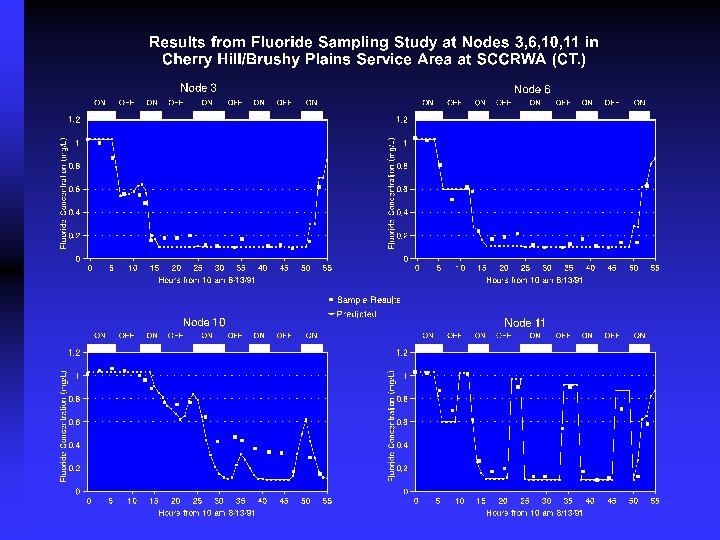
 Application of Water Quality Models n n n First application in US was at the North Penn Water Authority in mid 1980 s Scaled up and applied in South Central Connecticut Water Authority in 1990 s Applied to water borne outbreak in Cabool Missouri in 1990
 Evolution of Water Quality Modeling n n n Development of EPANET u Integrated water quality and hydraulics Has been widely adopted as an industry standard Many current models feature sophisticated water quality/hydraulic models
 Modeling of Contaminants n n n First field study using EPANET in North Marin California Modeled chlorine residual propagation and THM formation Applied to two water source system
 EPANET Applied to Waterborne Outbreak in Gideon Missouri in 1993 n n Salmonella contamination occurred in municipal tank due to failure of hatches and vents Taste and odor complaints caused water officials to start flushing program Out of population of approximately 1000 people, 440 became ill and 7 people died Used model to track outbreak and identify source
 Historical development of water distribution system modeling Experts Conference EPA/AWWARF 1930's Hardy cross network flow analysis 1960's Computer analysis of networks 1970's Widely available hydraulic models for minis and micros 1980's 1990's Dynamic water quality modeling Steady state water quality models Expanded dynamic water quality modeling Integrated modeling & mapping systems; monitoring strategies; contaminant kinetics
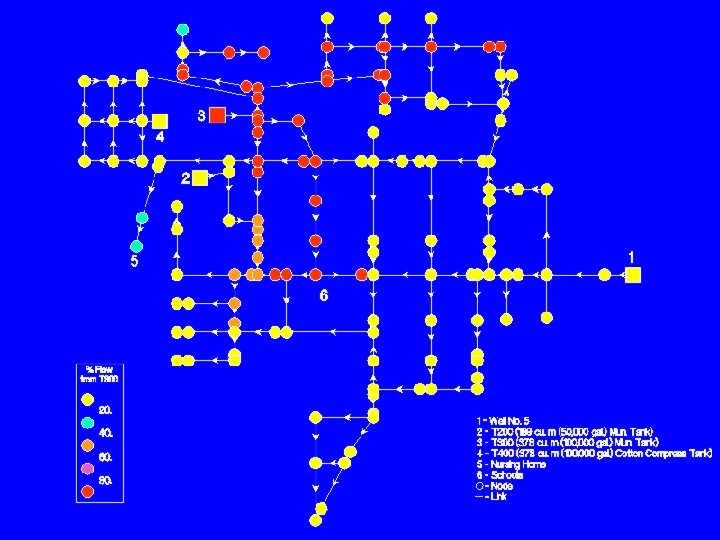
 Link-Node Representation of the Cherry Hill/Brushy Plains Network
 Current Status of Water Quality/Hydraulic Models n n Increasingly sophisticated Applied to exposure studies u ATSDR study on contaminated ground water Much research into modeling changes in water quality u Formation of DBPs and Chlorine Residuals Tank Mixing Models
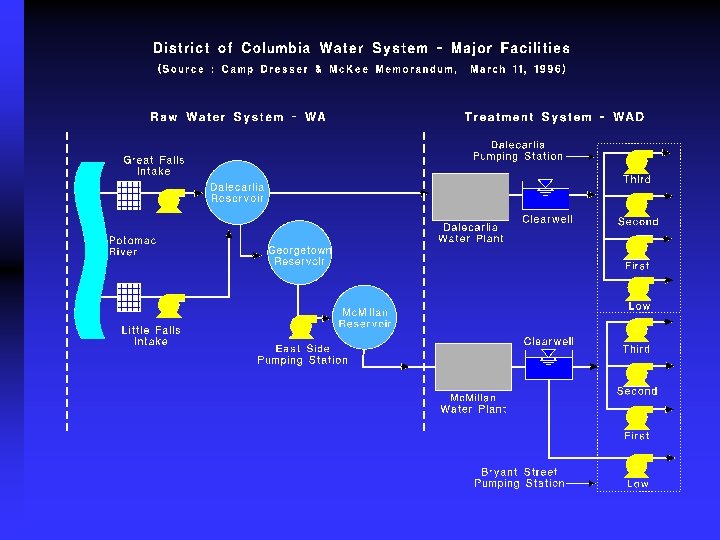
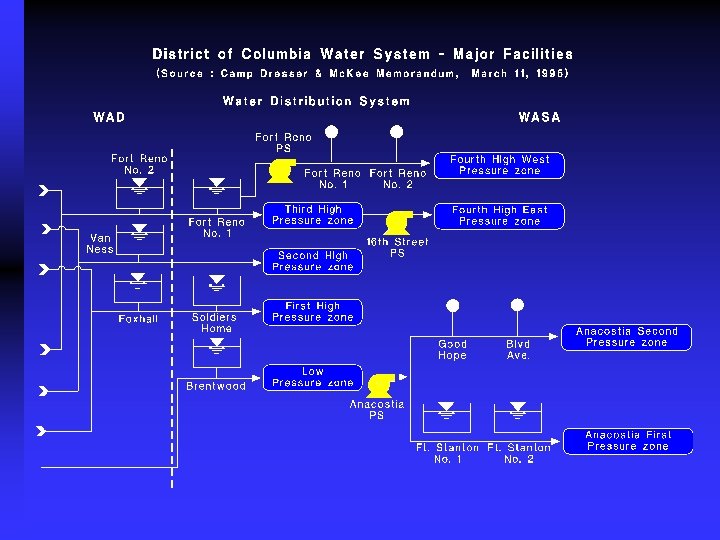
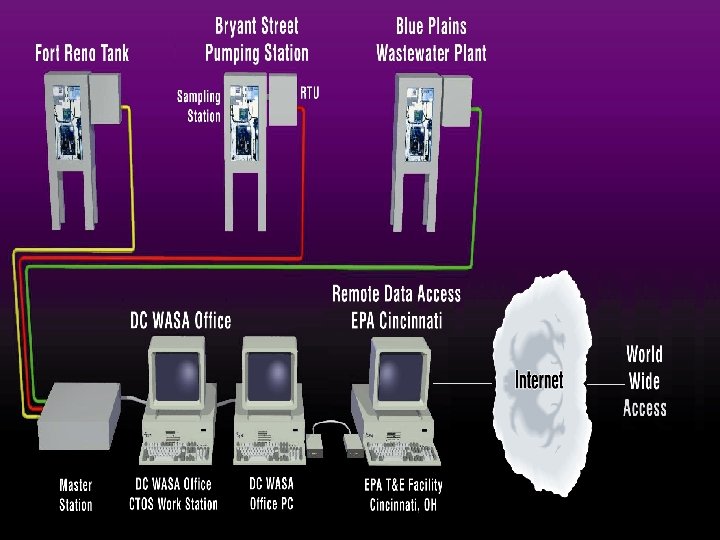
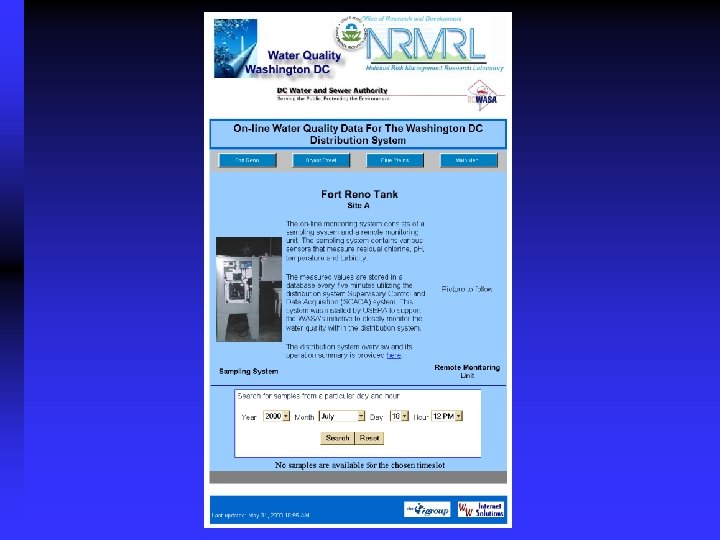
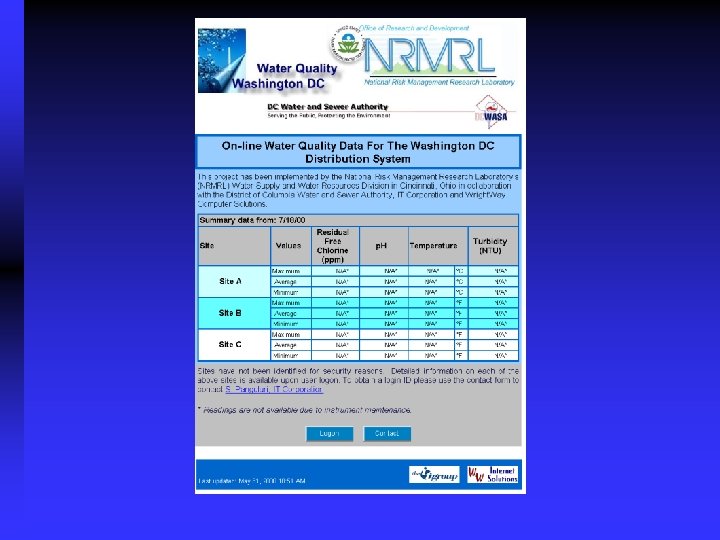
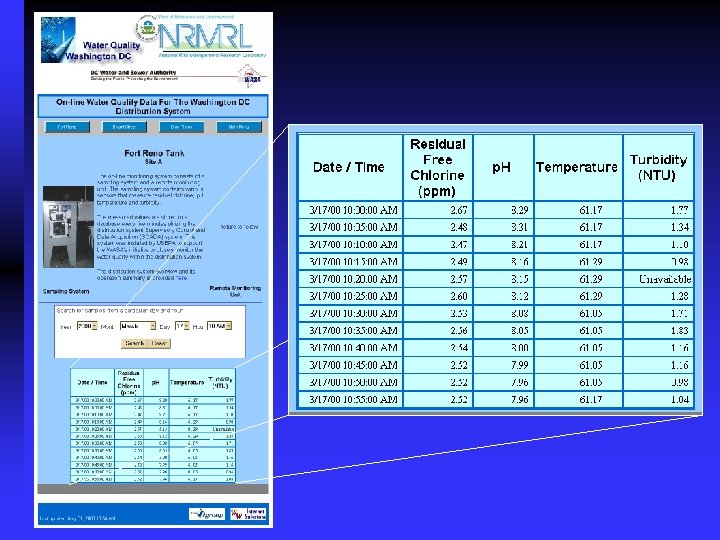
 EPA Research in Real Time Monitoring Systems n n First EPA effort was development of sensors for temperature, chlorine residual, fluoride and nitrate data with Battelle Asked to assist during MCL violation in Washington DC Initiated research on development of sensors and probes for chlorine residual, p. H and temperature using pipe loops Applied to DC water system
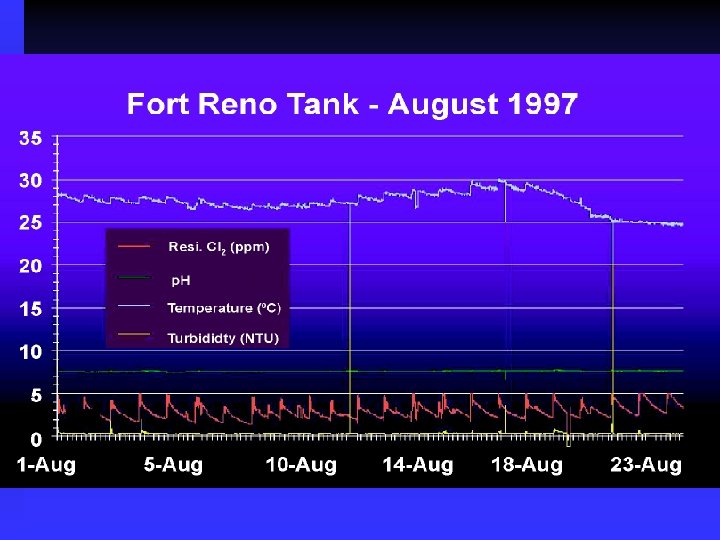
 Remote Telemetry Monitoring Parameters n T&E Facility Control Ø Flow & chemicals u Monitor Ø Flow, Temp. , Chlorine, Turbidity, ORP, p. H, Ø DO, corrosion, n Washington D. C u Monitor Ø Chlorine, Turbidity, p. H, Temp. u
 T&E Pipe Loops – DSS 1
 DSS-1 Sensor Controls Area
 Telemetry Control Loop 5
 Loop Data Page
 Washington D. C. Fort Reno Tank n Bryant Street Pumping Station n Blue Plains Wastewater Plant n
 Factors Impacting Remote Monitoring Systems Human/Management Factors ¢ Lack of calibration records ¢ Frequent changes in support personnel (commitment) ¢ Inadequate understanding of equipment and instrumentation ¢ Accidents that might affect the operation of the equipment ¢ Unexpected changes in system operation (flushing operations)
 Factors Affecting Remote Monitoring Systems Instrument and Mechanical Problems ¢ Data collection rate and instrument response rate should match ¢ Network bandwidth ¢ Location of instruments ¢ Security procedures (system and physical) ¢ Reliability of instruments and software ¢ Adequate spare parts ¢ Ability to accommodate transient signals ¢ Interpretation of data and alarm conditions ¢ Systems should be implemented in phases
 Monitoring Technology: Current and Future Traditional Online Instrumentation § Residual Chlorine, Temperature, Turbidity, p. H, ORP, DO, etc. ¢ Advanced Instrumentation § Bio-Sentinels, Gene Probes, Polymerase Chain Reaction (PCR), Solid-State Biochip, Fingerprint Analyses, Immuno-Magnetic, Immuno- Fluorescence, etc. ¢
 Summary and Conclusions n n Water systems have been classified as critical infrastructure Identified as potentially vulnerable Contaminant Propagation Can be Modeled and there are various models available EPANET is a public sector model that has become industry standard
 Summary and Conclusions n n EPA has been conducting research into sensor development Applied to operation of small package plants Extended to chlorine residual monitoring in Washington DC system Future research will focus on integrating remote sensing and water quality modeling