

ba816346912a322b01b2d86643a041e4.ppt
- Количество слайдов: 35
 “Recruiting International Students with an Eye Towards the Future” Washington International Education Conference Daniel Gaines, Senior International Trade Specialist, Northern Virginia U. S. Commercial Service, U. S. Department of Commerce January 26, 2016
 What we’ll cover… 1. Why Education is a Priority for the USG 2. Commercial Service Overview Who we are and how to leverage us 3. Markets to Consider
 Why Education is a priority for the U. S. Government
 Sector Overview • The U. S. is one of the largest destinations for international students seeking higher education. • Education/training brought in over $27 B USD in annual revenues to the U. S in 2014. • According to the Institute of International Education, that dollar figure is expected to continue rising. • Our renowned colleges/universities not only enjoy a diverse and global population, but these students have a substantial impact on the U. S. economy. These recruitment efforts translate into job growth here in the U. S.
 Sector Overview Economic Impact in 2013/2014 Academic Year: • New international student enrollment – students enrolling for the 1 st time at a U. S. institution – increased 7. 5% • Record high 886, 052 students in U. S. in 2013/2014, more than a 40% increase in the last decade • Large increase in students from Brazil and Saudi Arabia • Top state destinations: California, New York, Texas • Top places of origin: China, India, S. Korea, Saudi Arabia, and Canada (comprises over 50% of all international students) • Benefits to retail, travel industry, and many other service providers Source: Institute of International Education
 Who we are and how we can be leveraged
 What is the U. S. Commercial Service? Network: 140 offices in 70 countries U. S. Commercial Service ~ most in embassies and consulates ~ Education Specialists 100 locations across U. S. Domestic Field Offices International Field Offices ~ cover each U. S. state Mission: • Promote the exports of U. S. goods and services • Work with federal agencies, associations, consortia, partners Primary Education Industry Clients: Intensive English Programs, private high schools and boarding schools, academies, community colleges, 4 -year colleges and universities, graduate programs
 and Commercial Specialists (overseas) with sector expertise work") DOC Services International Trade Specialists (domestic) and Commercial Specialists (overseas) with sector expertise work closely with U. S. based education clients to assist/offer the following programs and services: – – – – – Market Research Reports Webinars Gold Key Matching Service Catalogue Road show Virtual Education Fair Single or Multi-School (Consortia) Promotion Visiting Education Delegations U. S. Government Education Missions Support Domestic and International Education Fairs Study Consortia and Websites
DOC Services International Trade Specialists (domestic) and Commercial Specialists (overseas) with sector expertise work closely with U. S. based education clients to assist/offer the following programs and services: – – – – – Market Research Reports Webinars Gold Key Matching Service Catalogue Road show Virtual Education Fair Single or Multi-School (Consortia) Promotion Visiting Education Delegations U. S. Government Education Missions Support Domestic and International Education Fairs Study Consortia and Websites
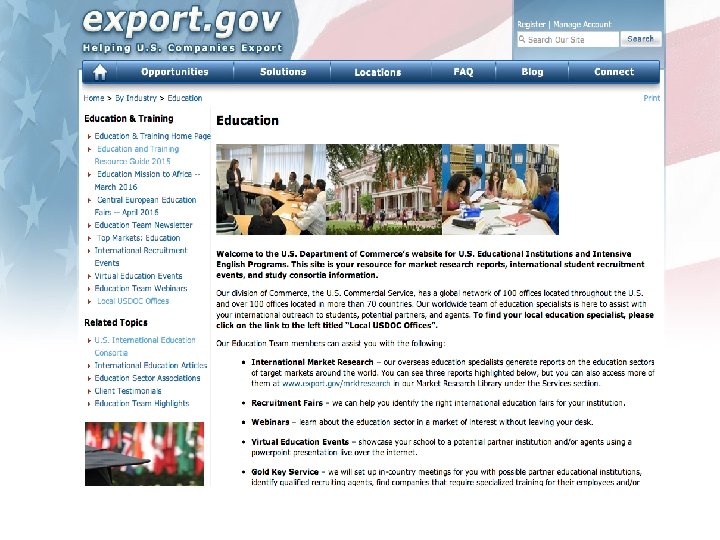
 Newsletter,") Client Needs • Market Intelligence: • Education Industry Information (www. export. gov/industry/education/index. asp) Newsletter, Best Export Markets Report, Country Specific Market Research Reports, Webinars, Virtual Education and Recruitment Events, Trade Leads–sign up for email updates! • Making Contacts: • Customized Contact Lists • Prescreened Face to Face Meetings w/ Potential Partners • Single/Multi Organization Promotion • Industry Trade Missions – Outbound and Inbound • Virtual Education Fairs • Meeting Students: • Organized Trade Missions • Fairs (Education. USA, IIE, ISN, Linden, Consortia, etc. )
Client Needs • Market Intelligence: • Education Industry Information (www. export. gov/industry/education/index. asp) Newsletter, Best Export Markets Report, Country Specific Market Research Reports, Webinars, Virtual Education and Recruitment Events, Trade Leads–sign up for email updates! • Making Contacts: • Customized Contact Lists • Prescreened Face to Face Meetings w/ Potential Partners • Single/Multi Organization Promotion • Industry Trade Missions – Outbound and Inbound • Virtual Education Fairs • Meeting Students: • Organized Trade Missions • Fairs (Education. USA, IIE, ISN, Linden, Consortia, etc. )
 Client Needs Previous Webinars • Student Recruitment on a Shoestring • Social Media For Higher Education International Recruitment • International Student Recruitment in Saudi Arabia • International Student Recruitment in Israel and West Bank • International Student Recruitment in Portugal and Spain • Opportunities in Brazil – English Language Products and Services • Kazakhstan Higher Education Market
 Client Needs Making Contacts: Customized Contact List – based on specific criteria, per country/region/city, typically not screened, e. g. list of private high schools, academic institutions, agents, etc. or distributors/representatives for products International Partner Search – based on specific criteria, per country/region (e. g. India), all contacts vetted for interest in possible partnership, overseas post evaluation given - $550 per report, 4 -6 weeks delivery
 Client Needs Making Contacts: Gold Key Matchmaking Service – based on specific criteria, per country/city, candidates vetted for interest, follow up in country meetings prearranged, escorted by Embassy/Consulate Commercial Specialist, logistics provided at additional cost $700 per day of meetings, $350 any additional days, 6 -8 weeks notice Single School (or Multi School/Consortia) or Company Promotion – customized with event or seminar with reception to prospective candidates (often coordinated with alumni for schools), cost varies
 U. S. Commercial Service Partners Virtual Education Fairs • 35+ virtual education fairs held • Offered to individual schools or consortia 1 st School Presenter (10 min. ) 2 nd School Presenter (10 min. ) 3 rd School Presenter (10 min. ) projector/screen CS Indonesia WEBEX Distribute to Partners in Advance: School DVDs/Profiles/Other Materials U. S. Clients - Community Colleges, Intensive English Programs, 4 -year Colleges and Universities, Private High Schools CS Moderator 4 th School Presenter (10 min. ) 5 th School Presenter (10 min. )
 Virtual Education Fair at the U. S. Embassy in Chile
 Previous Virtual Education Fairs Previous VEFs this year: Who Participated? : EU (France, Germany, Spain, ESL Programs, Short Term Programs Portugal, Italy, the Netherlands, Belgium, Denmark) Indonesia Hospitality & Culinary Programs Brazil ESL Programs, Traditional Undergrad & Grad School ESL Programs, Undergrad, Short Term Programs w/ Certificate Design (Art, Fashion, etc. ) Schools Kazakhstan India
 Websites, Resource Links U. S. Commercial Service – www. export. gov – market research, trade events, etc. Institute of International Education – www. iie. org – research, publications, etc. American Association of College Registrars and Admissions Officers (AACRAO) www. aacrao. org American Association of Community Colleges (AACC) http: //www. aacc. nche. edu American Association of Intensive English Programs (AAIEP) www. aaiep. org The Association of Boarding Schools (TABS) www. tabs. org NAFSA: Association of International Educators (NAFSA) www. nafsa. org National Association for College Admission Counseling (NACAC) www. nacacnet. org National Association of Graduate Admissions Professionals (NAGAP) www. nagap. org
 I&A Top Markets Series U. S. Department of Commerce International Trade Administration Top Markets Report Rankings and Key Findings Education Sector Specialist John Siegmund john. siegmund@trade. gov 202. 482. 4781 http: //trade. gov/topmarkets/pdf/Education_Top_Markets_Report. pdf International Trade Administration – Industry & Analysis (I&A)
 U. S. Department of Commerce I&A Top Markets Series International Trade Administration Education - Rankings and Key Findings Top 25 Export Markets (2015 -2016) 1. China 2. India 3. South Korea 4. Saudi Arabia 5. Canada 6. Taiwan 7. Japan 8. Vietnam 9. Mexico 10. Brazil 11. Turkey 12. Iran 13. United Kingdom 14. Germany 15. France 16. Nepal 17. Hong Kong 18. Nigeria 19. Indonesia 20. Thailand 21. Kuwait 22. Colombia 23 Venezuela 24. Malaysia 25. Spain Sector Lead: John Siegmund & Barb Rawdon (202 -482 -4781; 202 -481 -0474) Key Markets: • Brazil, China, France and Germany, India, South Korea, Saudi Arabia, Vietnam Major Trends: • U. S. higher education exports in 2013 were $27 billion. In 2013/14, over 886, 000 international students came to the United States. Both figures are the highest ever. Global competition is increasing, especially among English-speaking countries; immense growth in the number of Chinese students. U. S. has shrinking piece of growing pie. Recommendations: • Schools looking for immediate increases in foreign enrollment should consider China, India, Saudi Arabia and South Korea. The report has significant detail on why students choose to study abroad and what fields they are studying – by country. Challenges: • U. S. schools face growing competition for international students, especially due to growth of English-language courses from non. English speaking countries. High U. S. tuition and perceptions abroad of problems getting U. S. student visas. International Trade Administration – Industry & Analysis (I&A)
 Recruiting Students from Sub Saharan Africa
 Why Africa? • Africa as a whole is one of the “youngest continents, ” with ‘outwardly mobile’ students comprising 25% of all students on the African continent- the highest rate in the world- and globally. • The continent has a growing middle class, and presently spends up to $900 million on education annually.
 South African Education Statistics • Public Schooling System • Private Schooling System • 550, 127 students completed high school • 150, 752 qualified for admission to Bachelor studies • 280, 547 qualified for admission to higher certificate, diplomas and vocational courses • 10, 452 students completed high school • 8, 884 qualified for admission to Bachelor studies • 1, 255 qualified for admission to higher certificate, diplomas and vocational courses
 Important Factors to Consider • Timeframe - Student applications for the next academic year needs to be completed by May. Academic calendar in SA runs from Jan - Nov • SAT and ACT assessments are offered 5 times a year in South Africa • TOEFL assessments are offered 3 times a month • Graduate Admission: the GRE (Graduate Records Exam) and the GMAT (Graduate Management Admissions Test) are offered multiple times a month • GPA: to calculate a South African students GPA, use the letter symbol for the percentage or number (1 -7) mark earned here. US GPA values are as follows: A=4. 0; B=3. 0; C=2. 0; D=1. 0; F=0.
 Current South African Students in US • Total number of SA students currently studying in the U. S. 1, 716 • Top 5 States: Massachusetts, New York, California, Pennsylvania and Texas SOUTH AFRICAN STUDENTS BY ACADEMIC LEVEL Type of Program % Number 1 -yr Change Undergraduate 54. 1% 882 +7. 8% Graduate 30. 2% 548 +4. 9% Non-Degree 8. 1% 148 +56. 8% Optional Practical Training 7. 6% 138 +13%
 Current South African Students in US • Undergraduate programs account for 54% of total students • 82% study in 4 year programs • 18% study in 2 year Community College programs and then look to articulate into a mainstream institution. • Most popular courses : Engineering, Business, IT, Post graduate management courses
 Barriers to Entry • English. This is not the primary medium of instruction in the majority or schools. Students have a limited understanding and this makes studying in English more difficult • Tuition Fees. The weakening of the local currency makes studying in the U. S. very expensive. The average tuition fee for an undergraduate program is more than the yearly income from a local household
 How do we help address barriers? • Target audience - The students that the U. S. institutes meet come from private and semi private schools. These schools have English as their medium of instruction and command a high tuition fee. This mitigates against language and funding barriers. • Provides alternatives avenues to study in the U. S. – Community Colleges and Scholarships
 Our Support • Help schools gain market exposure and introduce them to African markets • Help schools access business prospects by establishing valuable contacts • Help schools develop market knowledge leading to student recruitment and potential partnerships.
 Our Support continued… • One on one meetings with interested, relevant students • Roundtable discussions with local authorities to encourage cooperation • One on one meetings with education stakeholders and local institutes about creating strategic mutually beneficial partnerships. • Education mission taking place in March; registration is closed, but be on the lookout for a follow up mission!
 Recruiting Students from Central America 100, 000 Strong in the Americas by 2020
 Why Central America? As a whole, students coming from Latin America to study in the US increased by 19. 4% in 2014/15 to 86, 378 students About 9% come from Central America - 7, 754 (15% increase 2014/15) Belize – 312 Costa Rica – 1, 118 El Salvador – 1, 460 Guatemala – 1, 252 Honduras – 1, 756 Nicaragua – 418 Panama – 1, 438
 Current Demand Central American students are primarily attracted to these types of U. S. programs: • U. S. universities and community colleges with tuition fees lower than USD 20, 000 • English Language Programs (from one month up to one year) for students, teachers, and adults • Summer camps • Undergraduate, Graduate and Master Programs • Online programs
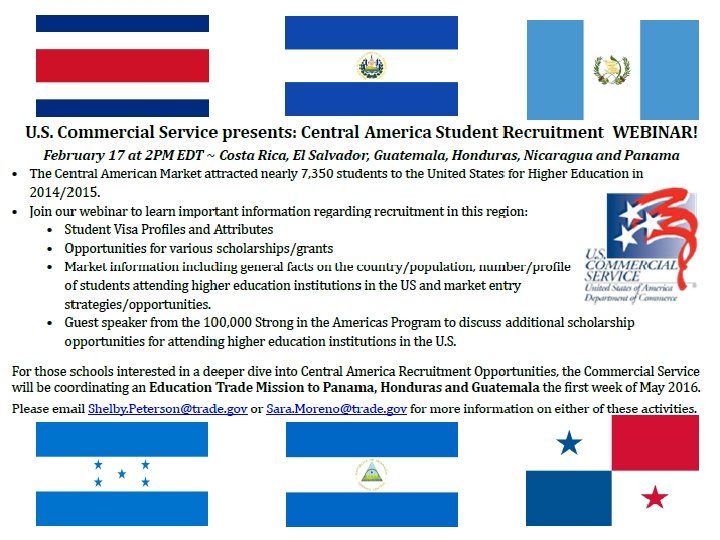
 U. S. Commercial Service Education Mission to Central America – May 2 -5, 2016 Panama, Honduras, and Guatemala (Optional stop) Cities: Panama City, San Pedro Sula, and Guatemala City (optional) Since 2006, the number of students attending higher-education institutions in the United States from these 3 countries has increased 15%. Who should join this mission? • • Intensive English Language Programs Community Colleges Summer Programs Undergraduate and Graduate Degree Programs Registration Deadline: March 1, 2016 For more information, please contact: Sara Moreno, Lexington USEAC, (859) 225 -7001, sara. moreno@trade. gov Shelby Peterson, Salt Lake City UESAC, (801) 255 -1872, shelby. peterson@trade. gov
 U. S. Commercial Service Thank you! Daniel Gaines daniel. gaines@trade. gov 703. 217. 2467 www. export. gov/industry/education