

8c8529d71d2e1689a1cf4690d921b2f0.ppt
- Количество слайдов: 39
 RECIPE Charquemont Progress meeting 23 - 26/10/2003 UK progress Rebekka Artz Stephen Chapman Colin Campbell Craigiebuckler, Aberdeen, AB 15 8 QH, UK
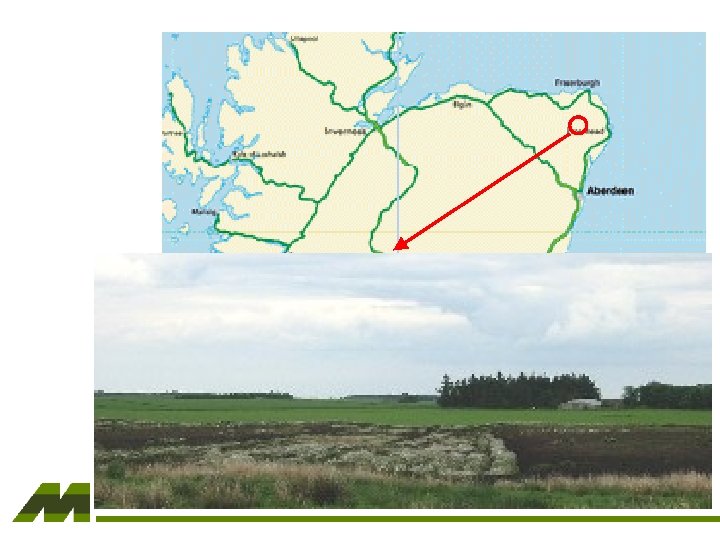
 I. WP 01 UK Field site • Middlemuir Moss, between Strichen and New Pitsligo, NE Scotland
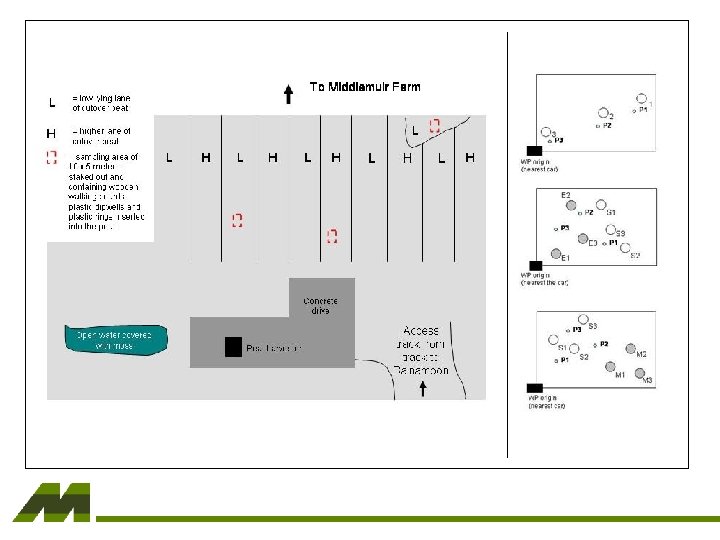
") Bare milled peat (0 -5 yrs)
Bare milled peat (0 -5 yrs)
") 1 st succession peat (> 5 yrs)
1 st succession peat (> 5 yrs)
") Regenerating peat (> 50 yrs)
Regenerating peat (> 50 yrs)
 > 50 yrs 5 -10 yrs Bare
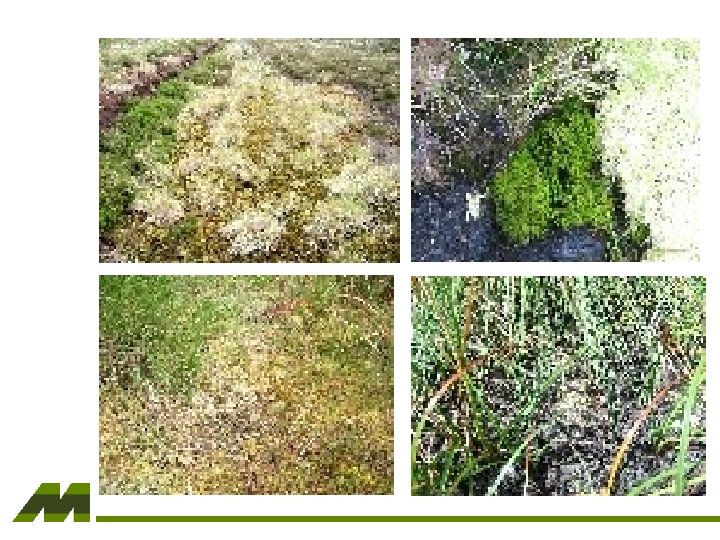
 Table 1. Approximate species distribution at RECIPE WP 01 field sites Experimental. Site / Keystone species Bare surface Key: EV – Eriophorum vaginatum, EA – Eriophorum angustifolium, SF – Sphagnum fallax, SM – Sphagnum magellanicum, SC – Sphagnum capillifolium, SCU – Sphagnum cuspidatum, CI – Campylopus introflexus, PC – Polytrichum commune, HS – Hypnum sp. (jutlandicum or cypressiforme), PS – Pleurozium schreberi, CS – Calluna sp. , O – others (grasses etc. ) milled Plant distribution (%) Collar 1 Collar 2 Collar 3 bare 1 st Succession Peat / Eriophorum EA (80) SF (15) EV (<5) CI (<1) EA (80) SF (15) EV (5) EA (70) SF (20) EV (5) CS (3) CI (2) 1 st Succession Peat / Sphagnum SF (100) SF (95) EA (5) Regenerating Peat / Polytrichum PC (80) SC (10) HS (3) PS (3) CS (4) PC (75) SM (5) SC (10) SCU (5) CS (5) PC (95) SM (<1) SC (<4) O Regenerating Peat / Sphagnum SC (80) SCU (15) SM (5) SC (60) SCU (15) SM (5) HS (10) PS (5) CS (<5) O SC (70) SCU (15) SM (5) PS (5) CS (<5) O
 II. Field site preliminary data
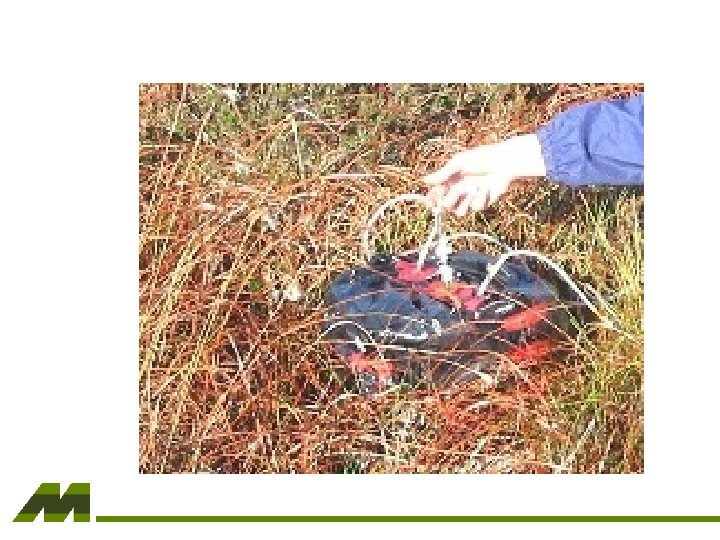
 Water table in plots
 Field measurements of CO 2 and CH 4 fluxes Methane added
 Bare peat – CO 2 - 90 cm - 41 cm
 Bare peat – CH 4 - 90 cm - 41 cm
 1 st succession peat – CO 2 - 22 cm - 7 cm
 1 st succession peat – CH 4 - 22 cm - 7 cm
 Regenerating peat – CO 2 - 38 cm
 Regenerating peat – CH 4 - 38 cm
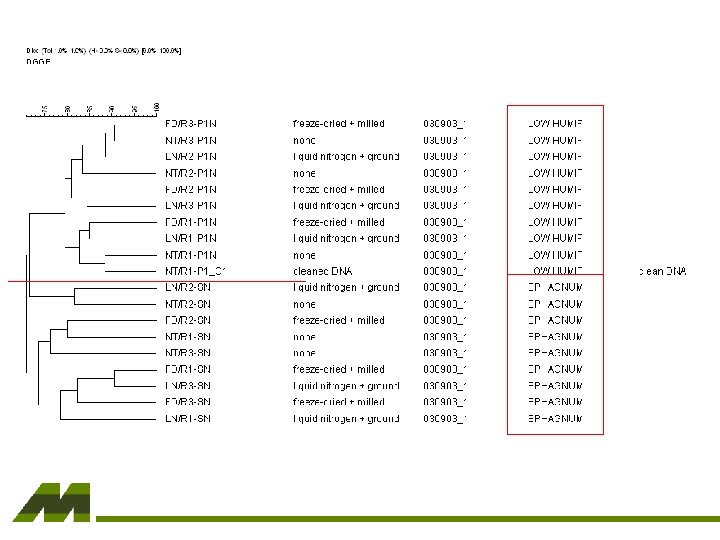
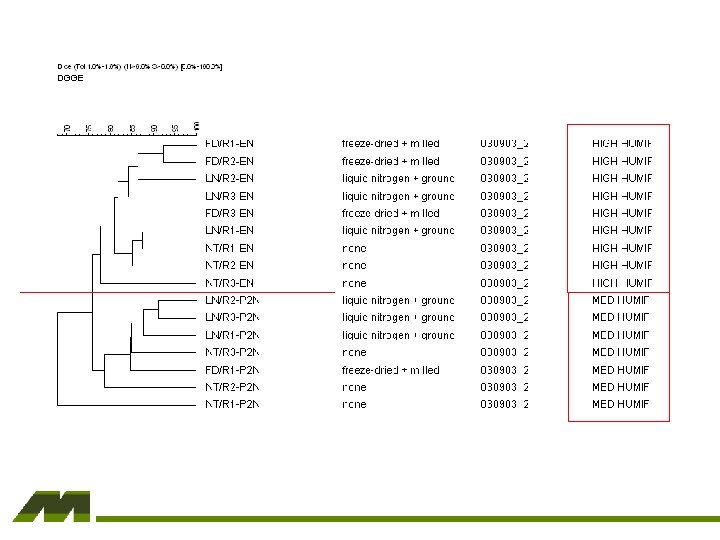
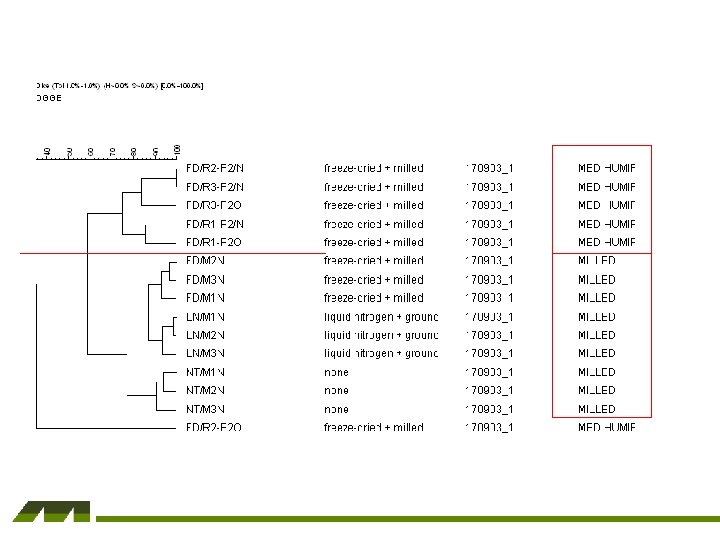
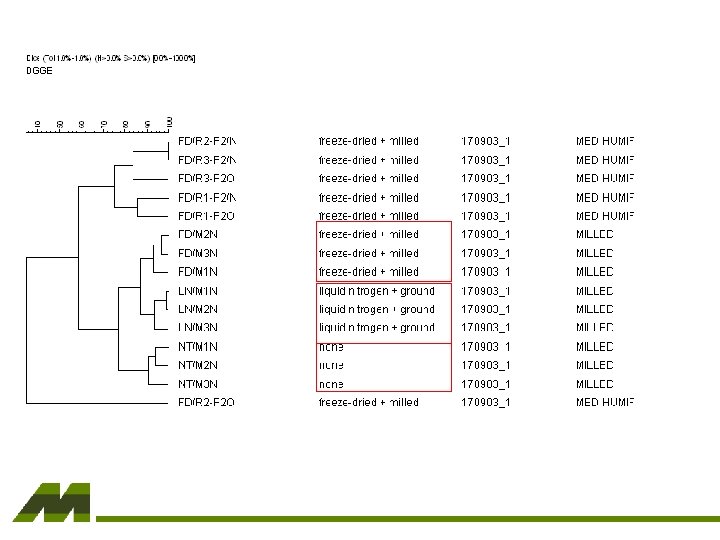
 III. Fungal community structure analysis by DGGE of ribosomal 18 S and/or ITS sequences Preliminary data
 Test DNA extractions for shipping methods * *p < 0. 05
 Sphagnum M + NT/S LN/S FD/S Low humification NT/P 1 LN/P 1 FD/P 1
 Medium humification + M NT/P 2 LN/P 2 FD/P 2 High humification NT/E LN/E FD/E + M
 PCR FD/P 2 M + P 2 old P 2 new Milled surface NT/M LN/M FD/M + + M
 Regenerating S M + E NT FD LN
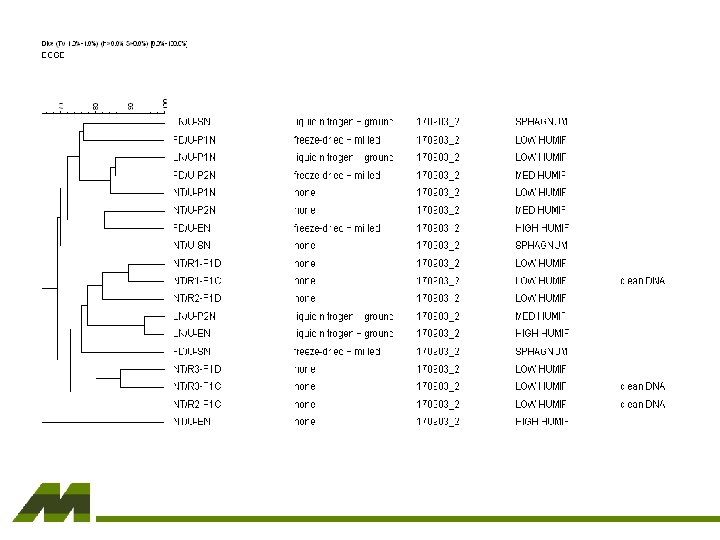
 Fungal DGGE analysis shows significant differences in band patterns according to peat depth but: GELS CANNOT BE INTERCOMPARED (YET)
 IV. Community level physiological profiling by Micro. Resp Preliminary data
 • ‘Standard’ method utilises sieved soil of ca. 40% WHC problematic with peat due to irreversible drying and fibrosity • Protocol adapted to use slurry (peat blended with water 1: 10) • tested with glucose (150 and 75 m. M)
 150 m. M glucose, 2. 5 m. M bicarb only the surface sample at Regenerating peat site gives significantly higher SIR than a water blank (not sterile). No distinction possible between samples so far.
 75 m. M glucose, varying bicarb
 All 4 peat depths at Regenerating site, 0 -5 cm horizon at 1 st succession site, and all except the 0 -5 cm horizon at the bare site show significantly higher CO 2 evolution than the (water only) control. Different samples show different CO 2 curves.
 Lowering the buffering capacity of the detection system allows for sample distinction. Further work: incorporation of different carbon sources to allow for CLPP using 32 carbon sources per plate (n = 3) or 16 carbon sources (n = 6). Anoxic system?
 V. RECIPE WEBSITE Preliminary version available at http: //www. macaulay. ac. uk/recipe Will go public soon …