
Real Estate Market Analysis Basic Principles, an Overview


02-overview_and_levels.ppt
- Размер: 261.5 Кб
- Количество слайдов: 39
Описание презентации Real Estate Market Analysis Basic Principles, an Overview по слайдам
Real Estate Market Analysis Basic Principles, an Overview of the Process and Levels of Study Wayne Foss, DBA, MAI, CRE, FRICS Fullerton, CA USA Email: waynefoss@usa. net
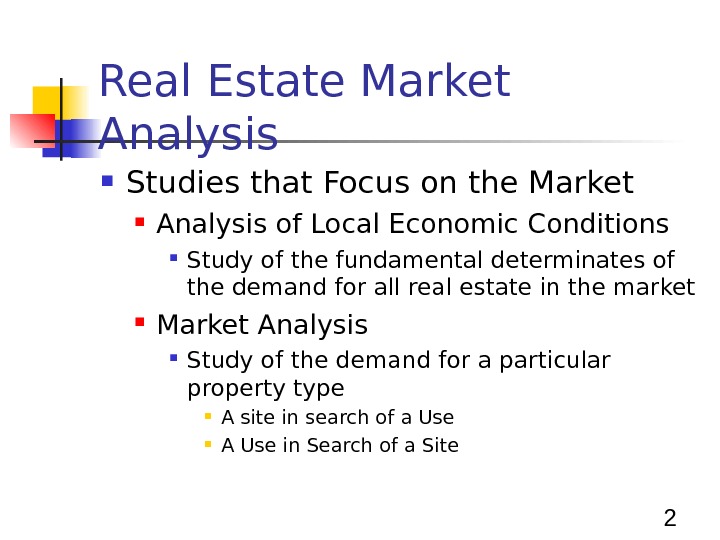
2 Real Estate Market Analysis Studies that Focus on the Market Analysis of Local Economic Conditions Study of the fundamental determinates of the demand for all real estate in the market Market Analysis Study of the demand for a particular property type A site in search of a Use A Use in Search of a Site
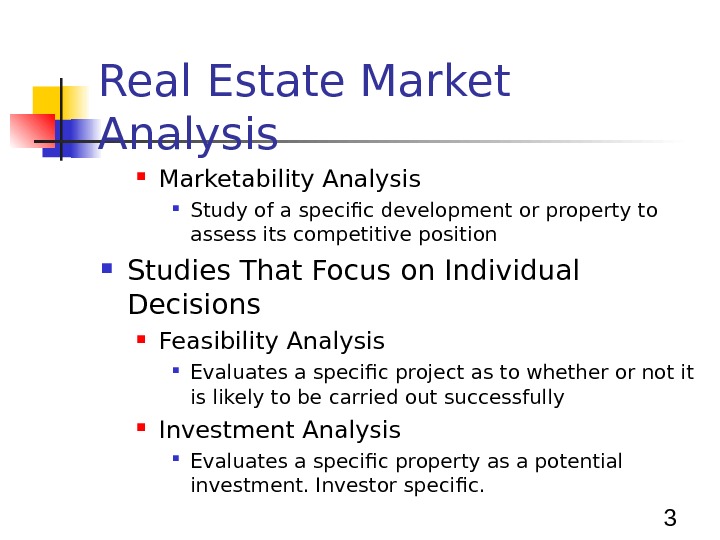
3 Real Estate Market Analysis Marketability Analysis Study of a specific development or property to assess its competitive position Studies That Focus on Individual Decisions Feasibility Analysis Evaluates a specific project as to whether or not it is likely to be carried out successfully Investment Analysis Evaluates a specific property as a potential investment. Investor specific.
4 Overview of Market Analysis Components Two Major Study (Question) Types 1. A Site in Search of a Use 2. A Use in Search of a Site
5 Overview of Market Analysis Components The Study Process 1. What attributes does the subject property offer to the market? 2. Who are the potential, typical users/most likely purchasers of the subject? Most Probable Buyer Analysis
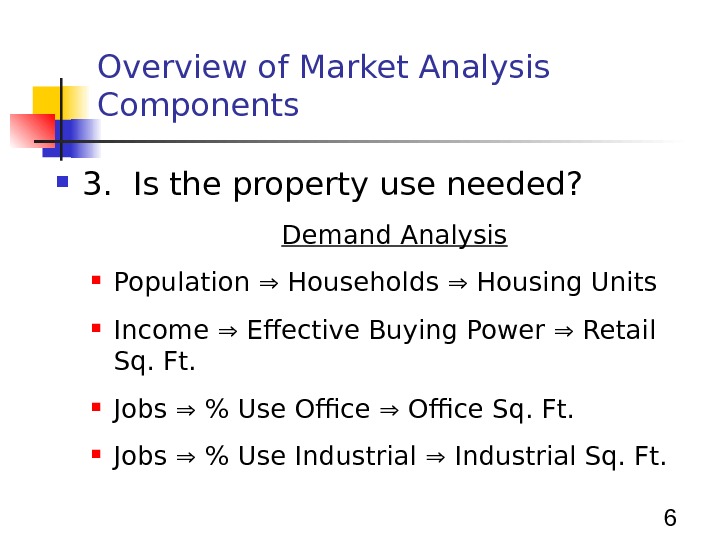
6 Overview of Market Analysis Components 3. Is the property use needed? Demand Analysis Population Households Housing Units Income Effective Buying Power Retail Sq. Ft. Jobs % Use Office Sq. Ft. Jobs % Use Industrial Sq. Ft.
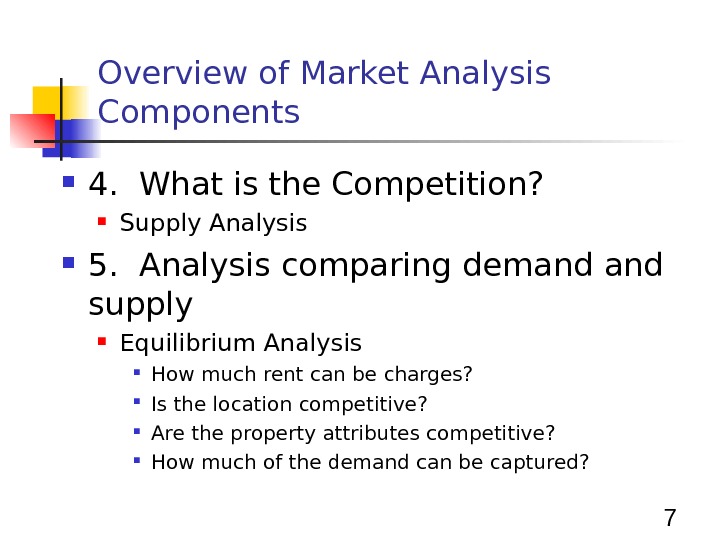
7 Overview of Market Analysis Components 4. What is the Competition? Supply Analysis 5. Analysis comparing demand supply Equilibrium Analysis How much rent can be charges? Is the location competitive? Are the property attributes competitive? How much of the demand can be captured?
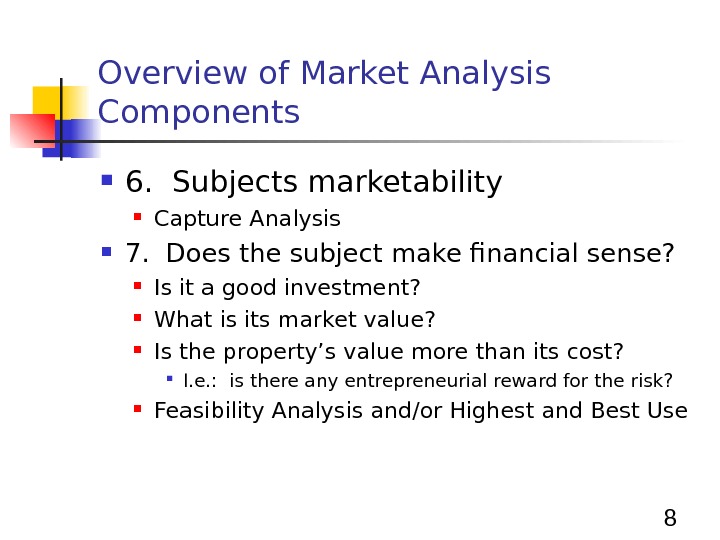
8 Overview of Market Analysis Components 6. Subjects marketability Capture Analysis 7. Does the subject make financial sense? Is it a good investment? What is its market value? Is the property’s value more than its cost? I. e. : is there any entrepreneurial reward for the risk? Feasibility Analysis and/or Highest and Best Use
9 Step 1: Define the Product Property Productivity Analysis A. Physical Attributes B. Legal and Regulatory Attributes Private Public C. Location Attributes Identification of economic attributes – the association between land uses and their linkages Identification of the movement of demand in relation to the direction of urban growth
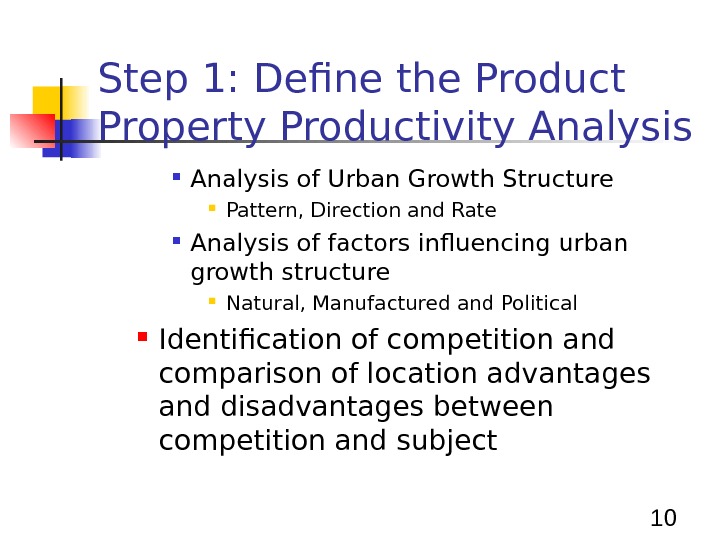
10 Step 1: Define the Product Property Productivity Analysis of Urban Growth Structure Pattern, Direction and Rate Analysis of factors influencing urban growth structure Natural, Manufactured and Political Identification of competition and comparison of location advantages and disadvantages between competition and subject
11 Step 1: Define the Product Property Productivity Analysis D. Market appeal Attributes: Identification of specific features such as design or amenities that appeal to market participants
12 Step 2: Define the Users Market Delineation A. Market area concepts Time-distance concepts Area over which equally desirable, substitute properties tend to compete with the subject B. Geographic Market Delineation C. Identification of Characteristics of Most Probable User (consumer profile)
13 Step 3: Forecast Demand Factors A. Major demand types Population creates households Income creates retail buying power Employment creates office and industrial users B. Tastes and preferences: behavioral, motivational, and psychological factors C. Demand segmentation
14 Step 4: Inventory and Forecast Competitive Supply A. Existing stock of competitive properties B. Potential competition Proposed construction Probable additional construction C. Factors influencing completion of potential competition Land availability and costs Interest Rates Material and labor costs Entrepreneurship
15 Step 5: Analyze the Interaction of Supply and Demand Residual Demand Study A. Competitive environment B. Residual Demand Concepts
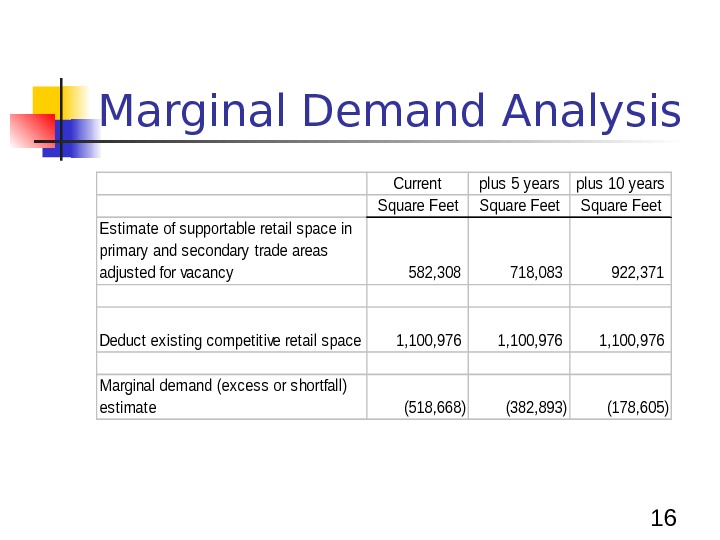
16 Marginal Demand Analysis. Currentplus 5 yearsplus 10 years Square Feet Estimate of supportable retail space in primary and secondary trade areas adjusted for vacancy 582, 308718, 083922, 371 Deduct existing competitive retail space 1, 100, 9761, 100, 976 Marginal demand (excess or shortfall) estimate(518, 668)(382, 893)(178, 605)
17 Step 6: Forecast Subject Capture A. Capture rate and absorption period for subject property B. Risk Analysis C. Reconciliation of market analysis and conclusions
18 Market Analysis Levels Inferred Demand Studies Levels A and B Emphasis is on knowledge and historical data Fundamental Demand Studies Levels C and D Emphasis is on quantifiable data and forecasting
19 Level A Market Analysis Draws on readily available regional and city data, a general area description provides the backdrop for the comparable property data used to represent market conditions Analyses are more descriptive than analytical Historically oriented rather than future oriented Rent and comparable sales are relied upon
20 Level A Market Analysis A. Property productivity analysis Physical attributes Legal attributes Location attributes B. Supply and demand analysis Demand Supply
21 Level A Market Analysis C. Marketability/equilibrium analysis/highest and best use conclusions Focuses on use conclusions Timing based on analysts feel for the market Improved Properties Use and timing for property use Vacant land or land as though vacant Use – Usually uses permitted by current zoning Timing – Considered immediate
22 Level B Market Analysis Relies upon broadly based surveys of the market for estimating supply and demand Uses quantifiable data as a basis for judgments about highest and best use and timing
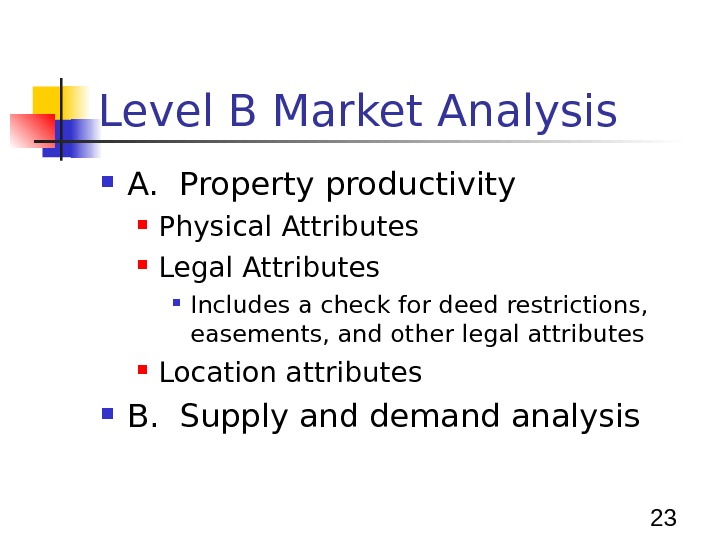
23 Level B Market Analysis A. Property productivity Physical Attributes Legal Attributes Includes a check for deed restrictions, easements, and other legal attributes Location attributes B. Supply and demand analysis
24 Level B Market Analysis C. Marketability/equilibrium analysis/highest and best use Uses specific quantifiable data for use and timing Employs data that relate to timing of demand – timing becomes function of demand relative to supply
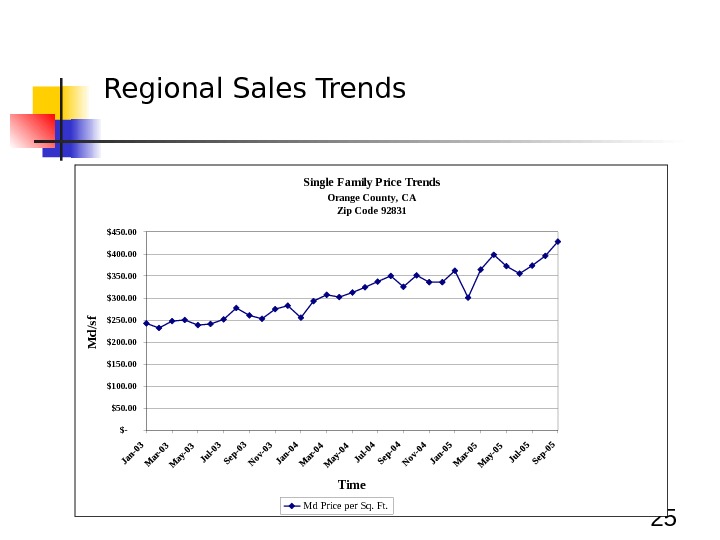
25 Regional Sales Trends Single F amily P rice Trends Orange Co unty, CA Zip Co de 92831 $-$50. 00$100. 00$150. 00$200. 00$250. 00$300. 00$350. 00$400. 00$450. 00 Time. M d/sf Md P rice per Sq. Ft.
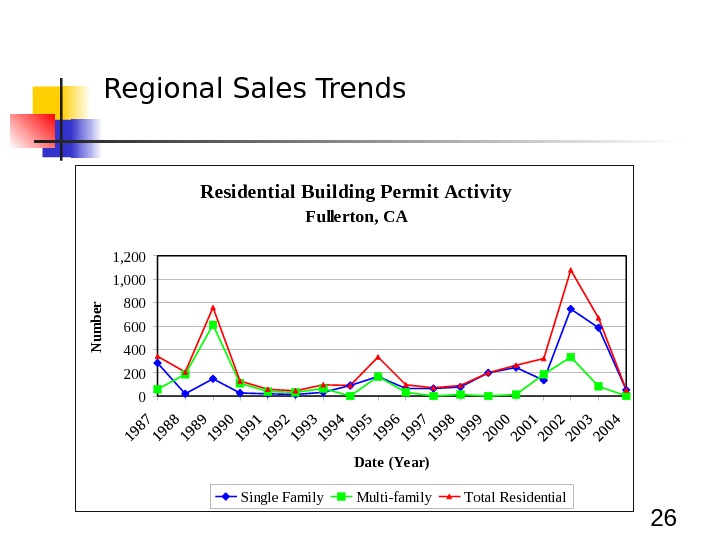
26 Regional Sales Trends Residential Building Permit Activity Fullerton, CA 02004006008001, 0001, 200 Date (Ye ar)N um ber Single Family Multi-family Total Residential
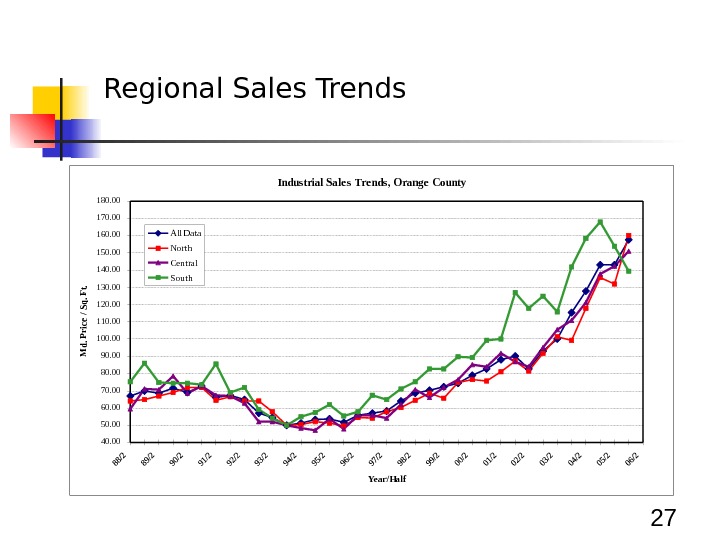
27 Regional Sales Trends. Industrial Sales Tre nds, Orange County 40. 0050. 0060. 0070. 0080. 0090. 00100. 00110. 00120. 00130. 00140. 00150. 00160. 00170. 00180. 00 Year/Half Md. Price / Sq. Ft. A ll Data North Central South
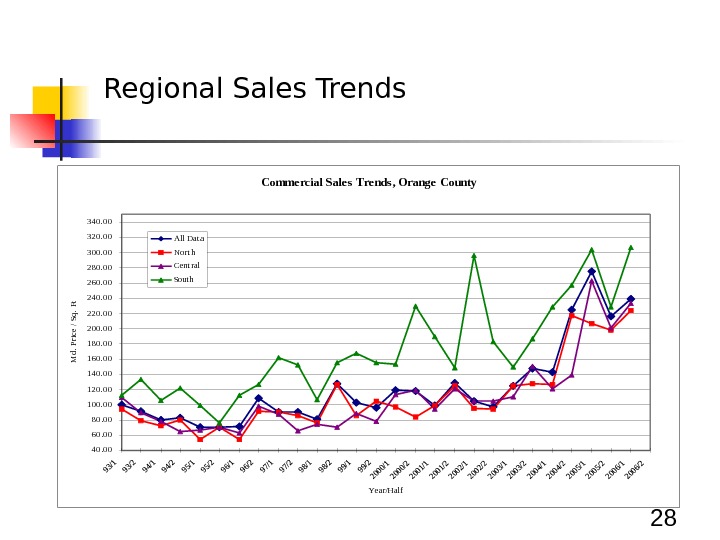
28 Regional Sales Trends. Comme rcial Sale s Tre nds, Orange County 40. 00 60. 00 80. 00 100. 00 120. 00 140. 00 160. 00 180. 00 200. 00 220. 00 240. 00 260. 00 280. 00 300. 00 320. 00 340. 00 Year/Half Md. Price / Sq. Ft. All Dat a No rt h Cent ral Sout h
29 Level C Market Analysis Employs fundamental forecasting techniques Can discern whethere is an excess or supply, an excess of demand, or a balanced market
30 Level C Market Analysis A. Property productivity analysis Physical attributes – same as level B Legal attributes – same as level B Location attributes Analyzed with a location rating grid to provide some quantified analysis of the subject’s competitive position
31 Level C Market Analysis B. Supply and demand analysis Uses future oriented forecasting techniques forecasting demand supply C. Marketability/equilibrium analysis/highest and best use conclusions Probable use of vacant land
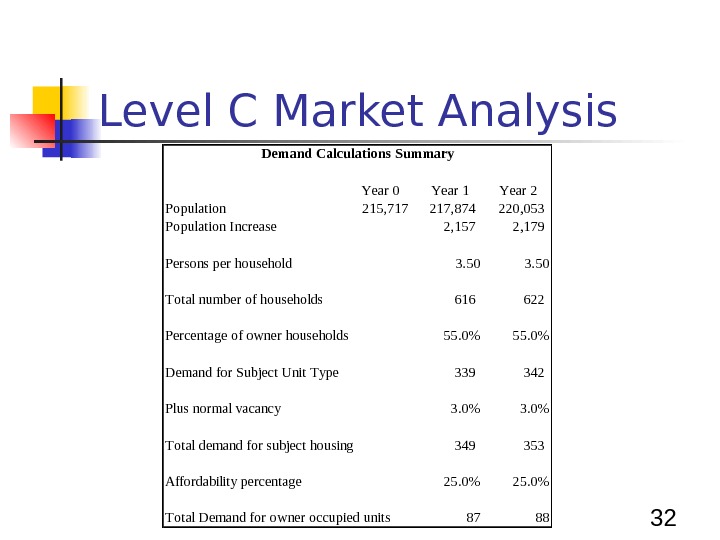
32 Level C Market Analysis Year 0 Year 1 Year 2 Population 215, 717 217, 874 220, 053 Population Increase 2, 157 2, 179 Persons per household 3. 50 Total number of households 616 622 Percentage of owner households 55. 0% Demand for Subject Unit Type 339 342 Plus normal vacancy 3. 0% Total demand for subject housing 349 353 Affordability percentage 25. 0% Total Demand for owner occupied units 87 88 Demand Calculations Summary
33 Level D Market Analysis Usually handled by professional real estate market analysts A. Property productivity analysis Includes detailed projections of probable future land uses B. Supply and demand analysis Forecasting demand supply C. Marketability/equilibrium analysis/highest and best use conclusions Improved existing or proposed properties Vacant land
34 Summary Levels of Market Analysis Inferred Demand Studies Sub-Level: A & B Infer subject attributes Infer location determinants of use & marketability by macro analysis Fundamental Demand Studies Sub-Level: C & D Quantify subject attributes Quantify and analyze location determinants of use & marketability by macro and micro analysis
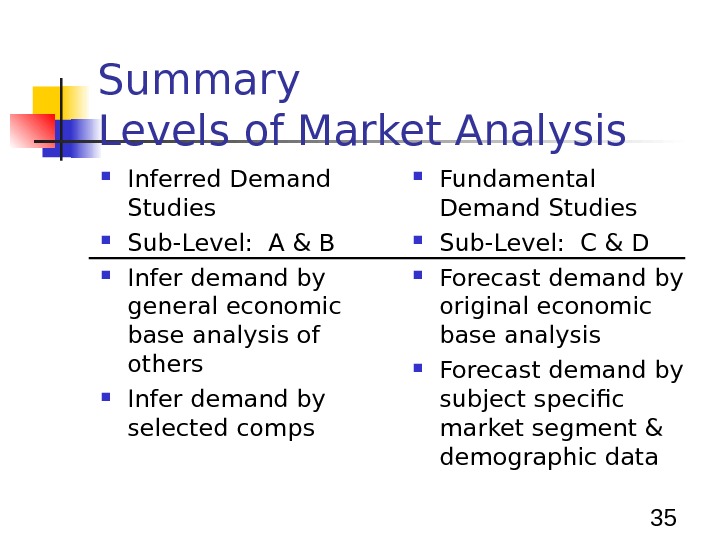
35 Summary Levels of Market Analysis Inferred Demand Studies Sub-Level: A & B Infer demand by general economic base analysis of others Infer demand by selected comps Fundamental Demand Studies Sub-Level: C & D Forecast demand by original economic base analysis Forecast demand by subject specific market segment & demographic data
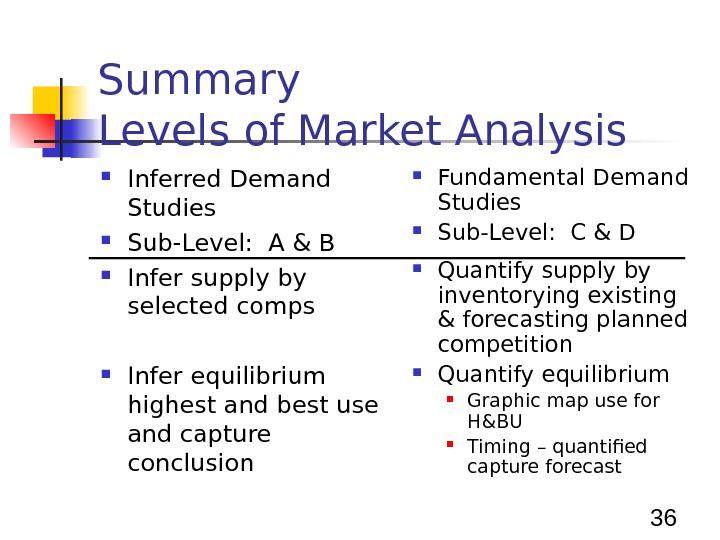
36 Summary Levels of Market Analysis Inferred Demand Studies Sub-Level: A & B Infer supply by selected comps Infer equilibrium highest and best use and capture conclusion Fundamental Demand Studies Sub-Level: C & D Quantify supply by inventorying existing & forecasting planned competition Quantify equilibrium Graphic map use for H&BU Timing – quantified capture forecast
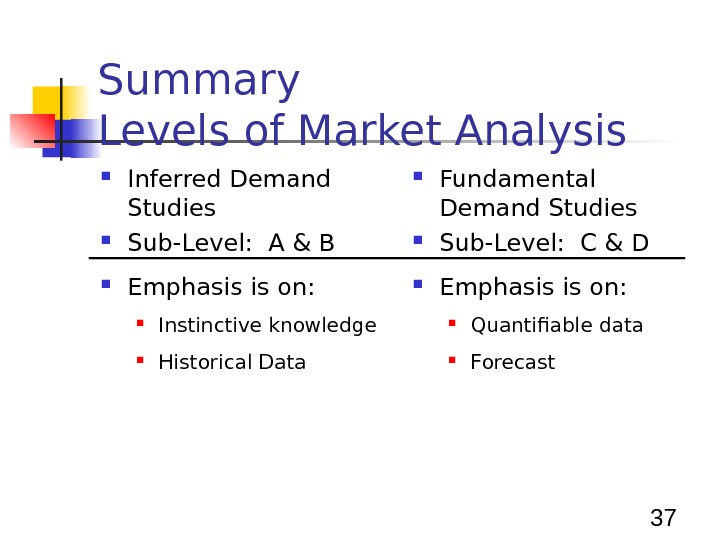
37 Summary Levels of Market Analysis Inferred Demand Studies Sub-Level: A & B Emphasis is on: Instinctive knowledge Historical Data Fundamental Demand Studies Sub-Level: C & D Emphasis is on: Quantifiable data Forecast
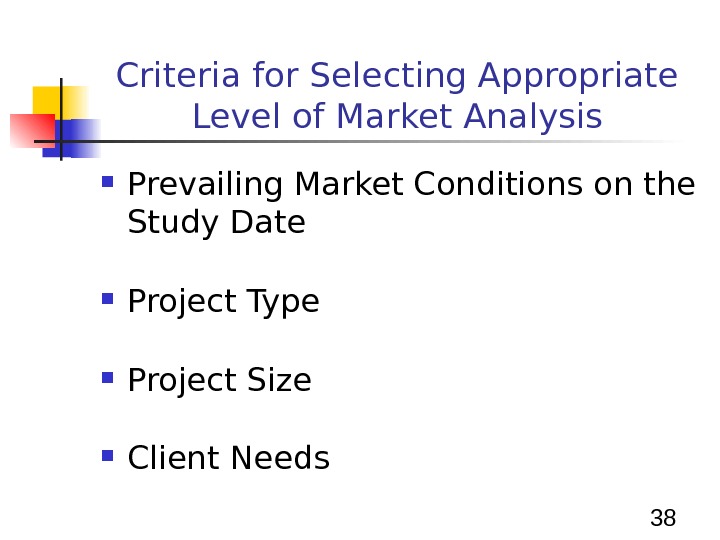
38 Criteria for Selecting Appropriate Level of Market Analysis Prevailing Market Conditions on the Study Date Project Type Project Size Client Needs
39 So That’s An Overview of Real Estate Market Analysis Wayne Foss, DBA, MAI, CRE, FRICS Fullerton, CA USA Email: waynefoss@usa. net