

c460ebe5d7de2797442d95d2b36098d9.ppt
- Количество слайдов: 157
 Vivian Kee Fiona Ko Carol Liu Xaviera Tam") Real Estate Investment Trust (REIT) Vivian Kee Fiona Ko Carol Liu Xaviera Tam
Real Estate Investment Trust (REIT) Vivian Kee Fiona Ko Carol Liu Xaviera Tam
 Agenda 1. 2. 3. 4. 5. 6. Industry Overview Canadian REITs & Tax Fairness Plan Benefits of REITs RIO CAN HR REITs Vanguard (ETF)
 What’s REIT? l l An income trust company that accumulates a pool of money to buy, develop, manage, and sell assets in Real Estate Must distribute at least 90% of taxable income as dividend Established in Canada in 1993 It can be privately held, publicly traded, or non-exchange traded
 “REITs are best performing asset class in the past month, led by REITs in UK and Japan. ” Global Equity Research Nov 9, 2006
 Types of REIT Equity REITs 1. • • Invest and own properties Most revenues come from rents Mortgage REITs 2. • • Loan money for mortgages to owners of real estate, or purchase existing mortgages or mortgage-backed securities Revenues come from interest earned on mortgage loans Hybrid REITs 3. • Combination of Equity and Mortgage REITs
 Types of Property 1. 2. 3. 4. 5. Multi-residential Industrial Office Self storage Diversified
 REITs around the World
 US REITs l l l Established in 1960 160 Equity REITs in US with market capitalization of US $423 billion Qualifications: l Corporation or business trust l 75% of assets must be real estate assets, cash, or government securities l 95% of gross income must from rents, mortgage interests, plus passive income (dividend or interest income) l Permitted to invest in foreign assets l Minimum distributions of 90% of taxable income
 Established in 1985 37 LPTs with") Australian REITs l l LPT (Listed Property Trusts) Established in 1985 37 LPTs with market capitalization of US $60 billion Qualifications: l l Fixed Trusts Must invest in assets that generate rental income Permitted to invest in foreign assets Must distribute 100% of income and 100% of capital gains as dividends
Australian REITs l l LPT (Listed Property Trusts) Established in 1985 37 LPTs with market capitalization of US $60 billion Qualifications: l l Fixed Trusts Must invest in assets that generate rental income Permitted to invest in foreign assets Must distribute 100% of income and 100% of capital gains as dividends
 Canadian REITs l l Established in 1993 27 REITs listed on TSX with market capitalization of $27 billion Added into the S&P/TSX Composite Index on Jan 26, 2005 Qualifications are updated with respect to Tax Fairness Plan
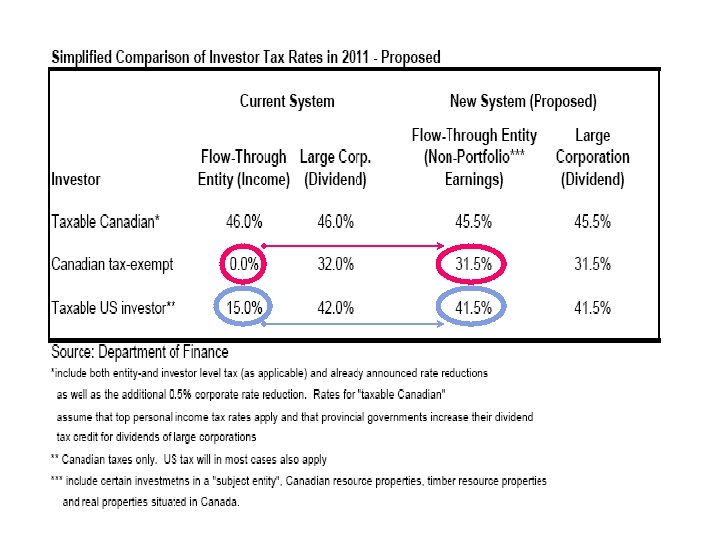
 Tax Fairness Plan l l l l Announced on Nov 1 st, 2006 Is applicable to all Canadian trusts companies, except REITs given certain conditions Before the plan, trust companies do not need to pay corporate tax Federal and Provincial government lose $1 billion annually in tax revenue to trusts Main purpose is to reduce the growing number of companies converting to trust Effective for trusts that begin trading after Oct 31, 2006 Four year transition period for existing trusts (2011)
 Income Trusts
 New Definition of Canadian REIT 1. 2. 3. 4. At no time in the year, shall a REIT hold non-portfolio property other than real properties situated in Canada. Have no less than 95% of its income for the year income from properties, whether in Canada or abroad (including dividends and interest come) Have no less than 75% of its income for the year directly or indirectly attributable from rents, mortgages, or gains on the disposition of real properties situated in Canada. Hold throughout the year real properties situated in Canada, cash, and debt or other obligations of Government of Canada with a total fair market value that is no less than 75% of its equity value.
 “At Risk” REITs l Cross-border REITs l Fail to comply with Rule 3 l l Significant US or foreign holdings Hotel REITs & Senior Housing REITs l Fail to comply with Rule 2 l Passive Income vs. Active Income
 l l l") Examples of “At Risk” REITs l Chartwells Senior Housing (CSH. un) l l l Internally manages its own and third party properties Violates Rule 2 25% of properties located in US Violates Rule 3 Sunrise REIT (SZR. un) l l 80% of assets located in US Canadian REITs book value of $260 M vs. REITs equity value of $630 M Violates Rule 4
Examples of “At Risk” REITs l Chartwells Senior Housing (CSH. un) l l l Internally manages its own and third party properties Violates Rule 2 25% of properties located in US Violates Rule 3 Sunrise REIT (SZR. un) l l 80% of assets located in US Canadian REITs book value of $260 M vs. REITs equity value of $630 M Violates Rule 4
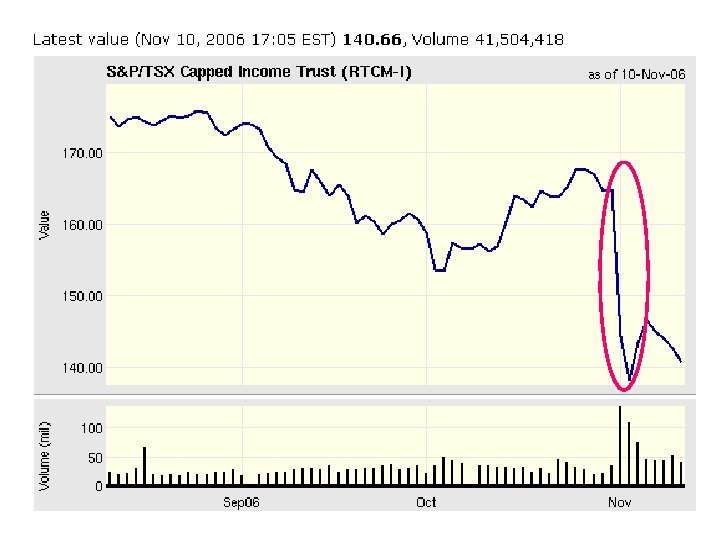
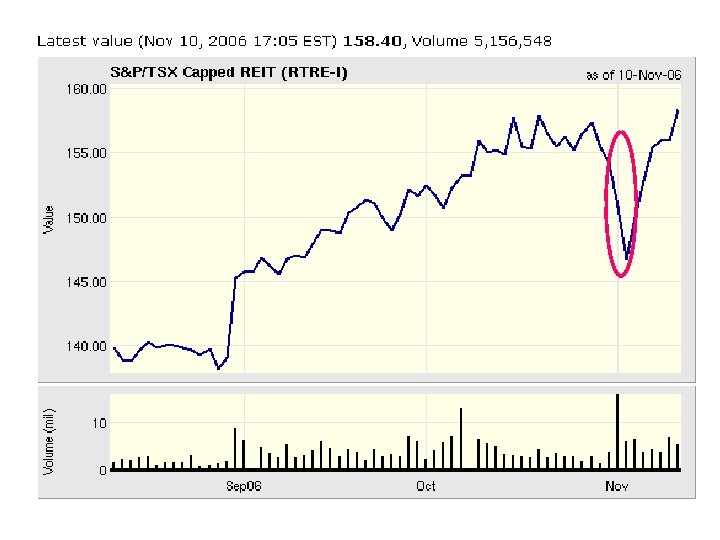
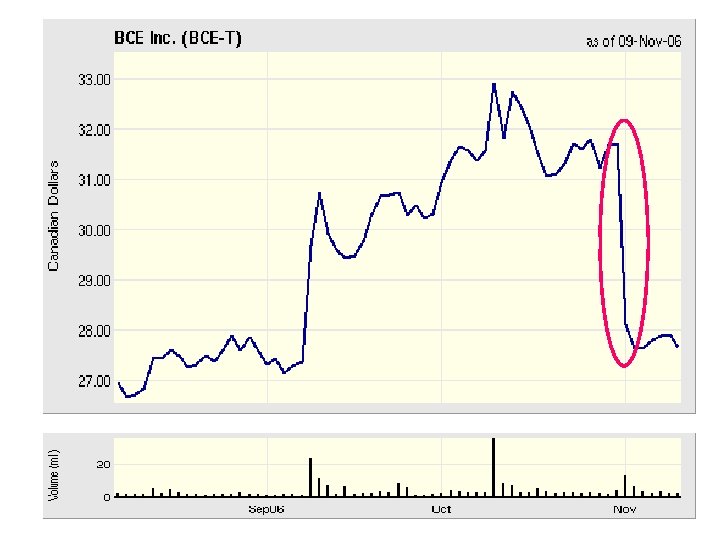
 Summary of Effects l l Both Income Trusts and REITs index value fell Investors are panic and uncertain Volumes traded were particularly high In the near future, most likely, there will be stronger funds into REITs as investors reallocate capital out of income trusts into REITs
 Value Drivers l l Rise in Interest Rates – Renting increases Fall in Interest Rates – Interest expense reduces
 Benefits to REIT Unitholders l l l l No corporate tax – no double taxation Taking a real stake in the ownership of property via increases and decreases in value Participating in the income generated by the property Does not need large capital investments Diversification – relatively low correlation between REIT and publicly traded real estate stock returns and the returns of other market sectors Liquid Relatively higher returns than other major indexes
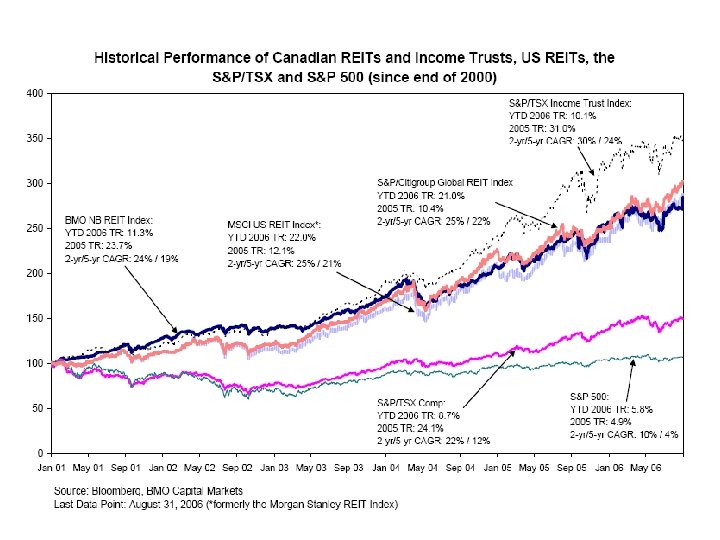
 REITs vs. Index
 REIT vs. S&P 500 NAREIT Equity Index S&P 500
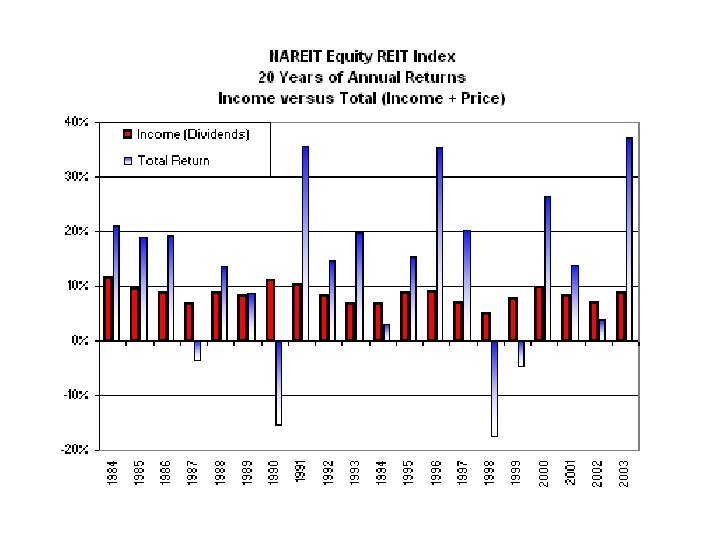
 Dividend Growth vs. CPI
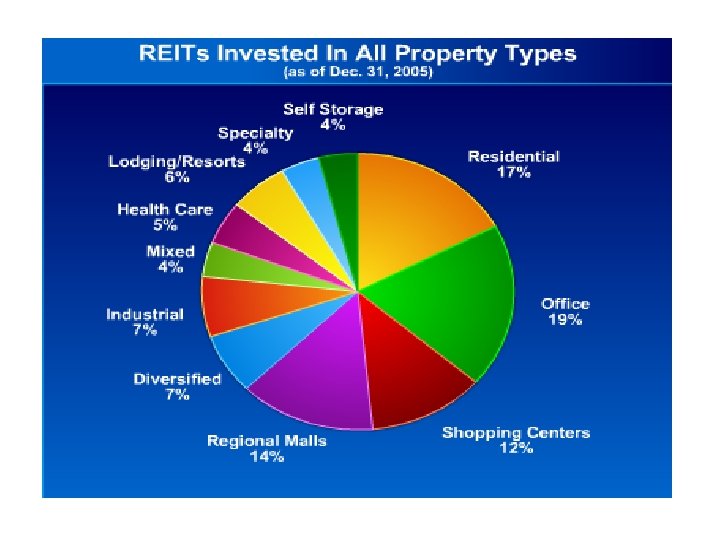
 Diversification
 Diversification
 Diversification
 Factors of Choosing REIT Internalized Management 1. • Ability to choose the right investments Diversification 2. • Types of properties invested Strong Growth Prospects Low Leverage Earnings 3. 4. 5. • FFO, instead of Net Income Cash Flows 6. • Available cash for dividend distribution
 Exchange: TSX Symbol: REI. UN-T
 Rio. Can Today Total outstanding units: 198, 735 Market value: C$5, 216, 793. 75
 Current Overview Canada’s largest REIT and the 2 nd largest public real estate entity in Canada (Equity REIT) l Went public in 1993 l Currently ranked the 16 th largest owner of shopping centres in North America (GLA)1 and largest in Canada l Enterprise value in excess of $7 billion l Focused on ownership and management of “Retail” real estate, a defensive asset class –Dominant owner of community and new format retail in Canada –Rio. Can has largely become the “Urban Market” REIT l
 Current Overview Ownership interest in 200 retail properties, including 14 under development, diversified throughout Canada – 72% of all Canadians live within 30 kilometers of a Rio. Can property l Proven track record of delivering stable growth while maintaining a conservative balance sheet l Strong, creditworthy tenant base –Long lease term profile with Canada’s best known tenants –Almost 5000 tenancies l A full-service real estate entity l
 Management Group
 Management Group
 Board of Trustees
 Canadian vs. US
 Only six metropolitan markets within Canada have in excess of one million people
 Canada’s Six Urban Markets
 Primary Marketing Strategy
 Geographic Distribution Based on Gross Revenue
 Gross Revenue from Six Urban Makets
 Stability of Revenue Stream A diverse, high quality investment grade tenant base and long lease 0 -term profile provides substantial income stability.
 Rio. Can Development Program
 Rio. Can Development Program
 Redevelopment and Expansion of Existing Properties
 Recent Investment Activities l l Focused investment strategy on increasing exposure to the unenclosed new format asset class 6 years ago, led to: l Average of $500 MM of acquisitions in each year (including partners’ interests) l A total of 23 MM sq. ft. l Average cap rate of 9. 3% l Average price per sq. ft. of $130 Portfolio repositioning strategy in 2005: l Acquired a total of 1. 9 MM sq. ft. (new format retail in primary markets) l Disposed of 21 non-core shopping centrestotaling 3. 4 MM sq. ft. l 12 enclosed malls, none of which were located in Canada’s 6 primary markets
 Forward Looking Information
 Price in the Past 1 Year
 Price in the Past 5 Years
 1 Year Comparison with S&P
 5 Years Comparison with S&P
 Rio. Can Financial
 06 Q 3 Balance Sheet
 06 Q 3 Income Statement
 06 Q 3 Cash Flow Statement 1 of 2
 06 Q 3 Cash Flow Statement 2 of 2
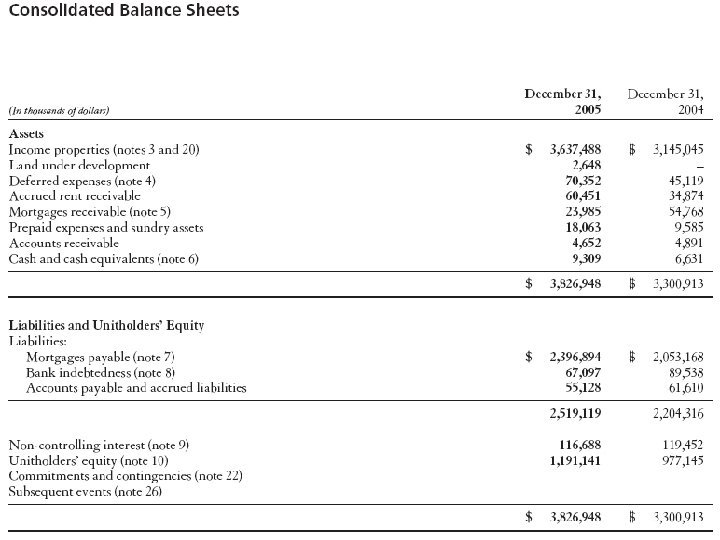
 05 Balance Sheet
 05 Income Statement
 05 Cash Flow Statement 2 of 2
 05 Cash Flow Statement 1 of 2
 Financial Summary
 Distribution History Distribution Year Pre-Split Distribution YTD 2006 C$1. 08 so far, expecting C$1. 32 2005 C$1. 27 2004 C$1. 23 2003 C$1. 14 2002 C$1. 11 2001 C$1. 08 2000 C$1. 07 1999 C$1. 04 1998 C$0. 95 1997 C$1. 55 C$0. 78 1996 C$1. 30 C$0. 65 1995 C$1. 15 C$0. 58
 Continuous Distribution Increase
 Changes in Payout Ratio
 Recommendation
 H&R REIT Open-ended Real Estate Investment Trust
 Latest Price As of Nov 16, 2006 Last: C$ 24. 950 Net Change: C$ 0. 600 % Change: 2. 46% Open 24. 360 Bid 24. 910 High 25. 280 Ask 25. 000 Low 24. 220 EPS 0. 85 Volume 583, 740 P/E 29. 40 52 -Week High 24. 440 Indicated Annual Div. 1. 37 52 -Week Low 18. 250 Yield 5. 63 Market Capitalization: $2, 756, 065, 872 Units Outstanding: 124, 372, 465
") Closing Price based on 3 Years (Weekly)
Closing Price based on 3 Years (Weekly)
") H&R REIT vs. S&P 500 (3 Years - Weekly)
H&R REIT vs. S&P 500 (3 Years - Weekly)
") Closing Price based on 5 Years (Monthly)
Closing Price based on 5 Years (Monthly)
") H&R REIT vs. S&P 500 (5 Years - Monthly)
H&R REIT vs. S&P 500 (5 Years - Monthly)
 Corporate Information l l l IPO in December 1996. Owns, manages and acquires income producing properties, and provides mezzanine financing for development projects. H&R REIT is a TSX-listed, open-ended Real Estate Investment Trust. The REIT holds interests in 34 office properties, 113 singletenant industrial properties, 133 retail properties and 2 development projects, principally in the Greater Toronto Area.
 Portfolio As of November 10, 2006 Office Industrial Retail Developments 34 113 133 2 Net Rentable Area (sf) * 8, 001, 647 23, 185, 863 9, 570, 546 N/A Book Value ($ millions) * $ 1, 548 $ 1, 371 $ 1, 400 $ 29 Number of Properties Selected Tenants Bell Canada Inc. , Canadian Tire, Rona Inc. , Lowe's, Trans. Canada Purolator Courier Shell Oil Products, Pipelines, Bell Limited, Nestle USA, Home Depot, Wal. Mobility, Royal Bank Finning International Mart, Chapters, Nike, of Canada, Public Inc. , Circuit City, Canadian Tire, Works of Canada, Nortel Networks, Famous Players, Nestle, Telus Asea Brown Boveri, Eckerd, Walgreens, Communications, Sherwin Williams, Sobey's, A&P, Americredit, Sysco Food Services Shoppers Drug Mart Telemedia, Sony of Canada Pictures Entertainment
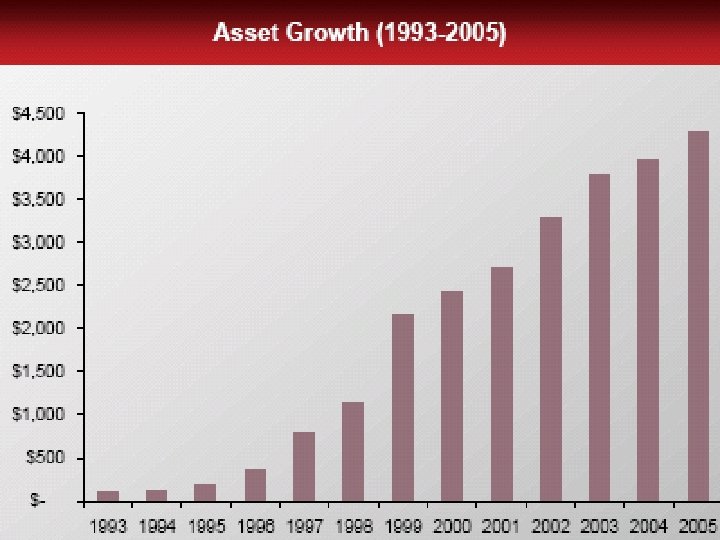
 1996 Today (2005) 27 227 Assets $270") Growth over 9 years (End of 2005) 1996 Today (2005) 27 227 Assets $270 M $3. 8 B Market Cap. $170 M $2. 3 B Average term of leases 8 yrs 12. 3 yrs Average term of mortgages 8 yrs 11. 1 yrs $0. 75 $1. 46 Properties Distributable Income per unit
Growth over 9 years (End of 2005) 1996 Today (2005) 27 227 Assets $270 M $3. 8 B Market Cap. $170 M $2. 3 B Average term of leases 8 yrs 12. 3 yrs Average term of mortgages 8 yrs 11. 1 yrs $0. 75 $1. 46 Properties Distributable Income per unit
 Diversification of Rental Area
 Book Value by Geographic Region
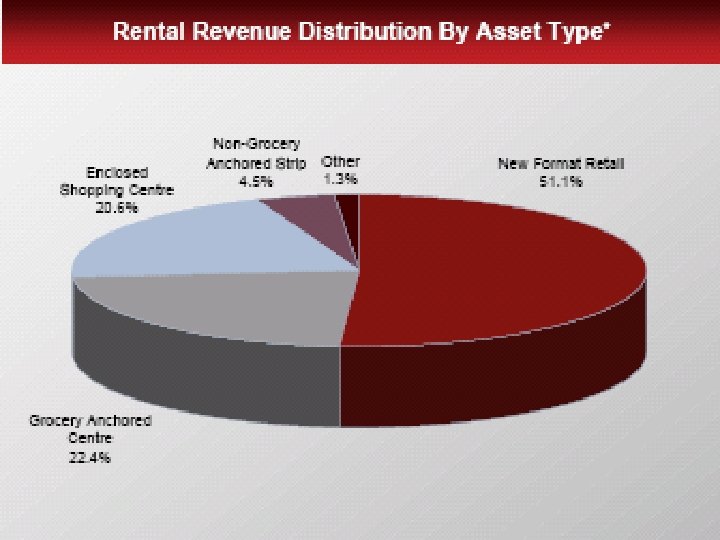
 Operating Income by Type of Asset
 Flagship Properties l l 320 Front Street, Toronto, 590, 000 sq. ft. – lead tenant Royal Bank Nestle building, North York, 360, 000 sq. ft. – lead tenant Nestle Canada
![Key Acquisitions in 2001 Location Est. Lease Price Levered Term [CAD$] Return [Years] Purolator](https://present5.com/presentation/c460ebe5d7de2797442d95d2b36098d9/image-87.jpg "Key Acquisitions in 2001 Location Est. Lease Price Levered Term [CAD$] Return [Years] Purolator") Key Acquisitions in 2001 Location Est. Lease Price Levered Term [CAD$] Return [Years] Purolator Courier Distribution Centres 12 across Canada $83 M 14% 20 Bell Canada Office/data Centres Montreal and Toronto $124 M 18% 20 $263 M 17% 20 Trans. Canada Calgary Pipelines Office Tower
Key Acquisitions in 2001 Location Est. Lease Price Levered Term [CAD$] Return [Years] Purolator Courier Distribution Centres 12 across Canada $83 M 14% 20 Bell Canada Office/data Centres Montreal and Toronto $124 M 18% 20 $263 M 17% 20 Trans. Canada Calgary Pipelines Office Tower
![Key Acquisitions in 2003 Price [CAD$] Est. Levered Return Lease Term [Years] Finning International](https://present5.com/presentation/c460ebe5d7de2797442d95d2b36098d9/image-88.jpg "Key Acquisitions in 2003 Price [CAD$] Est. Levered Return Lease Term [Years] Finning International") Key Acquisitions in 2003 Price [CAD$] Est. Levered Return Lease Term [Years] Finning International Western Facilities Canada $79 M 17% 20 Bell Canada Complex Mississauga $140 M 13% 20 Place Bell Canada Ottawa $224 M 16% 14 Circuit City Distribution Centre Marion, Illinois $48 M 14% 19 Lowe’s Home Improvement stores Georgia, Alabama $43 M 14% 17 Location
Key Acquisitions in 2003 Price [CAD$] Est. Levered Return Lease Term [Years] Finning International Western Facilities Canada $79 M 17% 20 Bell Canada Complex Mississauga $140 M 13% 20 Place Bell Canada Ottawa $224 M 16% 14 Circuit City Distribution Centre Marion, Illinois $48 M 14% 19 Lowe’s Home Improvement stores Georgia, Alabama $43 M 14% 17 Location
![Key Acquisitions in 2003 - US Tenants Price [CAD] Est. Levered Return 28 Stand](https://present5.com/presentation/c460ebe5d7de2797442d95d2b36098d9/image-89.jpg "Key Acquisitions in 2003 - US Tenants Price [CAD] Est. Levered Return 28 Stand") Key Acquisitions in 2003 - US Tenants Price [CAD] Est. Levered Return 28 Stand alone retails properties Lowes, Home Depots, Walgreens, Sams Club $292 M 15% 6 Distribution Centres Georgia Pacific, Sherwin, Williams, Jones Apparel $123 M 13%
Key Acquisitions in 2003 - US Tenants Price [CAD] Est. Levered Return 28 Stand alone retails properties Lowes, Home Depots, Walgreens, Sams Club $292 M 15% 6 Distribution Centres Georgia Pacific, Sherwin, Williams, Jones Apparel $123 M 13%
 Management Profile Thomas J. Hofstedter, President & CEO founded H&R REIT in 1996; more than 25 years in commercial real estate; CA. Initial Assets: • 567, 861 square foot office complex located at 310 -320330 Front Street West in Toronto, tenants as NCR and the Royal Bank; • 359, 227 square foot office tower located at 25 Sheppard Avenue West in Toronto, head office of Nestlé Canada; • 153, 314 square foot office building located at 145 Wellington Street West in Toronto, corporate head office of AIG.
 Management Profile l Eric Cohen, Chief Financial Officer l joined H&R REIT in 1996; 16 years in commercial real estate; CA. l Nathan Uhr, Vice President, Acquisitions l joined H&R REIT in 1996; 30 years in commercial real estate.
 “Two-part” Strategy l Establishing strong, stable cash flow by locking in the company portfolio’s income yield regardless of real estate cycles.
 “Two-part” Strategy l l l Building a portfolio that can withstand the inevitable economic and real estate cycles in various markets and generate a dependable income stream. Through acquisitions, new developments or expansions. Maintain a balanced mix of properties
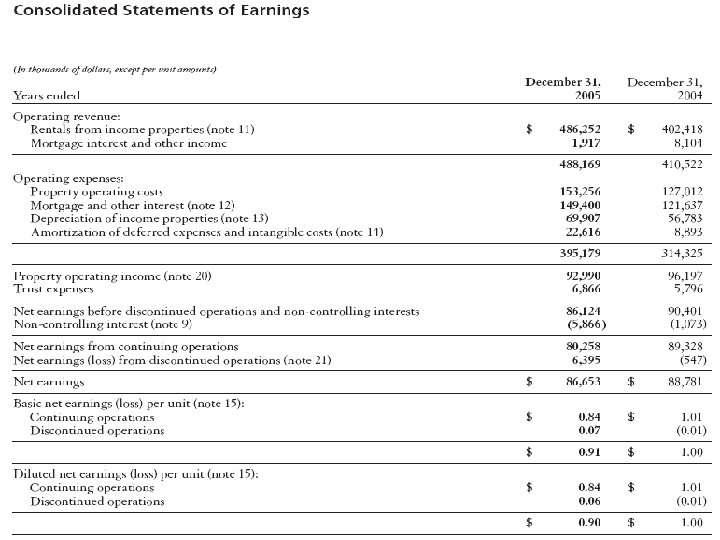
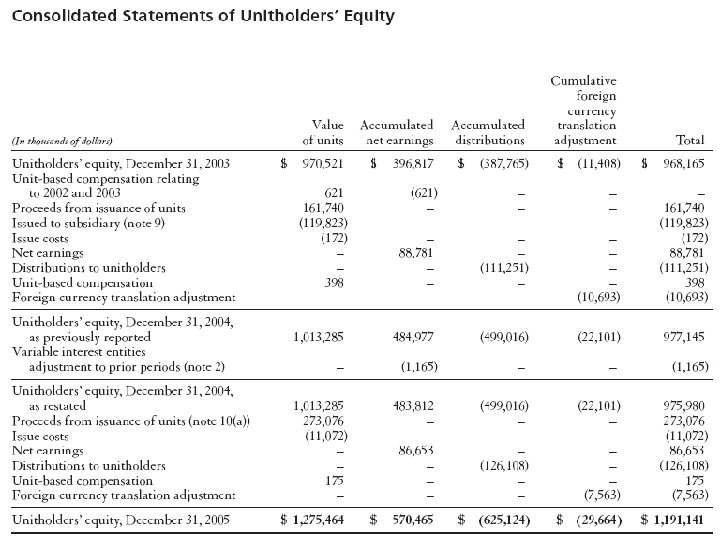
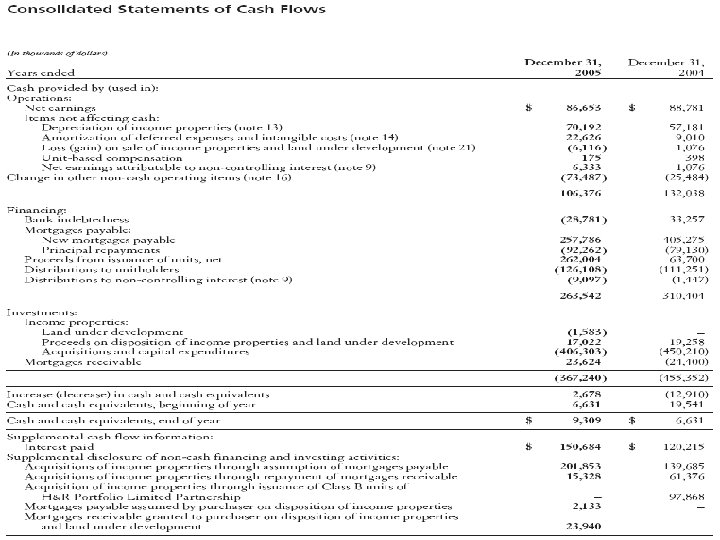
 H&R REIT Financial Information End of December 2005
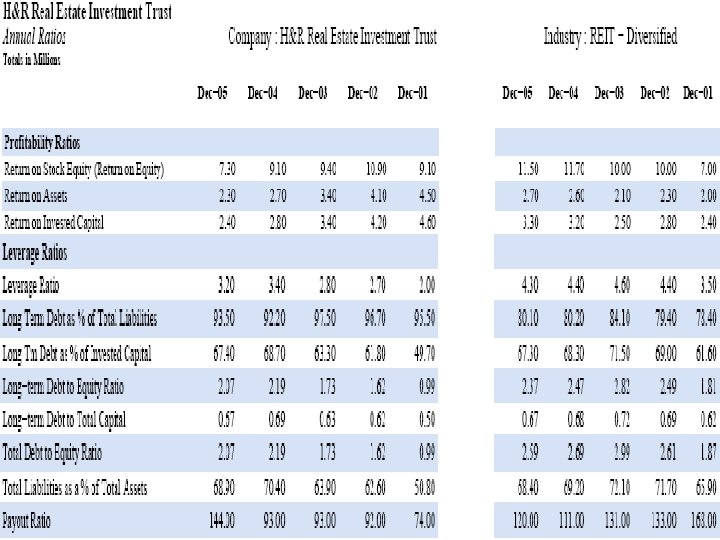
 Summary of Financial Information
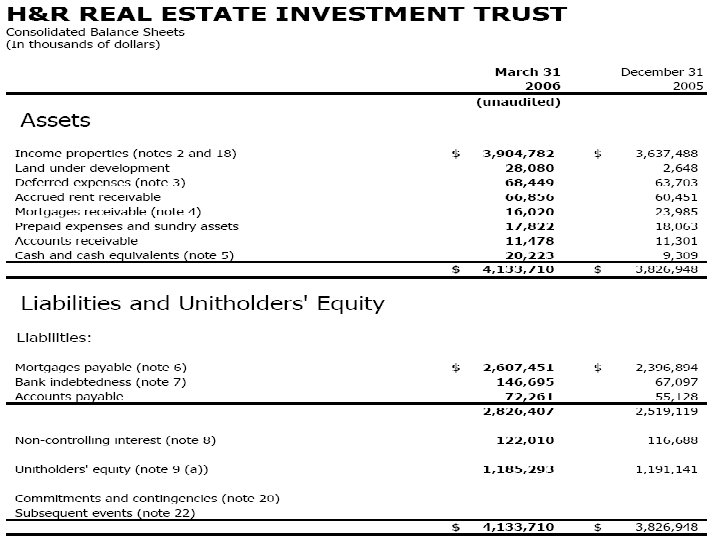
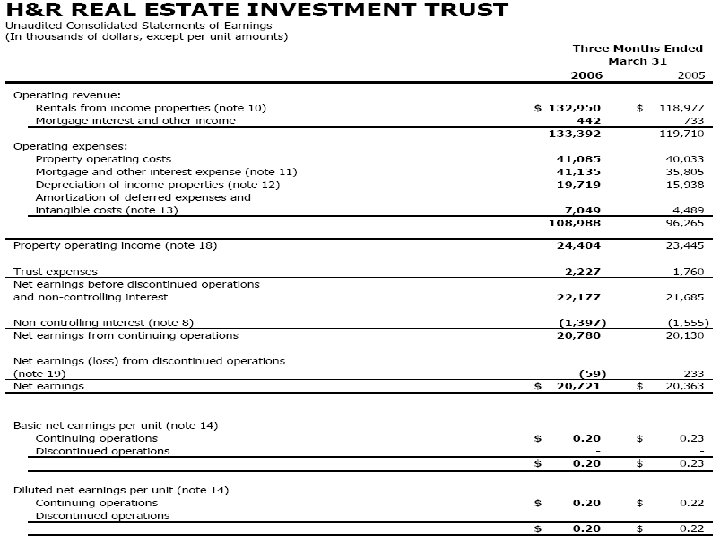
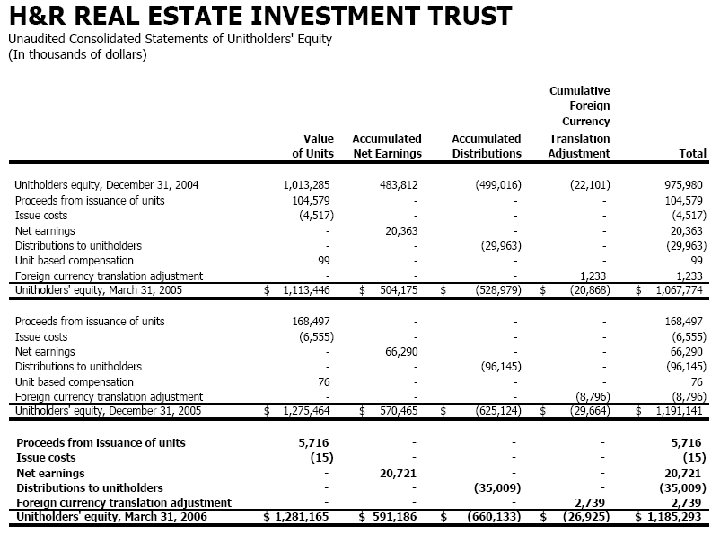
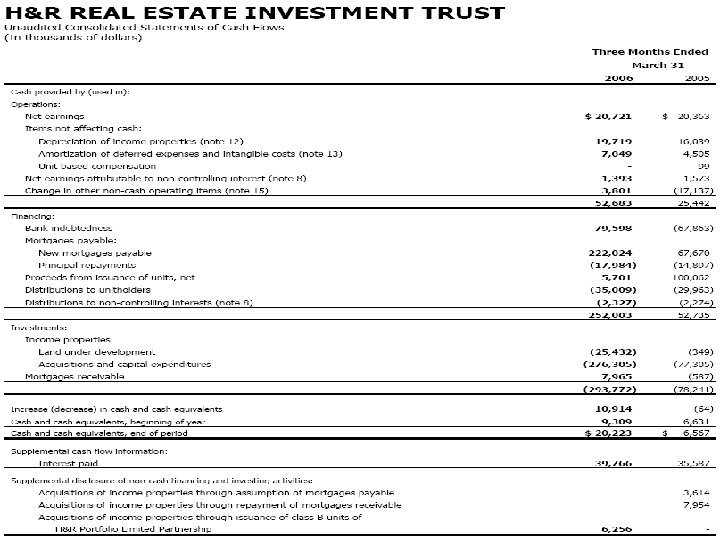
 H&R REIT First Quarter 2006 Report
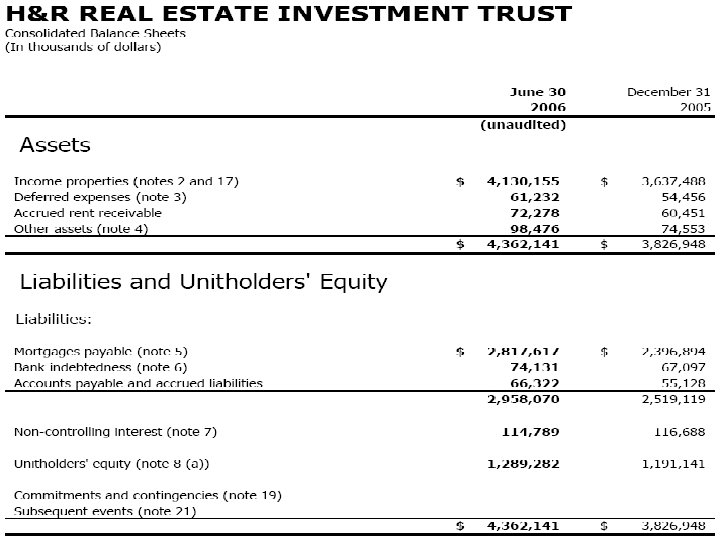
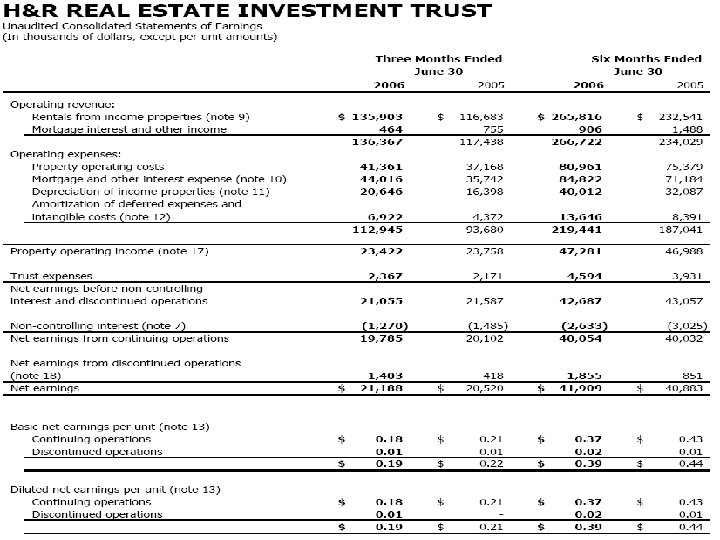
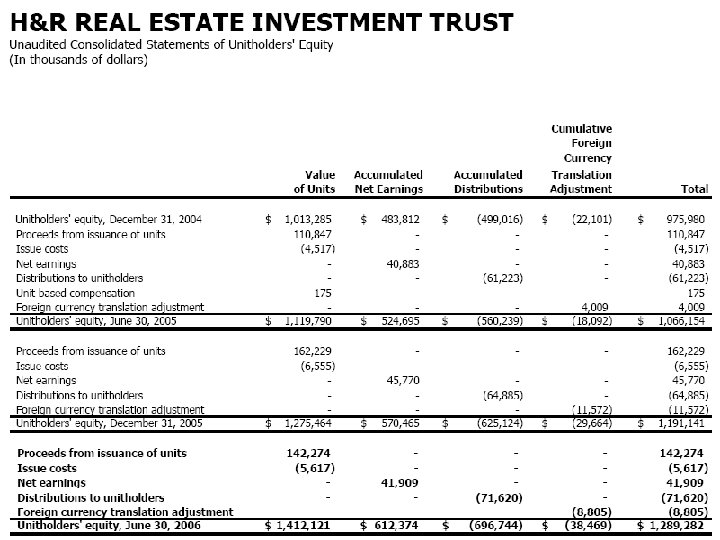
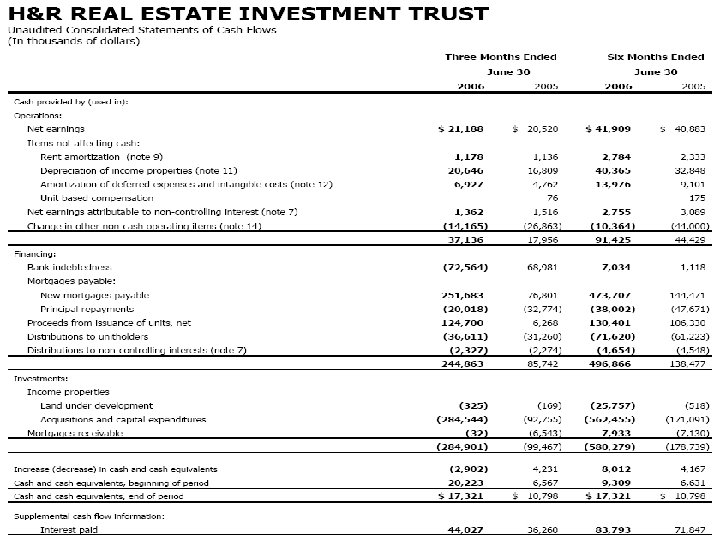
 H&R REIT Second Quarter 2006 Report
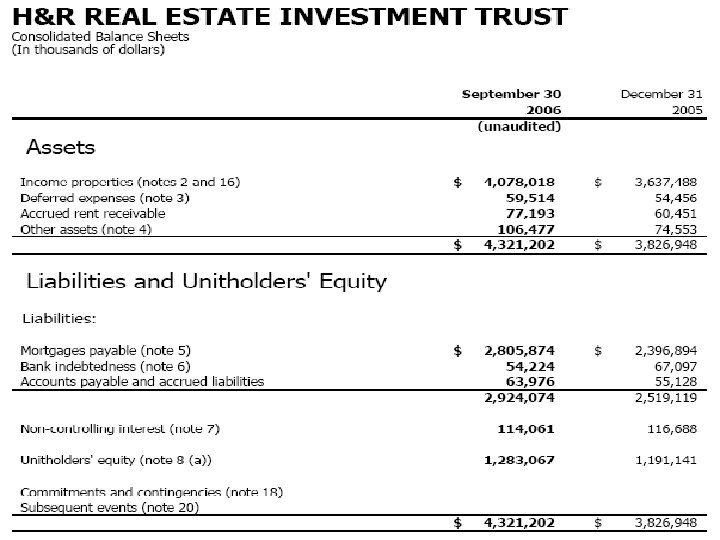
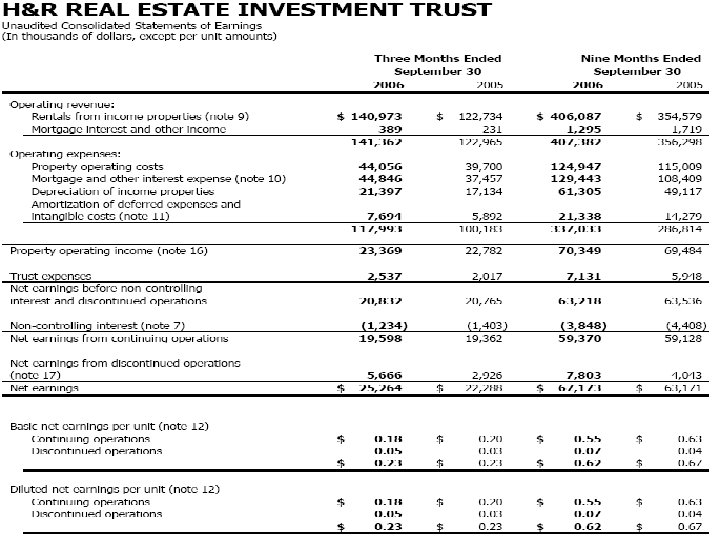
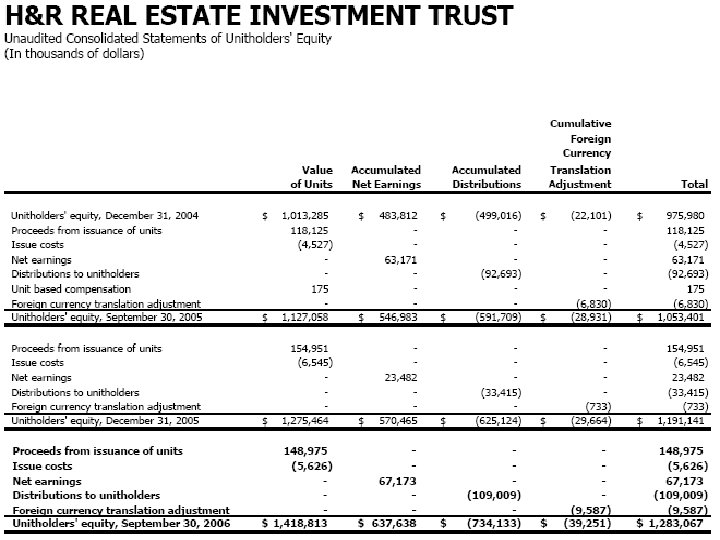
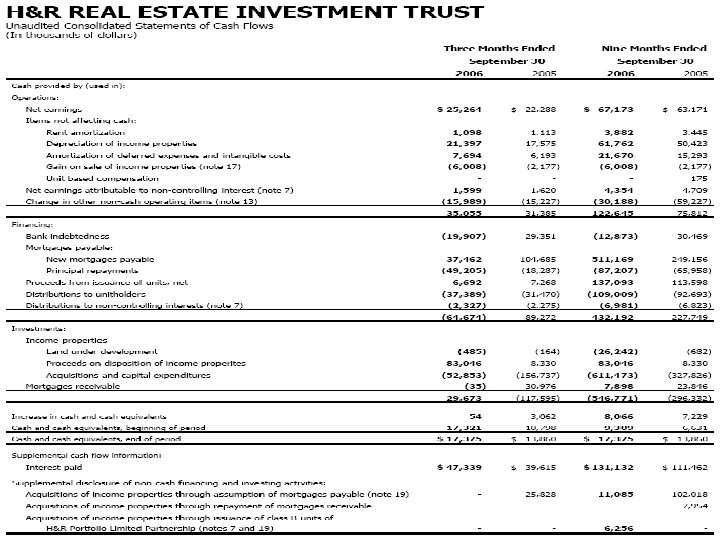
 H&R REIT Third Quarter 2006 Report
 Annual EPS Report
 Payout") Distribution History Cash Distribution Per Unit (approximately 91% of Distribution Income Per Unit) Payout Period - Monthly Year Distribution 1997 $0. 6800 1998 $1. 0300 1999 $1. 1040 2000 $1. 1090 2001 $1. 1640 2002 $1. 1990 2003 $1. 2240 2004 $1. 2440 2005 $1. 3044 2006 Commencing Jan 2006 $0. 1112 per unit ($1. 3344 on an annualized basis)
Distribution History Cash Distribution Per Unit (approximately 91% of Distribution Income Per Unit) Payout Period - Monthly Year Distribution 1997 $0. 6800 1998 $1. 0300 1999 $1. 1040 2000 $1. 1090 2001 $1. 1640 2002 $1. 1990 2003 $1. 2240 2004 $1. 2440 2005 $1. 3044 2006 Commencing Jan 2006 $0. 1112 per unit ($1. 3344 on an annualized basis)
 Recommendation

 Current Market Information
 Current Market Information
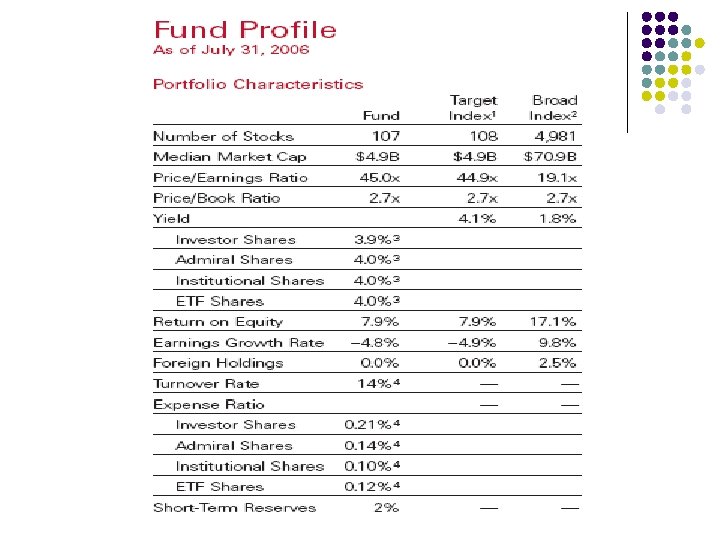
 Vanguard REIT ETF l What does the fund do? an exchange-traded share class of Vanguard® REIT Index Fund, which employs a “passive Management” investment approach designed to track the performance of the MSCI® US REIT Index, a benchmark of U. S. property trusts that covers about two-thirds of the value of the entire U. S. REIT market.
 2.") Portfolio Holdings l l 97. 91 % REITS ( High industry concentration risk) 2. 09 % Short term reserve holdings to maintain liquidity for redemptions
Portfolio Holdings l l 97. 91 % REITS ( High industry concentration risk) 2. 09 % Short term reserve holdings to maintain liquidity for redemptions
 ETF Information Target REIT Composite is the MSCI US REIT Index adjusted to include a 2% cash position (Lipper Money Market Average).
 Management Profile Gerard C. O'Reilly, Principal Manager l l Portfolio manager. Advised the fund since 2004. Worked in investment management since 1992. B. S. , Villanova University.
 Management Profile George U. Sauter l l l Oversees Vanguard’s Quantitative Equity and Fixed Income Groups With Vanguard since 1987 Quantitative Equity Group manages indexed and structured equity portfolios covering U. S. and international markets. advised Vanguard REIT ETF since 2004 chief investment officer. A. B. in economics from Dartmouth College and an M. B. A. in finance from the University of Chicago.
 MCSI REIT Index
 Top Ten Holdings
 1. Simon Property Group Inc. • Delaware corporation that operates as a self- administered and self-managed real estate investment trust. • ownership, development, and management of retail real estate, primarily regional malls, Premium Outlet® centers and community/lifestyle centers. • As of December 31, 2005, the Company owned or held an interest in 286 income- producing properties in the United States, which consisted of 171 regional malls, 33 Premium Outlet centers, 71 community/lifestyle centers, and 11 other shopping centers or outlet centers in 39 states and Puerto Rico, ten parcels of land held for future development, ownership interests in 51 European shopping centers in France, Italy and Poland, five Premium Outlet centers in Japan, and one Premium Outlet center in Mexico.
 2. Equity Residential l engaged in the acquisition, development, ownership, management and operation of multifamily properties. is structured as an umbrella partnership REIT, under which all property ownership and business operations are conducted through the Operating Partnership and its various subsidiaries. strategy for accomplishing these objectives includes: Leveraging the Company's size and scale in four critical ways: Investing in apartment communities located in strategically targeted markets, to maximize its total return on an enterprise level; Meeting the needs of the Company's residents by offering a wide array of product choices and a commitment to service; Engaging, retaining, and attracting the people by providing them with the education, resources and opportunities to succeed; and Sharing resources, customers and practices in property management and across the enterprise.
 3. Equity Office Properties Trust l l l was organized in 1996 and began operations in 1997 owns all of its assets and conducts all of its operations through EOP Partnership and its subsidiary entities. As of December 31, 2005, the Company owned whole or partial interests in 622 office properties comprising 111. 5 million square feet in 16 states and the District of Columbia. owns, manages, leases and develops office properties. At December 31, 2005, the Company had a national office portfolio comprised of whole or partial interests in 622 office buildings located in 16 states and the District of Columbia. owns premium quality office buildings.
 4. Pro. Logis l l an international operating company organized as a Real Estate Investment Trust (REIT). the largest publicly held, U. S. headquartered, global owner and operator of distribution properties. Founded in 1991 a service-oriented company focusing on meeting the needs of customers through the unique Pro. Logis Operating System® - made up of over 1, 200 real estate professionals working together to provide quality facilities and services to customers in North America, Europe and Asia.
 Geographical Diversification • 100% invested in the US • Limited Diversification • High geographical concentration risk
 Performance History
 Current Performance
 Annual Report Total Returns
 Annual Report
 Annual Report Expense Ratios
 Vanguard Index Participation Receipts – VIPERs a VIPER can be bought and sold anytime during the trading day at the current market price
 Cumulative Returns
 Statement of Net Assets
 Statement of Operations
 Financial Highlights
 Notes Management Fees In Kind Redemptions Capital Share Transactions
 Semi Annual Report Total Return
 Semi Annual Report Expense Ratios
 Statement of Net Assets
 Statement of Operations
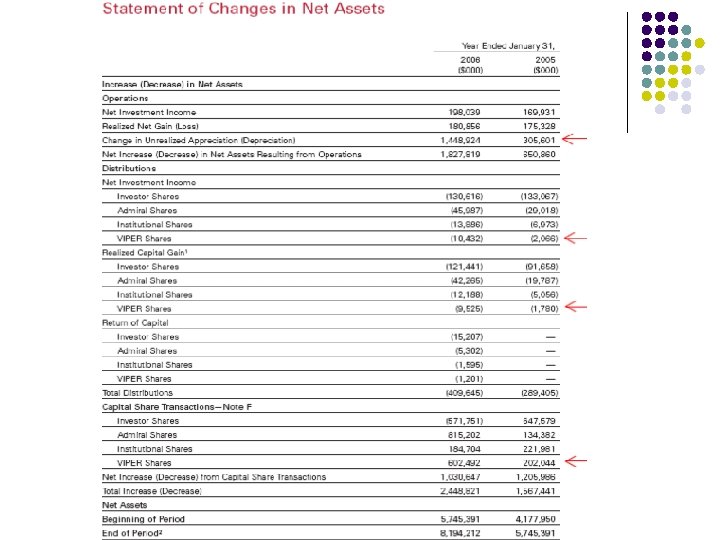
 Statement of Changes in Net Assets
 Financial Highlights
 Notes Management Fees In Kind Redemptions Capital Share Transactions
 Distribution
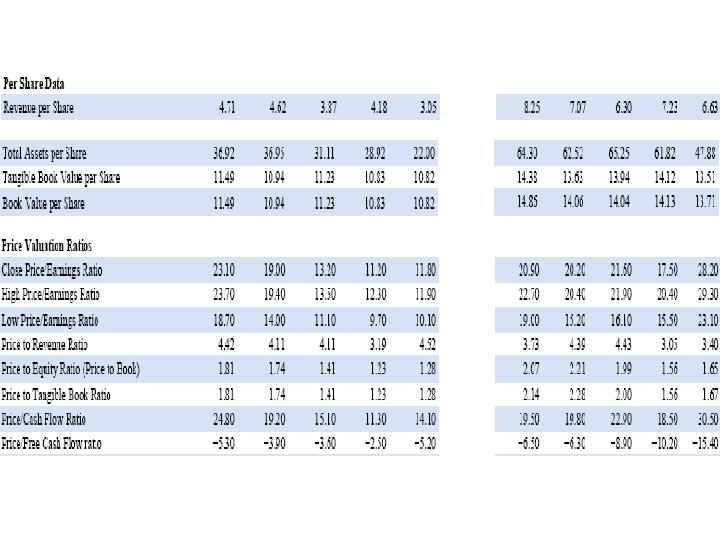
 Valuation
 Recommendation l Hold until further evaluation at year end. Expensive l Can be costly to trade based on percentage commissions. l High P/E l