48c24d06b31a54ad1d95836294275e69.ppt
- Количество слайдов: 22


")
Rapid & Complete In Situ Bioremediation of Chlorinated Solvents Using Enhanced Anaerobic Dechlorination (EAD)
 Its All About Delivery: Our ISD™")
Roadmap ISD TM In Situ Delivery Systems 1) Its All About Delivery: Our ISD™ systems provide a powerful delivery platform to support site-wide anaerobic degradation of chlorinated solvents 2) Full-scale Case Study: Field applications of our ISD groundwater recirculation approach validates this remediation strategy

ISD Concept Substrate-amended H 2 O ISD System Delivery System Substrate Nutrient Metering Rapid Solvent Degradation Ground Surface VADOSE ZONE Contact between substrate and chlorinated solvents Confining Layer SATURATED ZONE q Effective substrate delivery via 24/7 GW recirculation - NO SLUG INJECTIONS q Highly soluble substrate, plus nutrients, to grow active biomass in porespace q Max. microbial activity, ↓ ORP, methanogenic cond. , ↑ dissolution, no rebound

EAD Process Competing electron acceptors: Food Electron donor O 2 NO 3 Mn 4+ Fe 3+ SO 42 - NUTRIENTS: PCE P TCE K DCE Trace Metals VC Mn 2+ Fe 2+ H 2 S Chlorinated hydrocarbons: N N 2 Ethene / Ethane

ETEC’s EAD Process l Advantages of Groundwater Recirculation w/ ISD™ – – l Programmable Automation Direct hydraulic influence and capture Contact – dissolved & adsorbed (source, distal plume) Biomass generation, site-wide activity Inexpensive Electron Donor - Car. Bstrate™ – Nutrient-amended Carbohydrate – low cost ($2/lb) l Installation/Interpretation Services – Equipment installation & training – Monthly Interpretation/Evaluation of Data l Timeframe – ISD results in months vs. years – Minimal O&M and cost (pulsed vs. continuous)

Pilot-scale Data: Industrial Site Eugene, Oregon

OR Case Study Site Plan 15 m Groundwater Flow Direction MW-2 9 m Mobile ISD System MW-3 MW-1 LEGEND Injection Wells Extraction Flow Line Extraction Wells Monitoring Wells Injection Flow Line MW-4

TMW-3 Results l Operating Parameters – – – 3 weeks 178, 000 liters recirculated 180 kg of Car. Bstrate™ l Observations – – CAH concentrations increased 2 -3 fold during 1 st week, no PCE at TMW-3 DCE from 360 to 2, 000 ppb Initial total CAH 3. 8 μmol/L, with a high of 22. 3 μmol/L 8 months, no rebound, cis-DCE and VC (6 and <1 ppb) 8

Full-scale Case Study: Industrial Site Eugene, Oregon

2006 Full-scale RA • Solid pilot-test data showing rapid, complete dechlorination of solvents supported fullscale in situ remedial action • Full-scale conducted from June-Sept 2006 to remediate source area (122 m x 91 m x 6 m) using 31 Injection/extraction wells • 150 -lpm ISD system, touch-screen and flexible PLC system • 12 -18 month estimated timeframe to reduce CAHs by 90%, achieved goal in 6 months

Full-scale system has 11 EWs and 20 IWs. To date, most data has been collected from EW-3, 6, 7, and 10. Samples collected from EW-7 shows source zone concentrations. 11

Over 3 months: Recirculated over >8. 7 million liters in 3 months Introduced 3, 720 kg substrate 1 -visit/week Minimal down time Minimal Fouling Some LNAPL (diesel and Bunker C)
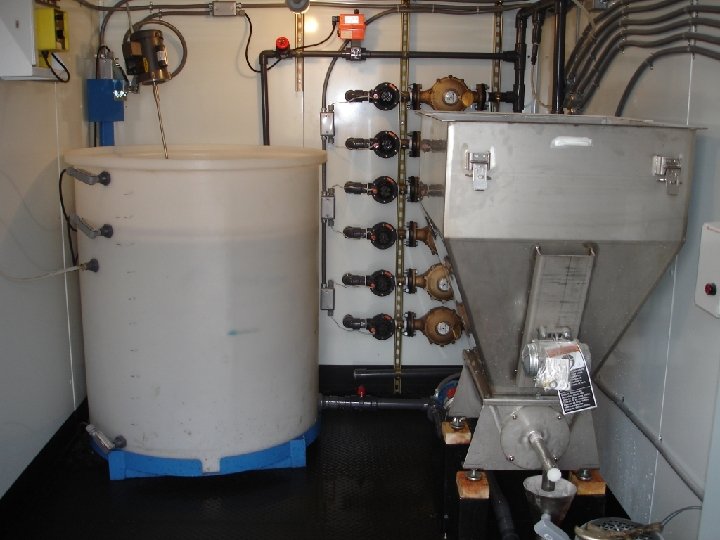

Touch Screen PLC: Alarm Conditions, Troubleshooting Flexible injection times Autodialer/Telemetry

2006 Results – Cis-DCE increased significantly, then began to decline. A max concentration of 500 ppb PCE should generate 291 ppb of cis-DCE, but we see up to 1, 300 ppb.

16

2006 Results

18
 cis-DCE (ppb) VC (ppb) Ethene/ethane (ppb) 8/22/06 Day 48 6,")
EX-7 Date TCE (ppb) cis-DCE (ppb) VC (ppb) Ethene/ethane (ppb) 8/22/06 Day 48 6, 700 4, 400 10, 000 <200 50 9/26/06 Day 83 330 <100 3, 500 1, 100 763 12/6/06 Day 154 l PCE (ppb) 220 55 160 22 5. 1 Observations – First sample event shows significant concentrations of PCE/TCE even after 48 days of recirculation, with dechlorination to cis-DCE ongoing during this time. – No significant VC after 48 days, and ethene still low. – VC increased significantly, but nothing compared to the parent concentrations – Generated biomass expected to continue to stimulate dechlorination for another year

Chlorinated Ethanes

Full-scale Comments • Approach rapidly transforms ppm levels SITE-WIDE! • Enhanced desorption observed during recirculation • No downgradient change in c. VOC concentrations; hydraulic capture successful! • LNAPL did not prevent implementation • Nutrient demand (N and P) higher than calculated • Results very similar to pilot-test. Shut-down Sept. 2006, TOC low at all locations, now biomass acting as substrate over the next several months/years. No cost associated with this, except analytical/sampling labor. • Chlorinated Ethanes treated site-wide • Overall Costs ~$270 K, treatment area 68, 000 CM: $4/CM

CONCLUSIONS • • • Soluble substrate + nutrients + recirculation + infrastructure = rapid dechlorination Works w/ varying conditions (low/high flow, ppm or ppb, co-mingled or not) Control subsurface conditions/microbial needs (NOT ABOUT THE BUGS) Total Mass of Solvents is Higher, Desorption is crucial to achieve low level remedial goals Nutrient Concerns (rapid uptake), higher than theoretical Limited Biofouling (pressure inj. , pulsed delivery) Site Characterization & Infrastructure are CRITICAL! Nitrate/phosphate, some metals (hex chrome), perchlorate, 1, 4 dioxane, treatment possible with this approach Cost Range is cheaper than excavation/disposal ($2 -8/CM) Time comparison is like no other biological approach, kinetics much higher 22
48c24d06b31a54ad1d95836294275e69.ppt