ba3ff5a7181aa5a52713f8464cfad4f3.ppt
- Количество слайдов: 142


Raising Fiscally Responsible Replacements! Winter Dairy Management ‘ 08 January 21 – Richfield Springs January 22 – Saratoga Springs January 23 – Randolph Ctr. , VT January 24 – Chazy January 25 – Carthage January 28 – Geneva January 29 – Batavia January 30 – Pike January 31 – Randolph, NY February 1 -- Cortland

To: For the “loan” of: Jenny Mills Dr. Bill Stone & Dr. Doug Waterman This project could not have been pulled off without their help and all of the folks below: Site Managers Dave Balbian Cathy Wickswat Colleen Leonard, UVM Blake Putnam Frans Vokey Ron Kuck Jerry Bertoldo Maureen Zorn Rebecca Ireland-Perry Lisa Kempisty Joan Petzen John Conway Development Team Dr. Mike Van Amburgh Jenny Mills Dr. Julie Smith, UVM Dr. Jerry Bertoldo Jason Karszes Cathy Wickswat Curt Gooch Frans Vokey Dave Balbian Ron Kuck John Conway

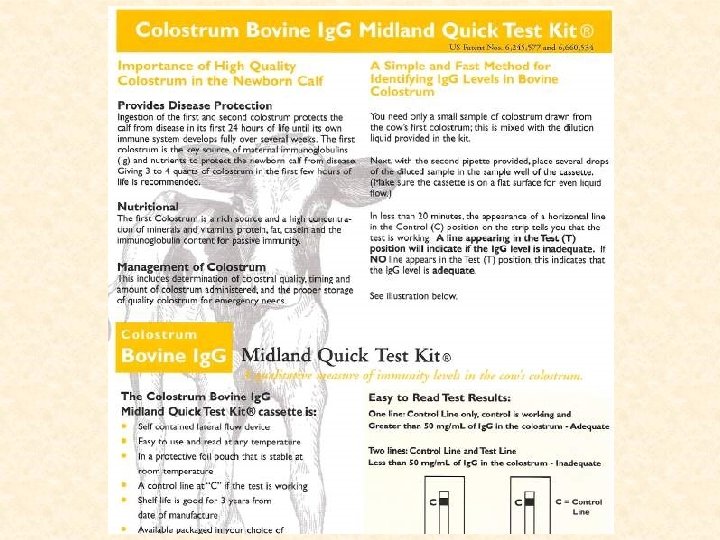
Special thanks to the folks at Midland Bio. Products for upplying both the Colostrum and Ig. G (used on Case Farms, see back) Quick Test Kits!


Take advantage of what’s bred into them with: Targeted Heifer Growth An easy-to-use guide where you determine age at first fresheni To get Power. Point File for printing additional graph pages go to: http: //www. ansci. cornell. edu/prodairy/heiftarget

Practical Application of Targeted Heifer Growth for Optimal Financial Returns: Mature Weight Estimator (use multiplication factors below) Get mature weights or adjusted mature weights (see chart) for all cows in 1 st Calf 1. 18 herd Based on dam’s mature weight, separate heifers into small, medium or large 2 nd Calf 1. 09 3 rd Calf 1. 04 predicted mature weight; fewer categories if cow-to-cow variation is less Choose a target mature size for small, medium and large mature size heifers Choose an age in months at freshening target either for all sizes or per size based on your farm specific environment constraints Consult with Feed Rep and run diets taking into account size, average daily gain targets and accurate environmental description. Feeding a separate energy grain from protein grain allows maximum flexibility. Of course, all forages fed need to be Adjusting Mature Cow Weights for Body Condition BCS 900 – 1200 Lb. Cows 1300 – 1500 Lb. Cows 1600 – 1900 Lb. Cows 2. 5 +150 +200 +250 3. 0 +75 +100 +125 3. 5 - - - 4. 0 -75 -100 -125 4. 5 -150 -200 -250

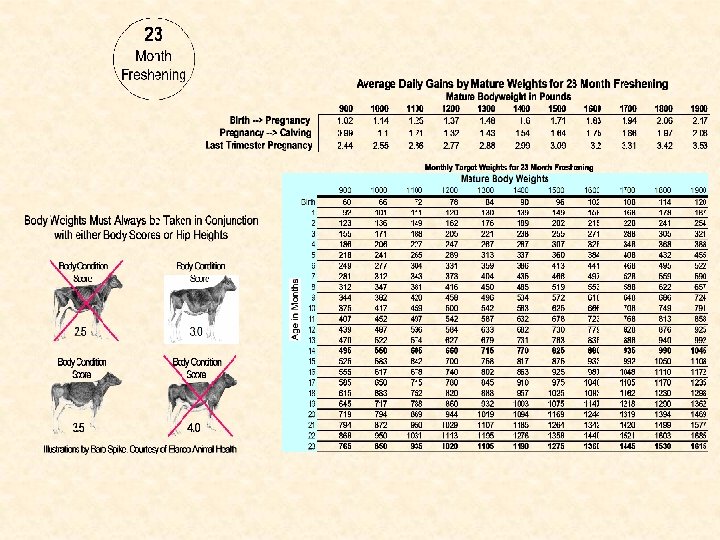

To get Power. Point File for printing additional graph pages go to: http: //www. ansci. cornell. edu/prodairy/heiftarget


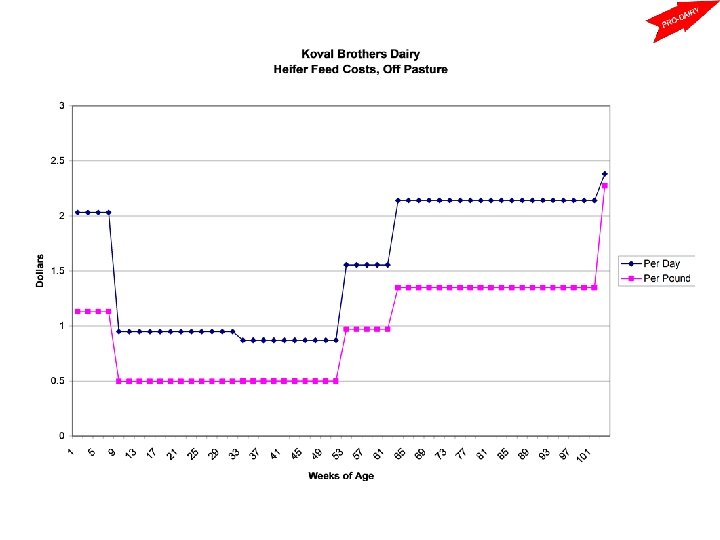
Dykeman & Sons, Fultonville, NY Reyncrest Dairy The Reynolds Family, Corfu, NY Dan and Sharon Rossiter, Belleville, NY Koval Brothers Dairy, Stillwater, NY
 Dykeman Case Farm")
Heifer Management Evaluation Snapshot – Two Components Biological Advantage Scorecard (BAS) Dykeman Case Farm Factors Affecting Ability to Generate Profit & First Lactation Milk Passive Immunity Achievement Optimize Pre. Weaning Gains Nail Biological Growth Targets Blood Ig. G >10 mg/ml or Blood serum protein >5. 5 g/dl (at 48 hours of life) Double birth weight In 56 days 55% mature weight @ breeding 82 - 85% mature weight @ 1 st calving ≥ 85% achieving (95% is achievable) (86%* Dykeman) ≥ 90% achieving 1. 85 x (avg. ) 14%* (Dykeman) *2 calves receiving colostrum replacement did not achieve *Currently battling E Coli strain ≥ 90% achieving *Breeding: Avg. 56% MW (69% Achieving) *Calving: Avg. 78% MW (14% Achieving) (Dykeman) What Makes a “Quality Heifer” -- (Dykeman) Maintaining Management Momentum 1 st Calf “Treated” as Calf/Heifer* ≤ 30% ? 24 hrs. 3 mos. ____ 4 mos. fresh ____ DOAs in first calf heifers ≤ 9% 19% Male DOAs 19% Female DOAs 19% 1 st Calf avg. peak ≥ 80% of Mature 71% or total lactation ≥ 80% of Mature 80% 1 st Calf Culls ≤ 60 Days in Milk ≤ 5% 5% 1 st Calf ME’s ≥ Mature < (-595) 1 st Calf “Treated” in Lactation* ≤ 15% ? ≥ 85% retention (any herd) to 2 nd lactation 90% Reduce #1 reason for 1 st lactation culls (continuous improvement) Repro Replacement Generation Capacity (RGC)* Longer Term – Factors Affecting Asset Growth (IHG) Herd Birth Rate % Heifers Born % Heifers DOA (≤ 24 hrs. ) Annualized Heifer Cull Rate Age at First Calving (Months) (Freshening events as % avg. cow nos. ) (Female births divided by all births) (Female births DOA divided by all births) (Heifers died/culled divided by avg. # heifers) (Age and standard deviation) ≥ 108%* ≥ 46 – 47% (55 – 60% sexed semen) (46% Dykeman) ≤ 5% (5% Dykeman) ≤ 3%* 23 ± 2. 5 mos. SD (& *distorted during expansion (115% Dykeman) *distorted during Expansion 24 hrs. 3 mos. ____ 4 mos. fresh ____ (2% Dykeman) *Adapted from Farm Credit’s Business Consultants’ Heifer Management Index 82 – 85% Mature Wt. ) (23 ± 2. 1 Dykeman)

REPLACEMENT PROGRAM, Importance to the Dairy Jason Karszes Farm Management Specialist PRO-DAIRY Cornell University Cathy Wickswat Farm Management/Dairy Extension Educator Cornell Cooperative Extension Rensselaer County

Goal of The Replacement Program The primary goal of all heifer programs is to raise the highest quality heifer who will maximize profits once she enters the lactating herd. A quality heifer is one carrying no limitations into the dairy herd that would hinder her ability to produce under the farm’s management system. Profits are maximized by obtaining the quality heifer at the lowest possible cost.

Impact of The Replacement Enterprise The bottom line of a dairy is impacted by: • Costs – Direct – In-direct • Number of animals being raised • Quality of the animals

Relationship with the Dairy • Total cost to raise heifer • Number of heifers being raised – Age of first calving • Investment in replacement enterprise • Quality of heifer enterprise • Number of animals needed by dairy – Cull rate

What is the Impact? • How does the replacement enterprise impact the dairy business performance? • Setting the base – Treat heifer enterprise as a separate business – Set budget for dairy to buy heifers – Current performance – Map changes in performance

Base Scenario • 300 cow dairy • Stable herd size • 36% cull rate, last 5 years • Budgeted expense per heifer = $2, 200 • Sell calves for $600 • Cost/day, raising costs (cash), per heifer = $1. 70 • Age of first calving = 27 months • Capital invest. / heifer = $700 • % heifers cull rate per year = 7%

Replacement Enterprise - Base • Number of heifers needed to maintain herd size = 264 • Total cost per day per heifer completing system = $2. 28(cash cost + depreciation + non-performance expense) • Total cost of animal = $1, 874(no beginning value or interest on investment) • • Net enterprise income = -$17, 359 Total investment in enterprise = $590, 100 % return on total investment = -2. 94% Overall dairy business % return = 6. 8% Enterprise Impact

Changes that Can Be Made • • • Lower raising costs Decrease calving age Decrease number needed – dairy cull rate Decrease replacement cull rate Improve quality of animal Do them all

Summary Table – Replacement Only Enterprise Impact Calculator Net Enterprise Income Total Investment Return on Investment Number Raised Base -$17, 359 $590, 100 -2. 94% 264 Cost -$7, 730 $578, 068 -1. 34% 264 Age $2, 198 $476, 397 0. 46% 225 Dairy Cull% -$14, 466 $491, 750 -2. 94% 220 Heifer Cull% -$6, 051 $550, 335 -1. 10% 254 Premium Paid -$14, 743 $600, 328 -2. 46% 264 Combined $22, 958 $365, 799 6. 28% 179 Comb w int. inv. $18, 065 $429, 819 4. 20% 179 $28, 032 $499, 767 5. 61% 233 Comb sell excess

Enterprise Impact Calculator Summary Table – Overall Business Net Farm Income Total Investment Return on Investment Number Raised Base $180, 930 $2, 690, 100 6. 80% 264 Cost $190, 558 $2, 678, 068 7. 19% 264 Age $200, 487 $2, 576, 397 7. 86% 225 Dairy Cull% $204, 823 $2, 591, 750 7. 98% 220 Heifer Cull% $192, 238 $2, 650, 335 7. 33% 254 Premium Paid $183, 546 $2, 700, 328 6. 87% 264 Combined $242, 278 $2, 465, 799 9. 91% 179 Comb w int. inv. $237, 354 $2, 529, 819 9. 46% 179 Comb sell excess $249, 321 $2, 529, 819 9. 59% 233

What is The Cost? • • They are free? Just purchased feed? Just hired labor? The sum of: – – All inputs, cash and non-cash Fixed costs associated with capital investments Opportunity cost of capital Charges for animals not completing replacement program.

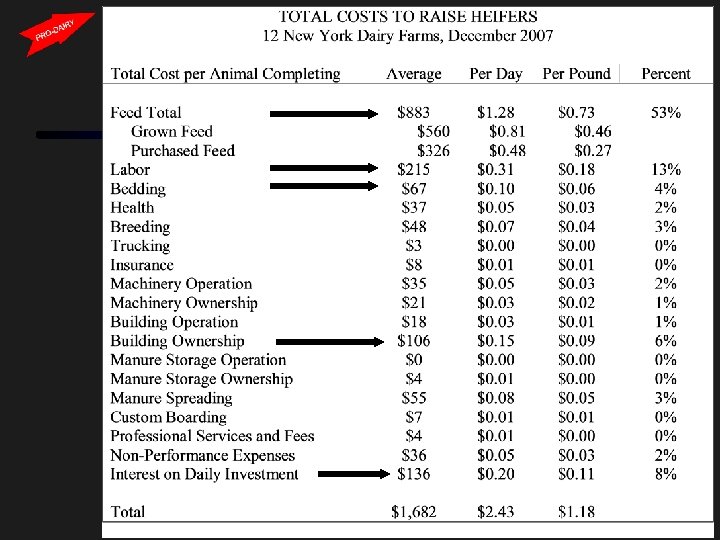
Reported Costs to Raise Dairy Replacements • Michigan 1973 1980 1986 $617 $1, 085 $1, 177 • Wisconsin 1982 1987 1998 2000 $1, 549 $1, 326 $1, 099 $1, 360 • Washington 1992 $1, 242 • Pennsylvania 1998 $1, 088 1985 $925 Low $1, 271 Medium $1, 597 High • Idaho 1992 $1, 159 • New York 1990 1993 2007 -8 $1, 265 $1, 150 $1, 429 $1, 682

What is The Cost? • Hard to know what the “Average” is. • Few farms treat the replacement enterprise as a separate business and know their actual costs. • Can use various tools to estimate what costs may be for different areas of the system.

The Big Two • Feed – Is enough grown? – Proper quality? – How much purchased? – How much does it cost? – Where is the manure going?

The Big Two • Labor – Is it doing a good job? – How much is it costing? – Does it have the right tools? – How efficient/inefficient is the set-up? • Size of barns • Hand labor • Location/design of facilities – “Free” barns may cost too much!

The Big Two • Feed and Labor – 60%-70% of the total costs to raise heifers – Are they being used efficiently? – Is a quality heifer being produced?

Number of Heifers • • How many total heifers are being raised? How many are needed to maintain herd size? How many are needed to offset heifer cull rate? Investment level – – How much barn space? How much equipment? Dollar value of heifers Net Income is divided by investment to determine profitability

Number of Heifers • Two - 200 cow dairies • One has 130 total heifers in system? • One has 180 total heifers in system? • Who has less barns, equipment, bunks, etc?

Age of First Calving • Number of heifers needed • Production life • Investment level

Number of Heifers Needed

Quality of the Replacement • Growth vs. milk • Calving problems – Too heavy (fat) – Too light (frame) • General condition of the animal – Mastitis – Feet and legs – Injury • Prior treatment(s)

Summary • Quality heifers should be the first focus. • Need to look at all costs to raise heifers. • Impact on the dairy business performance is more than the cost to raise a heifer. • Number of heifers being raised, number of animals needed by the dairy to maintain herd size, and quality of heifer play significant role.

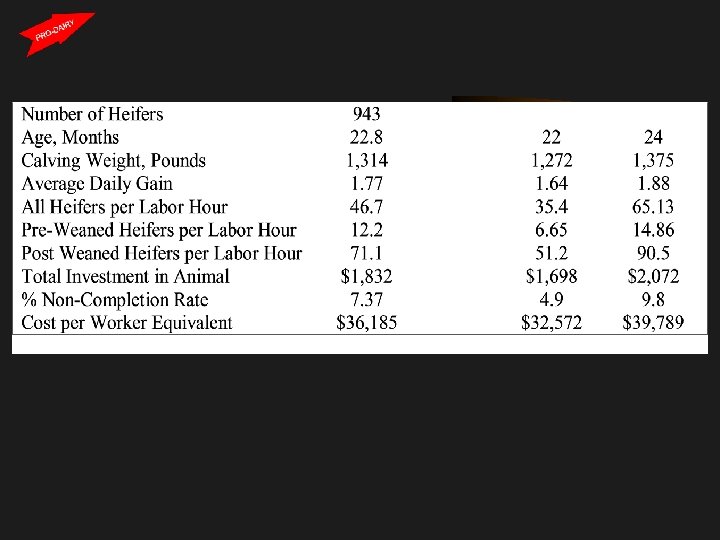
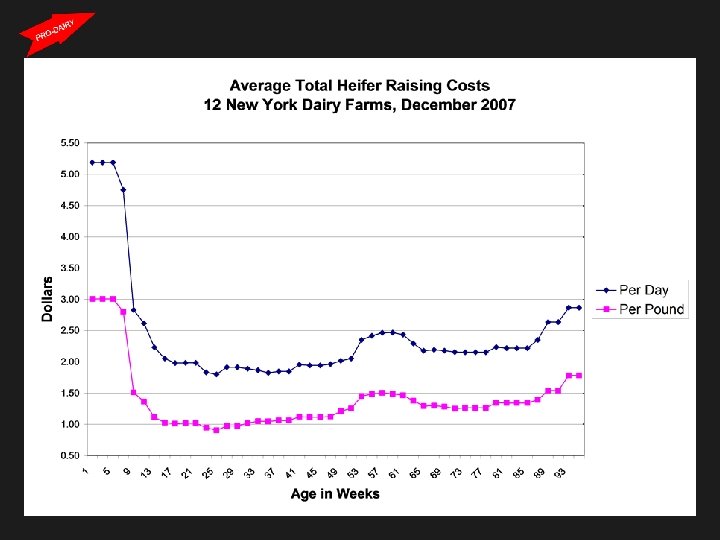
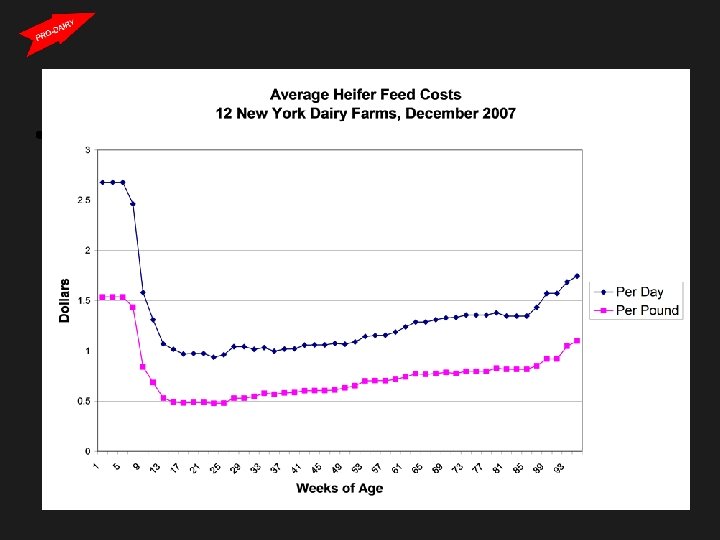
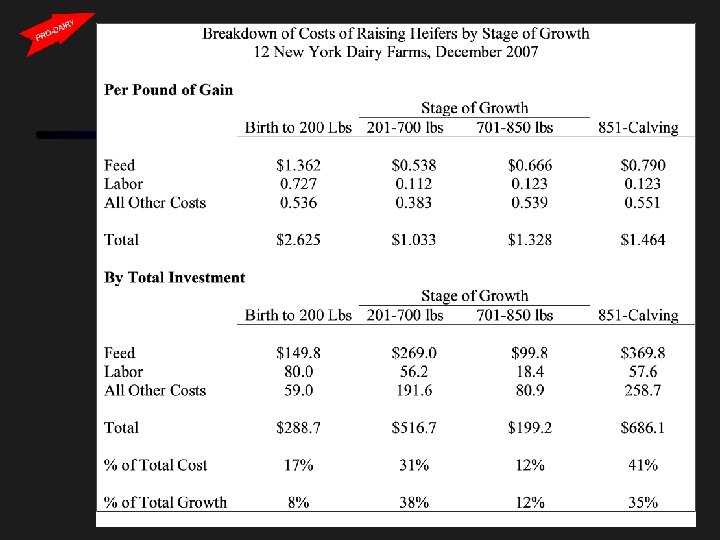
Costs to Raise Dairy Replacements • 12 Farms completed in time for meetings • 5 additional farms being summarized • Final report will be available on the website with other materials from this program • Snapshot of how much spent to raise heifers last 3 months of 2007 • Used to estimate total spent in raising the replacement over the 23 months.

Questions

Koval Brothers Dairy, Stillwater, NY Adam 300 Cows 235 Heifers Chris

Pre-Breeding Heifers Baby Calves Housed in Well-bedded Individual Pens in Adapted Older Cow Barn (on right). Im winter, Pre-Breeding Heifers are in separate lean-to section (at left).

High Quality Colostrum -- huge priority! - sound dry program - fresh cows milked ASAP - cleanliness paramount - colostrometer tested, must meet standard - fresh only, discard before microbial growth Ne g” Calf “Ju wborn

Baby Calf Pen High Quality Milk Replacer - solids quantity adjusted for weather - bucket/bottle cleaning protocols in place to keep them dry and functionally “sterile” Clean Water, High Quality Grain “Walk-through” observation protocol Wean at 7 weeks Overly Comfortable Cat

Electronic Scale with Double Gate Cage for Weighing Calves

Hutches are backup to individual calf pen overflow.

“Pre-Transition” area of calf barn during times of overflow

Transition Barn Built in 2005 Approx. Day 50 7 or 8 months (600 day on 1/8/08!)

End View – 6 pens of increasingly larger calves

Clean & Comfortable – Sand Bedding in Summer

All Six Pens get 75% Haylage/25% Corn Silage Mix plus 3. 5 lbs. grain. Some good quality hay to the smallest calves in pens 1 & 2.

Simple, effective curtain system.

Approximately 8 - 10½ months “Winter Quarters” Pre-Breeding Group Summer on Pasture; Supplemented as Needed

75% Haylage/25% Corn Silage Mix plus 2 lbs. grain.

Open to South, Cold Housing, Protected from Wind/Draft Most of the Time

“Airy”, Clean Bedded Pack for Breeding Heifer Group

Outdoor Headlocks for Breeding Age Heifers from Laneway at Left and for Bred Heifers from Laneway on Right. Both Groups Prefer to be out “Ramming Around”. 75% Haylage/25% Corn Silage plus 1 Lb. Grain

Short-bred Heifers on Pasture in Season

“Close-up” Heifers on Bedded Pack Behind Bred Heifers… …Across from Cow Barn, Easy to Observe

Bedded Pack “Around the Corner”

Sun’s out, plenty of feed, room to ram, clean and dry place to lie… Life is Good!

Questions

Koval

Koval

Koval

Questions

Calf Nutrition and Management: Colostrum, Nutrition and Long Term Performance – It’s all about getting more milk, believe it or not! Mike Van Amburgh, Jenny Mills, Douglas Waterman, Bill Stone

Overview Ø Introduction Ø Colostrum management Ø Nutrient status and immune function Ø Early neonatal events and milk yield ØColostrum ØEnergy and protein intake ØMammary development Ø Summary

Passive Transfer Target for Newborn Calf Health • Want to target 10 mg/ml Ig. G in calf serum following colostrum ingestion • Calves with levels less than 10 mg/ml have “Failure of Passive Transfer” (FPT)

Failure of Passive Transfer Reduces Long Term Performance • Calves with FPT: - Delayed time to first calving (Can Vet J. , 1986, 50: 314) – Decreased average daily gain to 180 days (J. Dairy Sci. , 1988, 71: 1283) – Decreased milk and fat production at first lactation (J. Dairy Sci. , 1989, 72: 552) – for each unit of serum Ig. G > 12 mg/ml there was a 18 lb increase in ME milk

Calf Program Goals: 1. Double birth weight by 56 days 90 lb birth weight 180 lb @56 days 2. Calf mortality less than 5% 3. Calf morbidity (treatments) less than 10% Why do this? • Achieve breeding weight at an earlier age • Potentially reduce AFC/increase BW@calving • Increase potential for Internal Herd Growth • Potentially increase milk yield • Potentially increase herd life

Nutrient Requirements and Compensatory Growth • Many producers believe that calves can “compensate” from early life nutrient restrictions • Most neonates, including pre-weaned calves do not have compensatory gain mechanisms – Effects of early life nutrient restriction are difficult to overcome (immune system and normal growth)
 and Refeeding (normal intake) During")
Effect of Malnutrition (50% normal intake for three weeks) and Refeeding (normal intake) During Different Stages of Life on Bodyweight 0% -15% -21% -51% -30% -47% (Burrin, et al. Cornell Nutrition Conference Proceedings, 2001)

Nutrient Requirements • In the last 10 years we have made remarkable progress in understanding the nutrient requirements of calves and heifers (body composition data on over 400 calves and heifers from Cornell, Univ. of Illinois and Virginia Tech) • Further we have learned how to manipulate the composition of gain through diet design

Environmental and Stress Effects on Maintenance Requirements The thermoneutral zone for young (< 21 days of age) lightweight calves is 59 to 82°F In New York, we spend at least 160 days/year below the lower critical temperature. For calves > 21 days of age the lower critical temperature is 42 °F.

Amount of Milk Replacer/Milk Dry Matter Required to Meet Maintenance Requirements Temperature, °F 68 50 32 15 5 -5 -20 Bodyweight, lb 60 0. 6 0. 8 0. 9 1. 0 1. 1 1. 2 1. 4 80 0. 8 0. 9 1. 1 1. 3 1. 4 1. 5 1. 7 100 1. 1 1. 3 1. 6 1. 7 1. 8 2. 0 120 1. 1 1. 3 1. 5 1. 7 1. 9 2. 0 2. 3

Amount of Milk Replacer/Milk Dry Matter Required to Meet Maintenance Requirements and Gain One Pound per Day Temperature 68 50 32 15 5 -5 -20 Bodyweight, lb 60 1. 1 1. 2 1. 4 1. 5 1. 6 1. 7 1. 8 80 1. 2 1. 4 1. 6 1. 7 1. 9 2. 0 2. 2 100 1. 4 1. 6 1. 8 2. 0 2. 2 2. 3 2. 5 120 1. 6 1. 8 2. 1 2. 2 2. 5 2. 6 2. 8

Environmental and Stress Effects on Maintenance Requirements Calves that are transported, experience significant alterations in temperature, social environment or dietary change experience stress. This is manifested by increased heat production and appears to last up to 14 days after the event Equal to 0. 25 lb DM/d in extra heat production

Updated Nutrient Requirements of a 100 lb Calf Under Thermoneutral Conditions Rate of MEa, DMI, gain, lb/d mcal/d lb/d ADP, CP, g/d CP, % DM g/d 0. 44 2. 35 1. 12 87 94 18. 0 0. 88 2. 89 1. 40 150 23. 4 1. 32 3. 48 1. 67 193 207 26. 6 1. 76 4. 13 1. 98 235 253 27. 5 2. 20 4. 80 2. 39 286 307 28. 7 Van Amburgh and Drackley, 2005

Effects of Neonatal Nutrition on Productivity and Mammary Development • Data are emerging that suggests early life nutrient intake has long term impacts on productivity • Data are not conclusive • Mechanism is not completely understood • Might be certain cells in the mammary gland or other tissues, immune system stimulation and maturation – or all of the above!

Summary of Published Data Study Response Bar-Peled et al. , 1998 + 998 lb Foldager and Krohn, 1994 3, 092 lb Foldager et al. , 1997 Mean response 1, 143 lb + 1, 744 lb These responses were achieved by increasing pre-weaning milk intake by at least 75% over conventional intake

Preliminary Data - Studies in Progress Study Response Miner Institute, Chazy, NY and Zenoh, Japan (JDS Abst. 2005) +1, 543 lb @ 200 DIM Again, responses were achieved by increasing milk replacer intake by at least 75% over conventional intakes
 Variable Age at calving (mo) Year 1")
First lactation milk yields (Univ of Illinois) Variable Age at calving (mo) Year 1 Year 2 Calving BW (kg) Year 1 Year 2 ME milk* (kg) Year 1 Year 2 Control Enhanced 25. 4 24. 0 26. 5 24. 4 1276 1278 1338 1217 20, 341 19, 351 23, 270 (2929) 20, 104 (753) * Treatment x year, P = 0. 15. Year P < 0. 05 for all. Pollard et al. , JDS abstr. 2007

Michigan State Study • Moderate feeding vs Intensified program • Followed heifers up to 150 DIM • Intensive fed heifers calved ~ 22 days earlier – Produced 1, 100 lb more milk in first lactation (Based on projected ME 305 milk) not significant • Concluded intensified feeding with earlier calving and milk difference was economically advantageous JDS 2006 Abstr 89: 438

Effects of feeding ad-lib milk vs ad-lib milk replacer with or without additional protein from 150 to 300 days of age • Milk replacer (23% CP: 12%Fat – containing soy protein) vs whole milk to weaning • From 150 to 300 days of age half of each group provided 2% additional protein (fish meal) • Basal diet was low in protein (< 14%) • Calves fed whole milk and supplemented with 2% added protein produced ~ 2, 500 to 3, 000 lb more milk in first lactation (P < 0. 007) (I had to interpret the graph… they didn’t provide any means so those are my estimates) JDS 2006 Abstr. 84: 32 (M 78)

Field Data from Land O’Lakes 23 herds summarized – five with lactation data

Field Data from Land O’Lakes Lactation Curves from Five Herds AFC: 26. 8 to 24. 3 = 2. 5 Month

The Cornell T&R Herd • We started feeding a “Intensified” milk replacer in 1998. • We have over 1000 weaning weights from this data • We have ~ 725 finished first lactations from this data • We wondered if any calf measurement had any relationship to first lactation milk yield

The Cornell T&R Herd • We analyzed the lactation data with the Test Day Model (TDM) – allows us to control for year, season, genetics and management variation over the period of measurements • Generated TDM residuals for lactation and then regressed the lactation data on all calf variables measurable

Traits Evaluated • • • Birth weight Weaning weight Average daily gain until weaning Hip height at birth Hip height at weaning Gain in hip height Wither height at birth Wither height at weaning Gain in hip height

What We Learned is Consistent with the Previous Data • • • Differences between years are highly significant Average daily gain to weaning is highly significant The top 2% of the gainers out produced the bottom 2% of the gainers by 1, 477 pounds of milk in their 1 st lactation as evaluated in the Test Day Model.

Cornell Herd - Effect of Pre. Weaning Daily Gain on Milk Yield • The range in growth rate in the data set was 0. 52 to 2. 67 lb per day to weaning • For every 1 lb of gain above 0. 5 lb per day, milk yield increased by 900 lb per lactation Therefore, an ADG of 2 lb/d versus 0. 5 lb/d prior to weaning is worth 1, 350 lb of milk in first lactation

Cornell Herd - Effect of Pre. Weaning Daily Gain on Milk Yield • The standard deviation in milk yield for first lactation is approximately 3000 lb • In this evaluation 20% of the variation in first lactation milk yield was explained by pre-weaning growth rate up to 42 - 49 days of age

Effects of Pre-Weaning Gain and other effects on Milk Yield • Year effects were worth 2, 118 lb of milk in the first lactation • We’re not sure what that means relative to pre-weaning growth rate • Possibly due to colostrum status (variation in dry cow vaccinations/heifer exposure) • Could also be nutrient intake relative to version of milk replacer fed, housing, (or fetal programming, previous generation effect (imprinting or epigenetics)) • Month was not significant

Cornell Herd - Effect of Pre. Weaning Daily Gain on Milk Yield • Hip height and hip height change also carried some positive effects on milk yield - probably correlated with the ADG effect

University of Illinois Data • Similar responses to Cornell herd • They had conventional versus “Intensified” milk replacer fed calves • Calves fed conventional diets (1 lb DM milk replacer per day) had a negative regression slope for preweaning ADG and first lactation milk yield whereas Intensified calves had a positive slope • Suggests the milk effect is in the first 3 to 5 wks of life

Brd. U labeled epithelial cells, % Epithelial Cell Proliferation 10 8 TRT: P = 0. 08 BW: P < 0. 01 TRT*BW: P = 0. 16 * 6 E R 4 2 0 220 330 440 550 660 770 Slaughter Weight, lb *Denotes treatment effect within slaughter weight. (P < 0. 05)

Conclusions • Nutrient intake prior to weaning has a positive influence on both milk yield and specific aspects of mammary development – The most likely mammary candidate – stem cells in the neonatal mammary gland. Less than 5% of the cells present – responsible for up to 50% of the proliferation in the early gland. Capuco, 2006 BOTTOME LINE: THERE IS MILK IN THIS FIRST 3 TO 5 WEEKS OF EARLY LIFE NUTRIENT INTAKE
 Lamb")
Efficiency of feed conversion with traditional calf feeding practices (Birth to 6 weeks) Lamb (. 71) Piglet (. 83) Calf (. 37) Calves can do this! Hammon et al. 2002 Calves can be here – functionally and economically (g/kg 0. 75) Adapted from Davis and Drackley, 1998
: Calves were fed milk replacer")
Pre-Weaning Feed Efficiency and Economics Data from Mills (2005): Calves were fed milk replacer to maintain growth rates close to 2. 2 lb per day – no dry feed Ambient temperatures were less than 20°F, barn temperature less than 40°F Feed efficiency was 0. 78 lb gain per lb feed intake. Milk replacer cost was ~$0. 90 per lb, thus the cost per lb of gain was $1. 15

Pre-Weaning Feed Efficiency and Economics • Feed efficiency is a function of colostrum status, health status, hygiene and energy intake above maintenance • Feed efficiency on most farms: 0. 29 – 0. 35 lb of gain per pound of feed. • Example: milk replacer @ $0. 80 per lb • Feed efficiency of 0. 30 lb gain per lb feed • Cost per lb of gain: $2. 67

Summary • Early life events have long term effects on calves • Decisions on nutrient status and requirements need to be more dynamic • We need to create tools that allow us to make integrated management decisions on a systems basis and not day to day – Example is economics of a feeding system

Feeding Program • 1. 5% BW DM intake day 2 to day 7 • 2% BW DM intake day 8 to day 35 or 42 • Offer starter from day 8 and clean fresh water • On day 43, reduce milk or milk replacer by 50% and feed once per day for 7 days • On day 51, remove all liquid feed • Calf should be consuming ~1. 5 lb starter per day over the week period

Feeding Program • Calves tend to prefer textured starters – pellets with corn/oats on the outside with a little molasses • For best growth results – starter should be 21 to 23% CP on a DM basis • NO dust, fines, mold • Sugar content – less than 8% - calf has a hard time buffering the rumen – watch molasses applications • Major criteria for starter – something they will readily consume • Minimize hay and forage intake prior to 8 wks of age

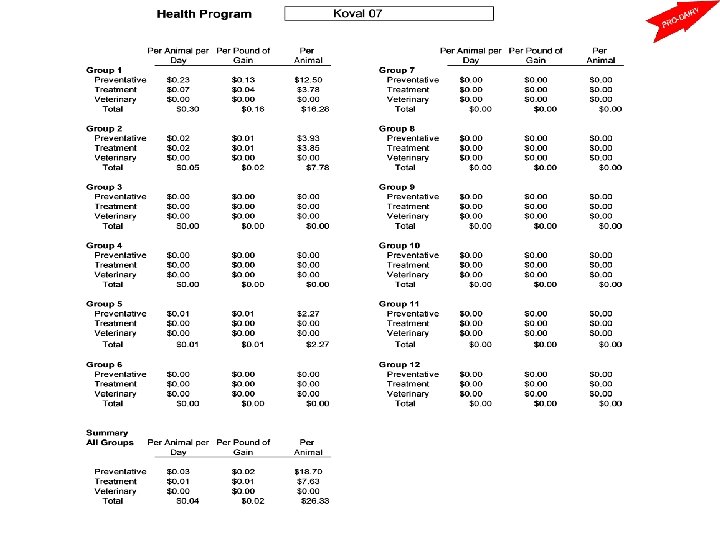
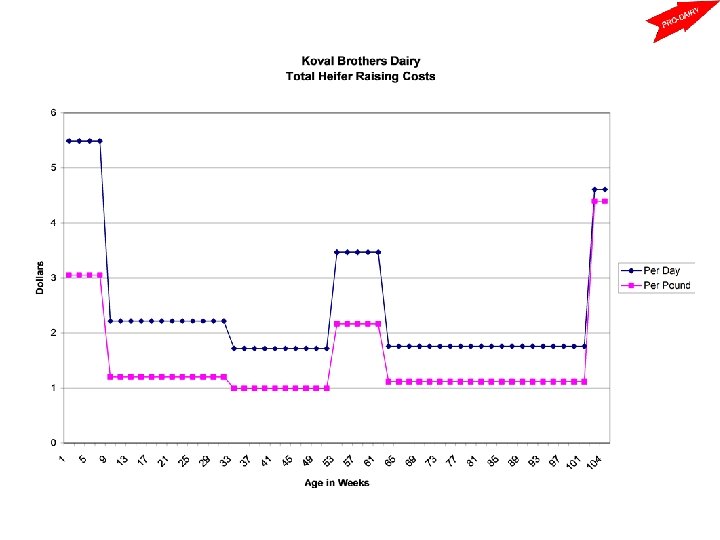
Koval Bros. Case Farm

Questions

Meeting Growth and Body Weight Targets for Post-Weaning Heifers Mike Van Amburgh Department of Animal Science Cornell University

What’s the Appropriate Endpoint for Growth Targets? • Have used ~ 1, 250 lb post partum as a “Rule of Thumb” • Should be a function of the herd mature body weight: Is a herd or region specific variable due to breeding and management decisions • “Unofficial” measured range in NY state for Holsteins: 1, 375 to 1, 800 lb
 Relationship Between Post Calving Body Weight and")
INCREASE IN 1 ST LACTATION MILK (lbs) Relationship Between Post Calving Body Weight and Improvement in First Lactation Milk Yield DHIA data base ~1975 - 1985 2000 1500 1000 500 Keown and Everett, 1986 0 900 1000 1100 1200 1300 1400 1500 BODY WEIGHT AT FIRST CALVING (lbs)

Post Weaning Heifer Management and Nutrition Need to be systematic – goals should reflect performance and management Age at first calving is a conscious management decision – should be made in early life - should be based on optimum performance under herd management conditions - younger is more profitable on a lifetime basis ~ Growth rate during pre-pubertal period should reflect AFC goals – nutrient requirements and supply should reflect those values
 publication updated")
New Approach - Target Growth Nutrient Requirements for Dairy Cattle (2001 NRC) publication updated growth model – new concept: Target growth rates – purpose was to integrate management factors such as age at first calving (age at pregnancy), post-calving BW and mature weight with nutrient requirements and supply Use mature body size of cows in a particular herd – scale nutrient requirements Assumption – requirements are not the same for all cows at a constant weight

Target Growth Rates – Integrates Management and Biology Approach determined by: Mature body weight (3 rd and greater parity cattle – not cull cows) Concept of physiologic maturity - puberty occurs at a given percentage of mature size (45% to 50%) Pregnancy should occur by 55% mature body weight Herd goals for age at first calving

Target Growth Rates – Integrates Management and Biology – Use of Mature Size • Based on the available data percent mature size where first lactation milk yield is optimized: 82 to 85% • Alters the “one size fits all” recommendation

Growth & Puberty Data Variable H L SE n Preweaning ADG, g 36 960 a 36 640 b 15 Postweaning ADG, g 929 a 657 b 7 9 7 - 8. 25 a 11. 7 b 0. 26 Number reaching puberty Age at puberty BW at puberty, kg 274 289 7. 4 a, b. Means with uncommon letters differ (p < 0. 05) Meyer et al. , 2004

Milk Yield Residuals Compared to Post Calving Body Weight as a Percent Mature Size Van Amburgh et al. , 1998

What if Mature Size is Not Known? (the pot belly trailer shows up with a couple loads and no data Optimum Body Size of Holsteins - from Pat Hoffman, 1996 Suggested a Minimum and Maximum Range based on literature values First calving 7 d post-partum weight Mature weight (calc. ) Minimum: 1, 182 lb 1, 442 lb 1, 500 lb Maximum: 1, 280 lb 1, 561 lb

Target weights Input AFC – sets breeding age for you and breeding weight is a function of the mature size. Requirements are then calculated to meet the targets.

Applying targets to the Cornell herd Cornell Dairy Herd Mature size ~ 1, 474 ± 120 lb Target AFC – 22 months Target post-calving BW (82% of mature weight ~ 1, 209 lb) Therefore the target pregnant weight is 55% of the mature size (811 lb) – breeding is initiated at 750 lb to achieve the target - independent of age

Pre-pubertal growth rate, AFC, BW at calving, days in milk and 3. 5% FCM yield of Holstein heifers fed a control diet or diet containing a FA supplement n Control Sunflower Ener. GII Ca. CLA oil 16 16 17 16 Std. Dev. Pre-pubertal ADG, lb 1. 90 1. 92 1. 96 1. 87 0. 15 AFC, mo 21. 8 21. 6 22. 3 1. 5 BW at calving, lb Days in milk 1, 227 299 1, 199 294 1, 241 294 1, 267 290 76 10 25, 538 25, 344 2, 450 Milk yield, 3. 5% FCM, lb 25, 057 24, 599

Post-hoc analysis of the management and production characteristics of Holstein heifers ranked by age at first calving, independent of dietary treatment Age at Calving < 21 22 -23 >23 Std. P Dev. n 19 27 19 Pre-pubertal ADG, lb AFC, mo 2. 16 20. 2 2. 03 21. 8 1. 96 24. 2 0. 09 0. 6 0. 05 0. 01 BW at calving, lb 1, 179 1, 219 1, 313 92 0. 01 298 299 285 14. 0 0. 7 Days in milk Milk yield, 3. 5% FCM, lb 24, 817 25, 484 24, 976 2, 405 0. 6 Smith and Van Amburgh, 2003

What is an Acceptable Standard Deviation for AFC Part of the variation is due to management: Heat Detection Rate and Conception Rate Good heat detection rates are > 70% but range from 60 to 80% Ranges in conception rate for heifers 50 to 74% Therefore ranges in pregnancy rate would be 30 to 58%

What is an Acceptable Standard Deviation for AFC - Management If you started breeding 100 heifers at 14 months: • At the lower end of HDR and CR, the AFC would be 26. 1 ± 2. 6 mo • At the higher end of HDR and CR the AFC would be 24. 3 ± 1. 7 mo

Koval Bros. Case Farm

On the next slide we are blowing up the portion of the graph lines for the Case Farm’s Breeding Age month (14) and Calving (23). All size lines are removed except for their “average” frame size heifer and “large” frame size heifer. (based on Dam’s known size) To get Power. Point File for printing additional graph pages go to: http: //www. ansci. cornell. edu/prodairy/heiftarget

1050 Lines for Heifers from Large Framed Dams Expected Mature Weight 1800 Lbs hs t on g M n 14 eedi Br (match up with individual heifers) 1600 1000 950 900 23 Months 1650 Fresh K O V A L 1550 1500 1450 1400 850 800 1350 Lines for Heifers from Medium Framed Dams Expected Mature Weight 1450 Lbs (match up with individual heifers) 1300 (1236)

Questions
ba3ff5a7181aa5a52713f8464cfad4f3.ppt