6136ad9d3899ded95082d90801746ff8.ppt
- Количество слайдов: 20


Radiosondes ATS 351 - May 5 th Balloon Launch

What is a Radiosonde? • A radiosonde is a balloon-based instrument platform with radio transmitting capabilities. • “radio” for the onboard radio transmitter • “sonde” from French, meaning sounding line • Contains instruments capable of making direct in-situ measurements of air temperature, humidity, and pressure as a function of height up to about 30 km • The device provides an indirect measure of wind speed and direction by recording time and position.

Purpose • To make accurate measurements of atmospheric parameters above the surface and send this information back in as close to real-time as possible • It is important to know weather aloft in order to forecast accurately

History • 18 th and 19 th centuries – A kite with a thermometer (began around 1749) • A few years later, Benjamin Franklin flew a kite near a thunderstorm to demonstrate the electrical nature of lightning – Manned hot air and hydrogen balloons in 1800’s – Kite observation network in U. S. by end of 1800’s • Early 1900’s – Meteorographs carried by free, unmanned balloons that could reach the stratosphere – Aircraft soundings from Army Air Corps in 1925 -1940’s – However, both methods could not provide real-time data
 in early 1930’s – 1937: U. S.")
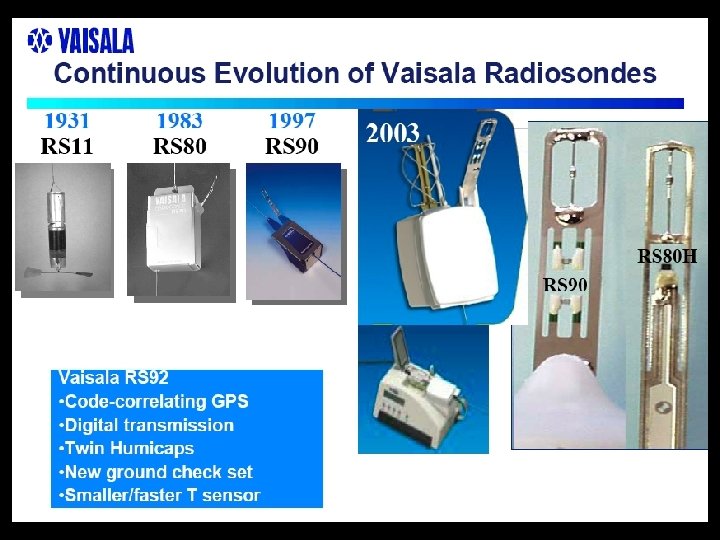
History • 1930’s-1950’s – First radio-meteorographs (“radiosondes”) in early 1930’s – 1937: U. S. NWS established radiosonde network (still exists today) – Automated radio-theodolites (“rawinsondes”) by the 1950’s (theodolite=positional triangulation device) • 1960’s-1980’s – Computerized reduction of rawinsonde data: almost fully automated by 1980’s • Processing time greatly reduced and data quality improved – Radio-navigation aids (NAVAID): LORAN and Omega for wind • 1990’s – Improved sensors, data processing and NAVAID system – GPS for wind measurements

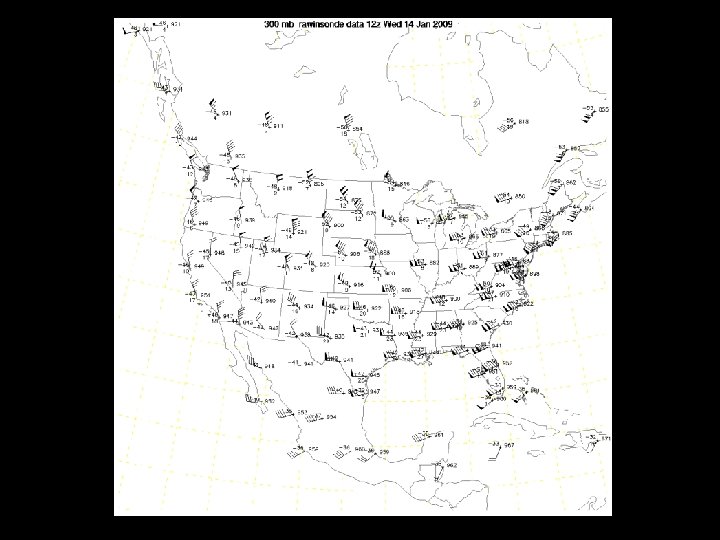
Radiosonde Network Weather balloons are launched world-wide. The US has a decent network of daily radiosonde launches but more would always be helpful forecasting and research. Each location generally launches twice a day in order to help with forecasting.

What Makes Up the Balloon System?

The Balloon • • The balloon is filled with helium to an amount specified by the mass of the balloon and the mass of the radiosonde so that it will achieve a certain rate of ascent. (~6 m s-1) It is attached to the radiosonde via a plastic hook/tether unwinder with cable ties. The balloon is about 5 feet in diameter at the time of launch. • Becomes 24 -32 feet before bursting Allows sonde to reach altitudes exceeding 25 miles (~10 mb).

What is a radiosonde? 1. 2. 3. 4. 5. 6. 7. 8. 9. Housing for Pressure Sensor and Transducer Electronics Temperature Sensor Humidity Sensors Sensor Boom Balloon Tether Mast GPS Receiver Interface Connection Port UHF Transmitter Battery Pack

What is Measured? • • Temperature Humidity/moisture Wind speed Pressure

The Temperature Sensor • Capacitance: property of storing an electrical charge between two separate conductors • The capacitance between the electrodes is dependent upon temperature.

Relative Humidity Sensors • Capacitance between electrodes is also dependent on relative humidity

Relative Humidity Sensors • Defrosting method with two heated sensors • Two sensors are heated alternately • While first sensor is measuring, the second is heated. After a recovery phase to ambient conditions the latter is measured.

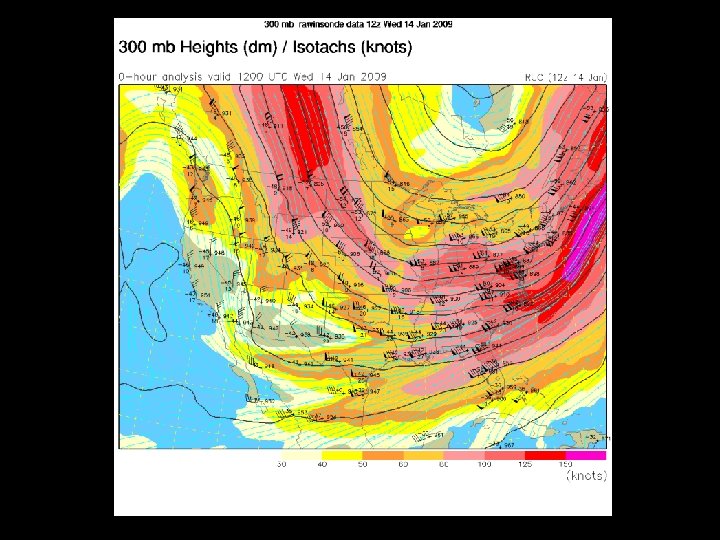
How the Data is Used • Most routine radiosonde launches occur at 0000 UTC and 1200 UTC to provide a snapshot of an instant in the atmosphere which is very useful forecasting • Input for weather prediction models • Input for air pollution models • Climate change research • Ground truth for satellite data • Research of weather phenomena like downdrafts, gravity and mountain waves, low-level jets, hurricanes, etc.

How the Data is Used • The pressure locations of the recorded data depend on the balloon’s rate of ascent. • Additionally, data are recorded at the standard pressure levels of 1000, 925, 850, 700, 500, 400, 300, 250, 200, 150, 100, 70, 50, 30, 20 and 10 mb. • The upper air data are routinely ingested by numerical models to be used in forecasting the weather.

Problems • Humidity readings – Measurements very high in atmosphere are not very accurate – In extreme dry environments, measurements from radiosonde are too dry – In relatively humid environments, the radiosonde is slow to respond to dry layers and therefore sounding is too wet

Problems • Both thermistor and hygrister are poorly vented and both are easily wetted, leading to a plethora of problems caused by the latent heat effects of condensation, evaporation, freezing, and sublimation • Often missing winds through significant layers • Other problems, again probably related to internal electronics, cause high to very high frequency noise leading sometimes to many "special" points - in both T and Td
6136ad9d3899ded95082d90801746ff8.ppt