

6782c0c107475cb62cb96672511a9233.ppt
- Количество слайдов: 104
 Racial Diversity in Texas
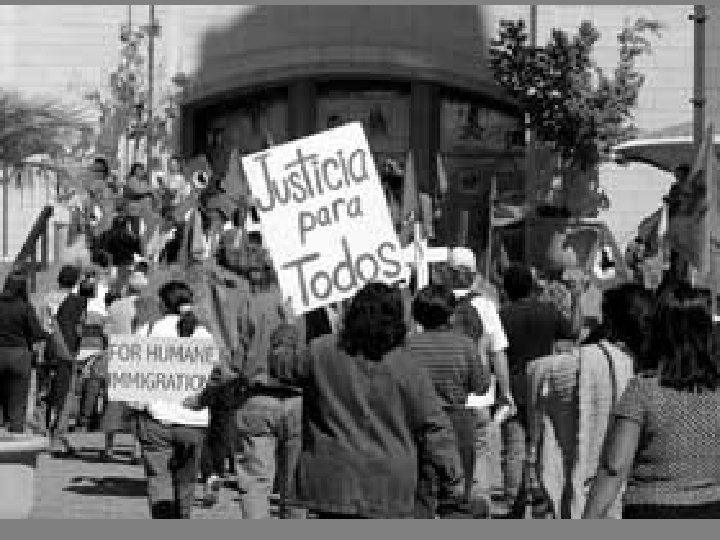
 The Immigration Reform and Control Act of 1986 offered amnesty to Hispanics living illegally in the U. S. before 1982.
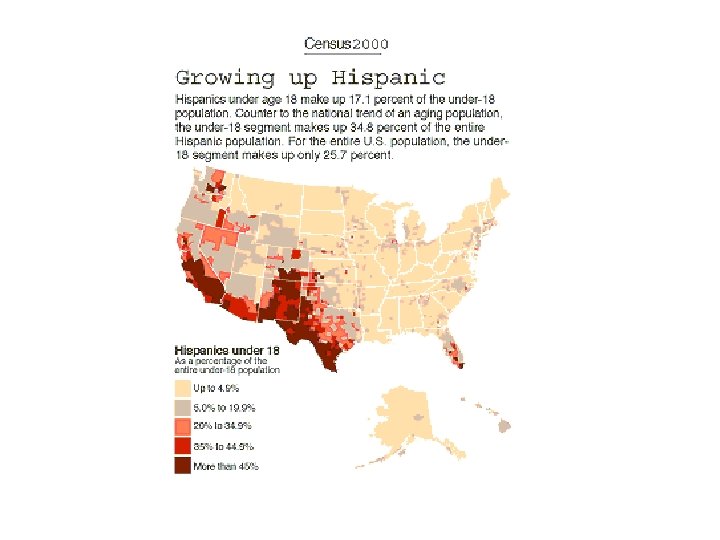
 The dominant characteristic of the transition in the population of Texas at the beginning of the twenty-first century is the increase in the number of Hispanics.
 Projected Proportion of Population by Race/Ethnicity in Texas, 2000 -2040* http: //txsdc. utsa. edu/presentations/ Demographers predicted that by the early twenty-first century, Anglos would comprise less than half of the Texas population.
 Demographers predicted that by the early twenty-first century, Anglos would comprise less than half of the Texas population.
 Runaway fear found at http: //www. alpinesurvival. com/
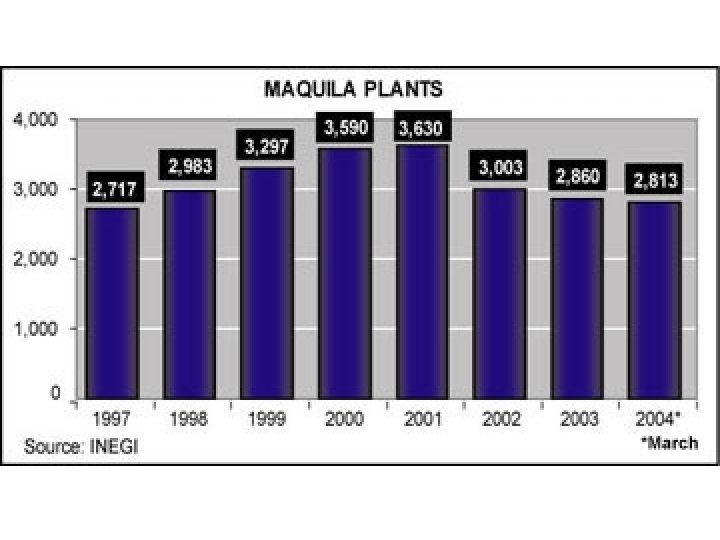
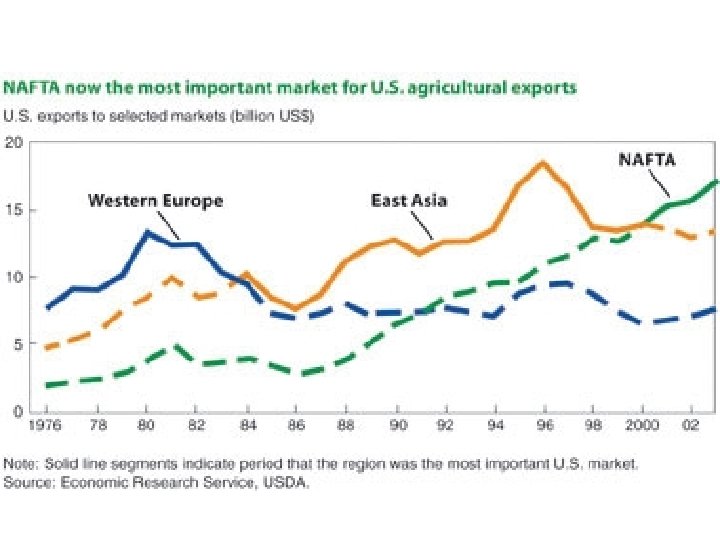
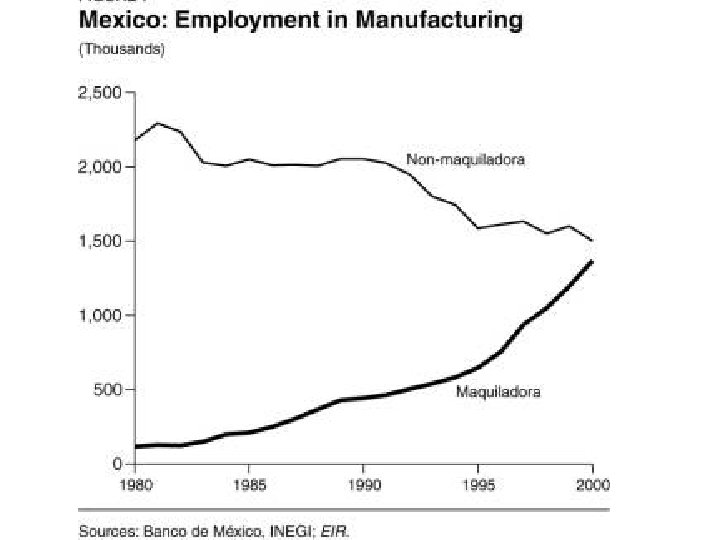
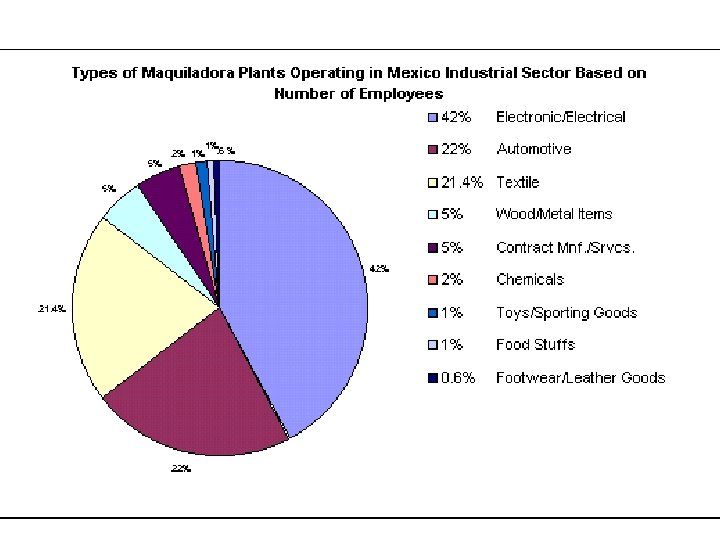
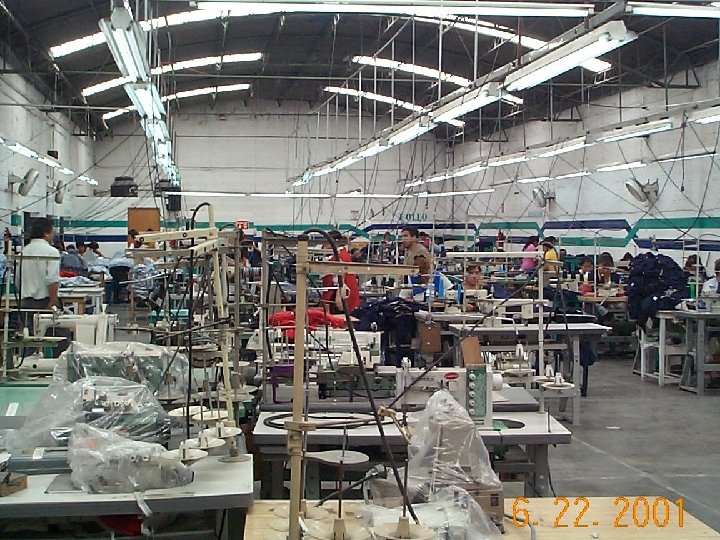
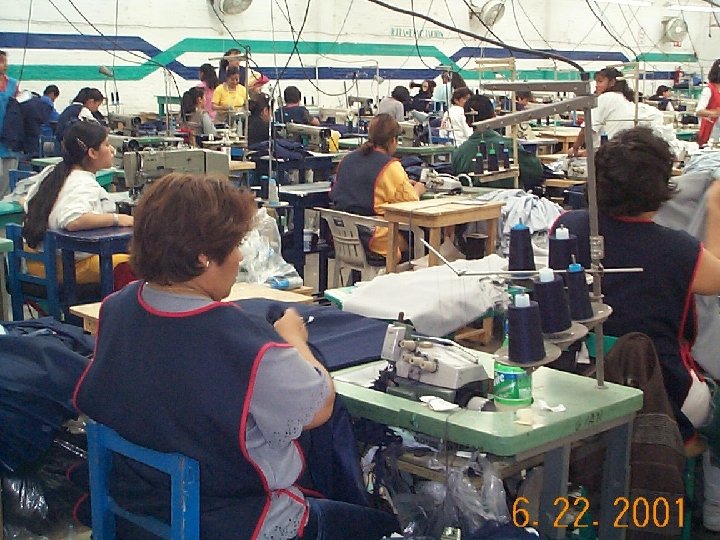
 NAFTA has clearly resulted in astronomical trade increases between the U. S. and Mexico. Since 1993, the value of two-way U. S. trade with Mexico almost tripled, reaching $232 billion in 2002, and continues to grow twice as fast as U. S. trade with the rest of the world. As the numbers increase, so do the opportunities for entrepreneurs.
 Texas has increased its exports to Canada and Mexico by over $10 billion since NAFTA started. The Department of Commerce claims that 19, 000 jobs are created for every $1 billion in added exports. Using that formula, NAFTA has created 190, 000 jobs in Texas. Other job estimates claim higher numbers. Nor. Am Energy (Houston), J. C. Penney (Dallas), Dave & Buster's Inc. (Dallas), and American Telesource International Inc. (San Antonio) are among those Texas companies that have benefited from NAFTA.
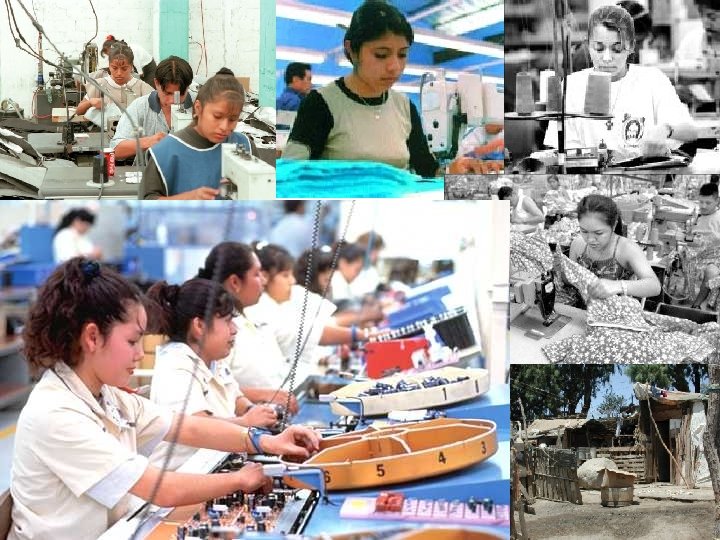
 Hilda, a factory worker, stands with her children in front of a typical tarpaper dwelling outside Ciudad Juarez near the U. S. border. Workers do not give last names for fear of losing their jobs. Source: www. anglicanjournal. com/127/05/
 A woman draws water from a well in a squatter community where she lives in Tijuana, Mexico. The vast majority of the people in this community work in assembly plants in a nearby industrial park and lack basic services such as running water, sewage, electricity and adequate roads.
 Toxic waste, Tijuana. Outside a closed battery recycling plant on Otay Mesa in Tijuana, Mexico, open pits of toxic waste pit the landscape, and chemicals leaching up from the ground form a crust on the ground. In the barrio of Chilpancingo, below the mesa, 19 children were born with no brains in 1993 and 1994, because of pollution from this and other maquiladoras on top of the mesa.
 Many of the poorest barrios in Cd. Juárez are shrouded in pollution. Their residents generally work at one of the maquiladoras, making at most the equivalent of around $5 a week.
 Population Change in Texas Counties, 1990 -2000 Source: Texas State Data Center http: //txsdc. utsa. edu/presentations/
 Population Change in Texas Counties, 2000 -2003 Source: Texas State Data Center http: //txsdc. utsa. edu/presentations/
 Population Change in Texas Counties, 2000 -2005 Source: Prepared from U. S. Bureau of the Census, 2005 County Estimates by Texas State Data Center, The University of Texas at San Antonio http: //txsdc. utsa. edu/presentations/
 While welfare rolls expanded, Texas ranked as one of the least generous states in all categories of public assistance.
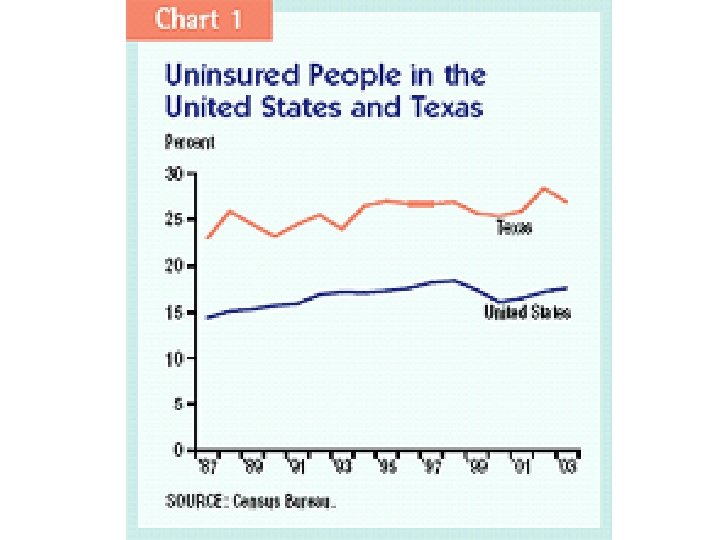
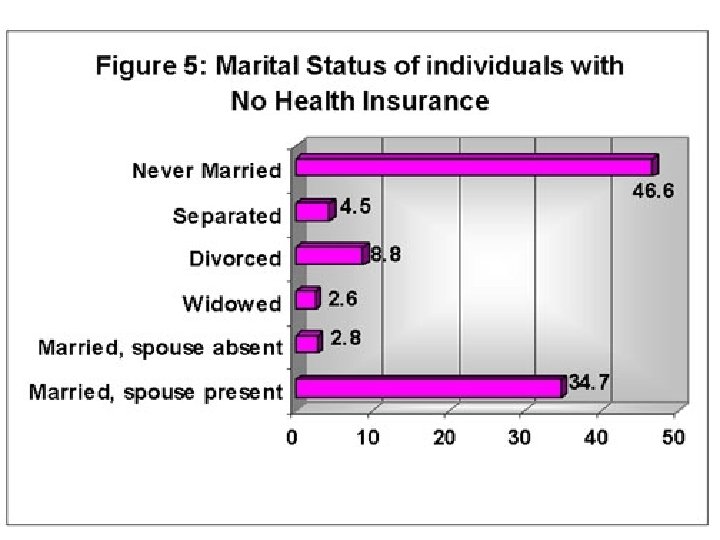
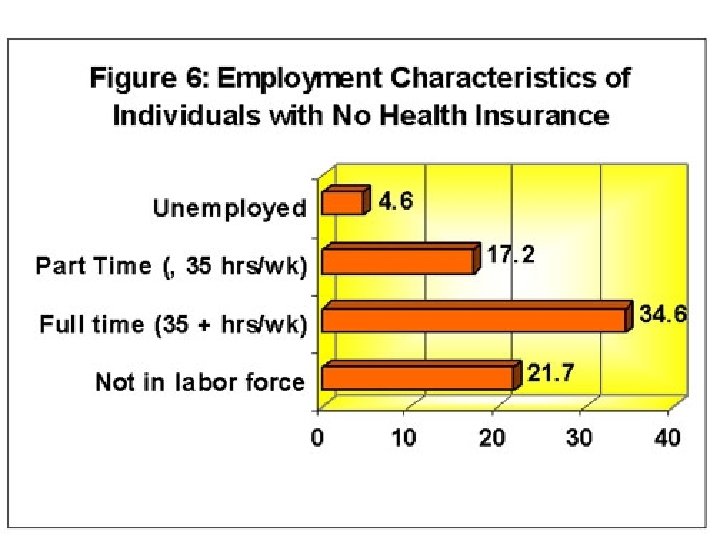
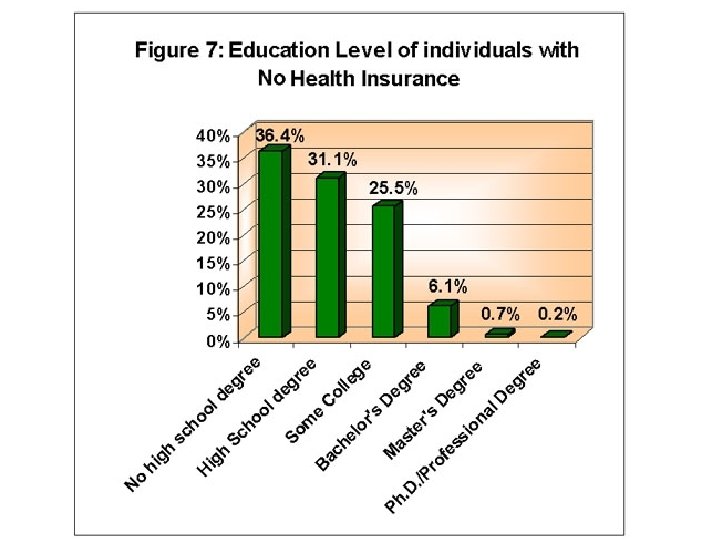
 “In 1993, Texas ranked fortysixth among the states in the amount spent on public welfare, forty-eighth in AFDC payments to children, fortyninth in aid to the mentally ill, and dead last in immunizations provided for children and the number of citizens with health insurance. ” “Clearly, though, the state’s overall approach to the problem of poverty has been consistent with the individualistic, limitedgovernment philosophy that so many Texans continue to hold dear. ” (See pages 425 -427. )
 Age trends in the Texas population in the twenty-first century: The percentages of the old will both increase.
 Median Age in the United States and Texas, 1900 -2000 http: //txsdc. utsa. edu/presentations/
 Percent of Texas Population by Age Group and Ethnicity, 2000 http: //txsdc. utsa. edu/presentations/
 Percent of Texas Population by Age Group and Ethnicity, 2040* http: //txsdc. utsa. edu/presentations/
 Median Household Income in 1999 in Texas by Age of Householder Thousands http: //txsdc. utsa. edu/presentations/
 Median Household Income In 1999 in Texas by Race/Ethnicity of Householder http: //txsdc. utsa. edu/presentations/
 Educational Attainment in 2000 in Texas for Persons 25+ Years of Age By Race/Ethnicity Percent http: //txsdc. utsa. edu/presentations/
 States Ranked by Median Household Income in 1999 http: //txsdc. utsa. edu/presentations/
 States Ranked by Per Capita Income in 1999 http: //txsdc. utsa. edu/presentations/
 States Ranked by Percent High School Graduates + in the Population 25 Years of Age or Older, 2000 http: //txsdc. utsa. edu/presentations/
 States Ranked by Percent College Graduates + in the Population 25 Years of Age or Older, 2004 Source: U. S. Census Bureau. Current Population Survey (CPS), 2004 Annual Social and Economic Supplement http: //txsdc. utsa. edu/presentations/
 The Texas Challenge in the Twenty-First Century: Implications of Population Change for the Future of Texas The Institute for Demographic and Socioeconomic by Steve H. Murdock Research The Institute for Demographic and Socioeconomic Research The University of Texas at San Antonio
 Ethnic Diversity of the Population, Householders, and Labor Force in Texas, 2000 and 2040* http: //txsdc. utsa. edu/presentations/
 Ethnic Diversity of the Population Enrolled in Elementary and Secondary Schools and Colleges in Texas, 2000 and 2040* http: //txsdc. utsa. edu/presentations/
 Ethnic Diversity of Household Income and Consumer Expenditures in Texas, 2000 and 2040* http: //txsdc. utsa. edu/presentations/
 State Tax Revenues in Texas Proportioned by Race/Ethnicity in 2000 and Projections to 2040* Assuming 2000 Decile Tax Rates *Projections are shown for the 1. 0 scenario http: //txsdc. utsa. edu/presentations/
 Projected Percent of Labor Force by Educational Attainment in Texas, 2000 and 2040 http: //txsdc. utsa. edu/presentations/
 http: //txsdc. utsa. edu/presentations/") Average Household Income in Texas, 2000 -2040* (in 2000 Dollars) http: //txsdc. utsa. edu/presentations/
Average Household Income in Texas, 2000 -2040* (in 2000 Dollars) http: //txsdc. utsa. edu/presentations/
 Projected Percent of Households in Poverty by Family Type in Texas, 2000 and 2040 http: //txsdc. utsa. edu/presentations/
 Average Annual Household Income in Texas and the United States by Educational Attainment of Householder in 2000* http: //txsdc. utsa. edu/presentations/
 Aggregate Income and Consumer Expenditures for Population 25 Years of Age or Older in Texas in 2000 and Projected Under Alternative Educational Attainment Assumptions for 2040* http: //txsdc. utsa. edu/presentations/
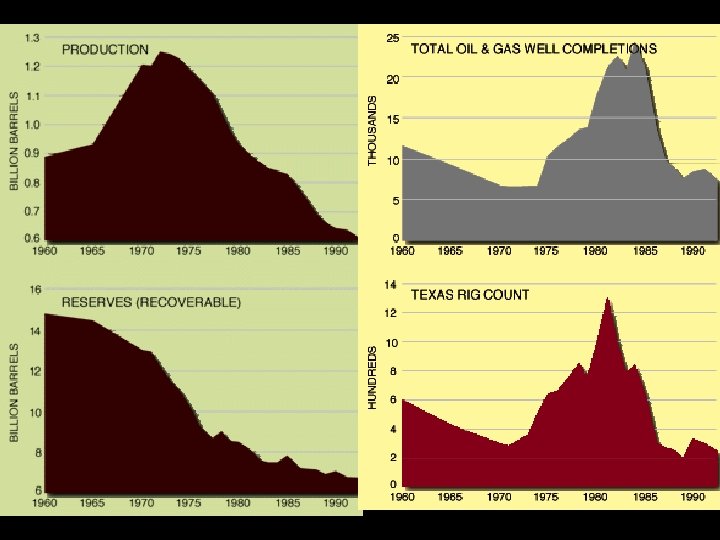
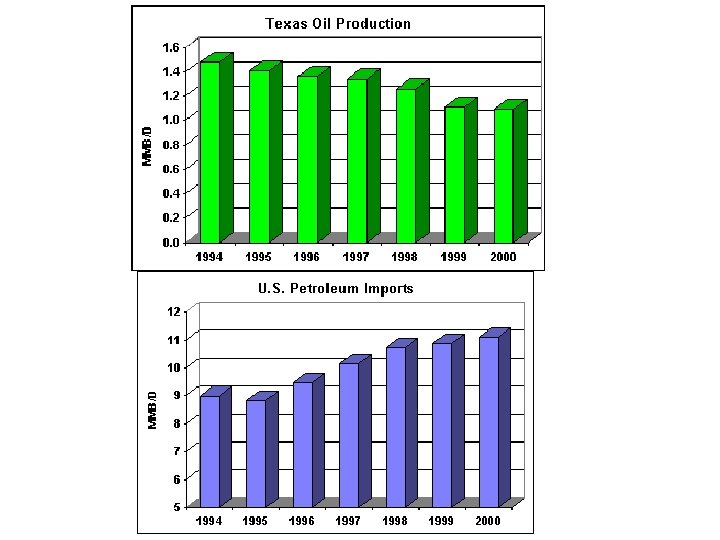
 The economic boom of the 1970 s and the bust of the 1980 s were both caused by fluctuations in the world price of oil.
 Hundreds of banks and savings-and-loans went broke in Texas in in the late 1980 s. By December 1993, the federal government had spent $21 billion to bail out depositors and investors in insolvent Texas savings and loans— 71 percent of the national total. (p. 428)
 The major growth in job opportunities in Texas during the 1990 s was in the service sector, with particular growth in the retail trade, telecommunications, and health services. By 2001, three -quarters of all non-agricultural Texas jobs were in the “serviceproducing” (as opposed to “goods-producing”) category. (p. 429)
 One out of every four new manufacturing jobs was in computer-related industries, making Texas one of the leaders of the nation’s “high-tech” revolution. By 2001, the world’s two largest manufacturers of personal computers—Dell and Compaq—were Texas-based companies. (p. 420. )
 Approximately 3 percent of Texans today are employed in agriculture
 Most Texans today live in urban areas. Since the 1990 s, the most rapid population growth in the 1990 s occurred in the suburbs.
") Texas's major cities have all reluctantly embraced light-rail systems DART (Dallas Area Rapid Transit)
Texas's major cities have all reluctantly embraced light-rail systems DART (Dallas Area Rapid Transit)
 Religion in Texas Texans are a very religious people. In 1990, Texas led the nation in the number of churches and church members. Nearly 65 percent of Texans said that they regularly attend church -- 10 percent more than the national average. The greatest change from 1970 was the increase in the number of Roman Catholics who passed Southern Baptists as the largest individual denomination.
 The Protestant Evangelical denominations grew faster than the mainline Protestant churches. A few of the urban evangelical congregations became megachurches with tens of thousands of members. Fundamentalist congregations increased membership and became politically active as the "religious right. " Fundamentalists and other religious conservatives became a part of a conservative coalition within the Republican party. They opposed abortion rights, homosexual rights, the teaching of evolution, the ordination of women and homosexuals. They favored school prayer and a prominent role for religion in civic life.
 Location of Megachurches Forty percent of megachurches are found in the South, 32% in the West, and 21% in the Midwest, but only six percent in the Northeast. The states with the greatest concentration include California, Texas, Florida, and Georgia. Region a. New England b. Middle Atlantic c. South Atlantic d. East South Central e. West South Central f. East North Central g. West North Central h. Mountain i. Pacific + AK & HI Percent 2. 0% 4. 0 18. 5 6. 0 15. 9 12. 9 8. 6 10. 6 21. 9 Megachurches are predominantly a phenomenon of the suburbs of very large cities. Sixty-three percent are located in or around cities of 250, 000 or more, with 23% in cities between 50, 000 and 250, 000. Nearly three quarters of the churches reside in the older or newer suburbs of these large cities.
 The fundamentalist takeover of the Southern Baptist Convention was a controversy that has badly divided Texas Baptists since the 1970 s. Below is a statement of the SBC’s positions found at http: //www. sbc. net/bfm 2000. asp#i The SBC adopted new creedal statements condemning homosexuality and abortion and instructing women to “submit” themselves “graciously” to the leadership of their husbands. (p. 437) The Baptist Faith and Message I. The Scriptures The Holy Bible was written by men divinely inspired and is God's revelation of Himself to man. It is a perfect treasure of divine instruction. It has God for its author, salvation for its end, and truth, without any mixture of error, for its matter. Therefore, all Scripture is totally true and trustworthy. It reveals the principles by which God judges us, and therefore is, and will remain to the end of the world, the true center of Christian union, and the supreme standard by which all human conduct, creeds, and religious opinions should be tried. All Scripture is a testimony to Christ, who is Himself the focus of divine revelation.
 Texan singer Willie Nelson abandoned Nashville for Austin in 1970, creating a new movement in country music and helping to make Austin a major center for the performing and recording industries
 A trend toward consolidation of newspaper ownership by non. Texan corporations has characterized the newspaper business in Texas in recent times.
 According to your textbook, the most successful professional sports franchise in Texas has been the Dallas Cowboys.
 Texas Politics The last three decades of the twentieth century marked the end of a century of Democratic dominance, although Texas never ceased being a conservative state. "The liberalism of Lyndon Johnson's presidency, with its embrace of civil rights and it war on poverty frightened conservative Democrats and made the Republican party look increasingly attractive. " In 1978, Texans elected Dallas oilman William P. Clements as governor, the first Republican governor since Reconstruction.
 In 1978, Bill Clements became the first Republican to win the Texas governorship since Reconstruction. He defeated John Hill, who ran a complacent campaign. (p. 454)
, Lloyd") In 1982, Democrats elected a full slate of candidates: Mark White (Governor, conservative), Lloyd Bentsen (United States Senate, conservative), Bill Hobby (Lieutenant Governor, moderate), Jim Hightower (Commissioner of Agriculture, liberal), Ann Richards (State Treasurer, liberal), Jim Mattox (Attorney General, liberal), and Gary Mauro (Land Commissioner, liberal). Despite his conservative credentials, White convinced the legislature to pass a broad reform program. "The Texas Observer described the governor as the most liberal chief executive of the last fifty years. " Governor Mark White
In 1982, Democrats elected a full slate of candidates: Mark White (Governor, conservative), Lloyd Bentsen (United States Senate, conservative), Bill Hobby (Lieutenant Governor, moderate), Jim Hightower (Commissioner of Agriculture, liberal), Ann Richards (State Treasurer, liberal), Jim Mattox (Attorney General, liberal), and Gary Mauro (Land Commissioner, liberal). Despite his conservative credentials, White convinced the legislature to pass a broad reform program. "The Texas Observer described the governor as the most liberal chief executive of the last fifty years. " Governor Mark White
 In the mid-1980 s, the Democratic party confronted a conflict. ". . . it needed its traditional white East Texas voters, but at the same time it also needed to mobilize voter turnout in the minority and lowincome precincts, where social issues were important concerns. " In the presidential election of 1988, the Republican George H. W. Bush defeated a Democratic ticket that included Lloyd Bentsen as the vice-presidential candidate.
 In 1990, the Democrats won the governorship when Ann Richards defeated Clayton Williams, a Midland oilman. Williams began the campaign 20 percentage points ahead in the polls, but lost his lead because of series of political gaffes and misstatements.
 Governor Ann Richard's legacy lay not in legislation but in her fulfillment of campaign promises to make the state government reflect the diversity of the state's people. "
 In 1994, George W. Bush defeated Richards's reelection bid. His reelection in 1998 confirmed the Republican party's arrival as the majority party in Texas. They held every one of the twenty-nine offices elected by statewide vote.
 In statewide races, the Republican party achieved almost total victory in the 1990 s
 By the 1990 s, the Democratic party confronted problems in attracting Texas voters. At the national and state levels, voters viewed the Democrats as the liberal party, whereas most white Texans were conservative. The Democrats became the party of inner-city and minority voters, voters whose turnout tends to be significantly lower than that of whites. Hispanic voters overwhelmingly were loyal to the liberal wing of the Democratic party. As their numbers increase in the new century, they may provide a base for a resurgent Democratic party.
 Public Education In the 1980 s, Dallas billionaire Ross Perot chaired an educational reform committee whose recommendations led to House Bill 72: higher teacher salaries, competency testing for teachers, secondary teachers must have degrees in academic subjects, and no-pass, no-play.
 “Robin Hood” Act Poor school districts sued the state, arguing that funding half of school financing with local property taxes insured gross inequities. In 1986, the state's wealthiest one hundred districts spent $7, 233 per student, while the poorest one hundred districts spent $2, 978 per student. State courts ruled in favor of the poor districts and demanded that the Texas legislature reform the school funding system. In 1993, the "Robin Hood" act took a share of the funding from the richer districts and distributed the money among poorer districts. Nevertheless, in the new century local property taxes continued to fund about half of school costs and therefore the discrepancies remained.
 Changes in the state's population complicated the school funding controversie In 2001, diversity characterized the Dallas school system: Hispanic 52 percent, African Americans 37 per cent, Anglos 9 per cent, and Asian Americans 2 per cent. Other citie had similar diversity in their population.
 Universities In recent years, Texas's universities became more female, older, and politically conservative. Texas experimented with affirmative action to bring more diversity to the states universities. However, in 1996 four white applicants sued the University of Texas Law School for giving preference to minority applicants. In the case of Hopwood v. State of Texas, the court found in favor of the white plaintiffs. Texas universities were then required to base admissions on a race-neutral basis. Nevertheless, minority enrollments did not permanently decline, in part because of a 1997 law that provided automatic admission to Texas universities to students in the top 10 percent of their high school classes.
 The South Texas Initiative is a program aimed at improving higher education in South Texas. (pp. 464465) In 1987, the Mexican American Legal Defense Fund, LULAC, the G. I. Forum sued the state, demanding the expansion of higher education institutions and programs in the Rio Grande Valley. When a court ruled in favor of the plaintiffs, the legislature created the South Texas Initiative to finance higher education in the Valley. Although a higher court later overturned the decision, the financing for South Texas higher education continued.
 Aggies and Longhorns Traditionally, Texas higher education was funded by general tax revenues and the Permanent University Fund (PUF). Beginning in 1931, the University of Texas received two-thirds of the PUF and Texas A&M one-third. In 1984, voters ratified a constitutional amendment allowed other members of the University of Texas and Texas A&M systems to share in PUF.
 Water Dilemma As the state entered the twenty-first century, Texas confronted a water dilemma. With no natural lakes, Texas depended on underground aquifers. The rapidly expanding population and economy threatened to deplete the groundwater resources. Budgetary problems and regional rivalries have frustrated the state's efforts to solve its water problems. In the 1990 s, groundwater accounted for more than half of all water used in the state.
 Metropolitan Areas with the Worst Ozone Air Pollution Rank. Metropolitan Statistical Areas 1 LOS ANGELES-RIVERSIDE-ORANGE COUNTY, CA 2 FRESNO, CA 3 BAKERSFIELD, CA 4 VISALIA- -PORTERVILLE, CA 5 HOUSTON-BAYTOWN-HUNTSVILLE, TX CMSA 6 MERCED, CA 7 SACRAMENTO-ARDEN-ARCADE--TRUCKEE, CA-NV 8 HANFORD-CORCORAN, CA 9 KNOXVILLE-SEVIERVILLE-LA FOLLETTE, TN 10 DALLAS-FORT WORTH, TX CMSA Texas cities have some of the most polluted air in the nation.
 The Texas Environment In 1990, Texas ranked worst among all fifty states in carbon dioxide emissions, a principal component in air pollution and a widely suspected cause of global warming. Texas released more ozone-producing chemicals into the air, produced more carcinogenic benzene and vinyl chloride, and operated more hazardous-waste incinerators than any other state. In 1999, Houston passed Los Angeles as the city with the nation’s worst air quality. (p. 470. )
 INDUSTRIAL AIR EMISSIONS OF TOXICS IN TEXAS, SELECTED STATES/TERRITORIES, AND THE U. S. , 2001 STATE MILLIONS OF POUNDS OF TOXIC AIR EMISSIONS, MANUFACTURING INDUSTRIES, 2001 MILLIONS OF POUNDS OF TOXIC AIR EMISSIONS, ALL INDUSTRIES, 2001 121. 3 Ohio 50. 7 North Carolina 36. 2 Texas 87. 1 Georgia 42. 7 91. 8 Pennsylvania 29. 8 89. 0 Florida 30. 5 83. 4 Tennessee 55. 1 79. 6 Indiana 38. 8 77. 8 Top Eight 115. 1 102. 8 760. 9
 Ranking of the States: State & Local Government Public Welfare Expenditures per Capita, 2001 -2002
 Taxes Traditionally, Texans believed that low taxes led to economic growth. Texas raises revenue through: 1. a franchise tax on corporations, 2. "sin" taxes (tobacco and alcohol), 3. excise taxes (gasoline and motor-vehicle registration), 4. severance taxes on oil and natural gas, 5. local property taxes, 6. and since 1962 a general sales tax. For Texans, the least favored method of raising revenue for state government was an income tax. Reform efforts failed in the 1990 s. As a result of the regressive tax structure, "in 1998 the poorest 20 percent of Texans spent 16 percent of their income paying state and local taxes, while the wealthiest 20 percent spent less than 4 percent of theirs. "
 Nine states do not have an income tax or have a tax limited to specific kinds of unearned income. The nine states: Alaska, Florida, Nevada, New Hampshire, South Dakota, Tennessee, Texas, Washington, and Wyoming.
 In 1972, Texas inmate David Ruiz sued the state, arguing that the conditions in the Huntsville prison violated his civil rights. In the case of Ruiz v. Estelle, Federal District Judge William Wayne Justice ordered the state to solve the problems of overcrowding and treatment of inmates. Over the next two decades, Texas invested heavily in expanding and reforming the prison system. Construction of a new Texas Prison New Boston Prison
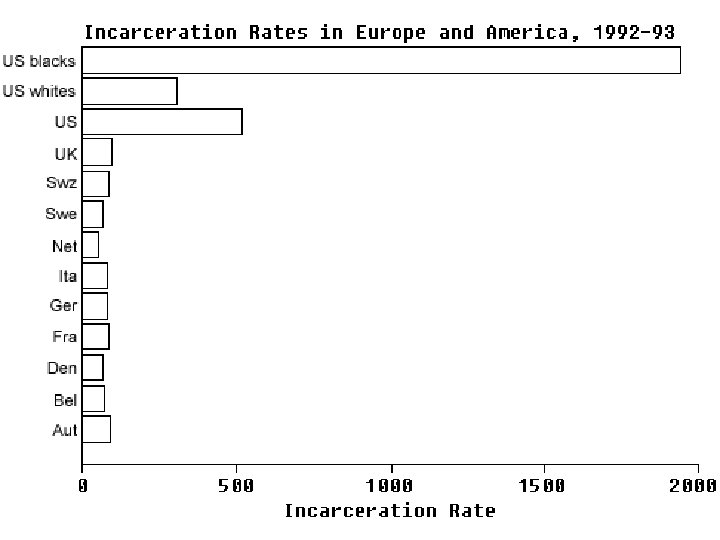
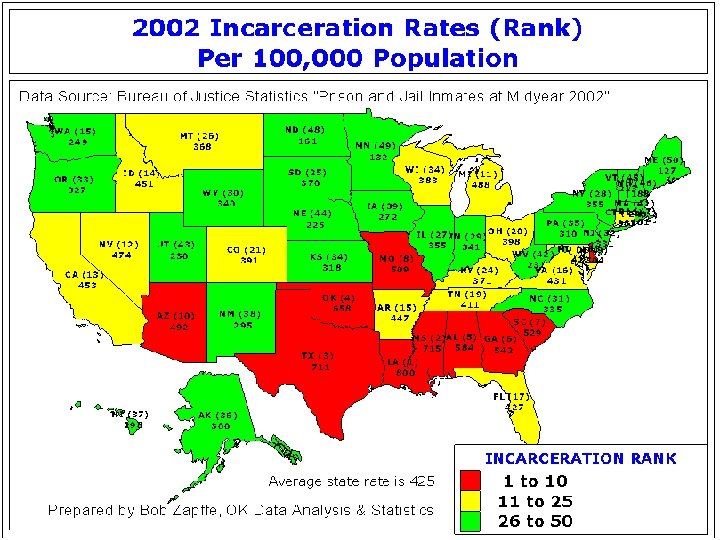
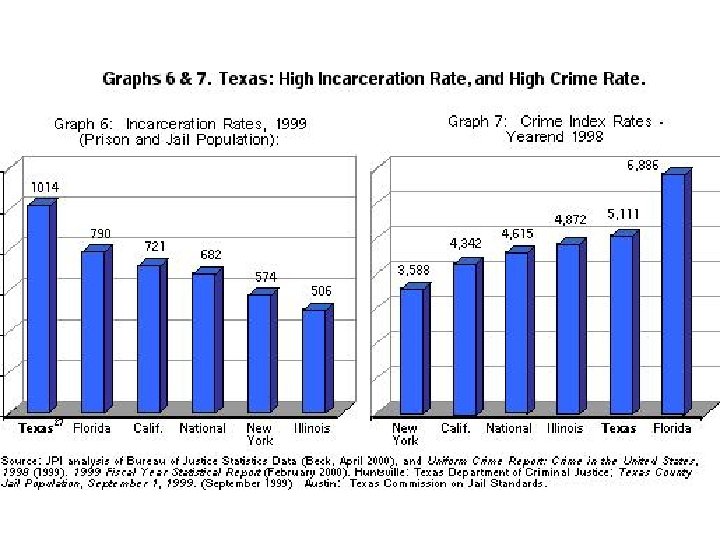
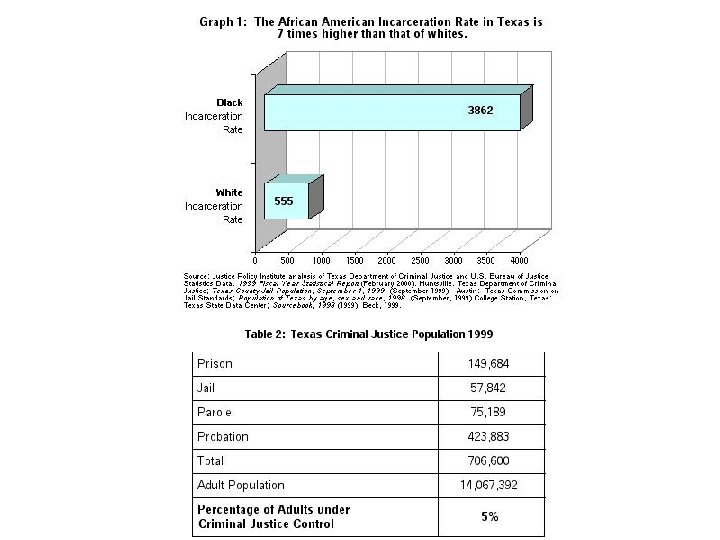
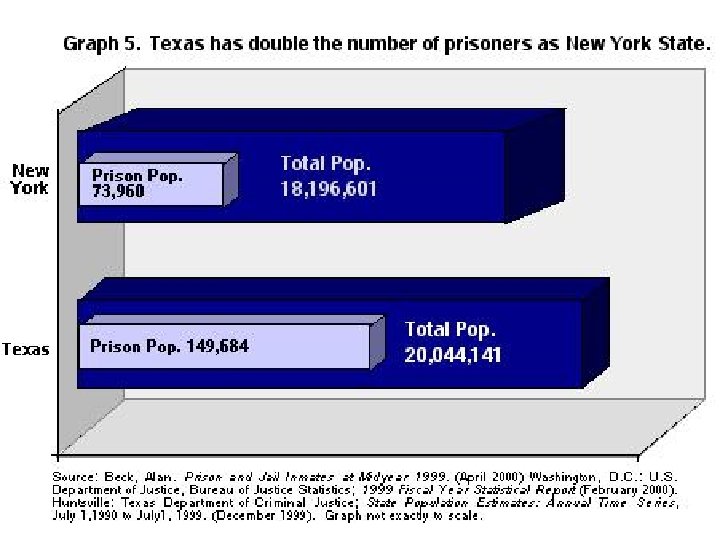
 A federal study released Thursday shows that Texas led the nation in the number of inmates incarcerated in state prisons and county jails in June 2003. Texas had 164, 222 inmates on the last day of that month, about 800 more than California. The Texas inmate population was up by 4. 2 percent, or 6, 578 inmates, from June 2002, according to the study by the U. S. Bureau of Justice Statistics. Texas' June 2003 incarceration rate also was the highest in the nation, with 692 inmates per 100, 000 population. Mississippi ran a close second with an incarceration rate of 688 per 100, 000 residents. . . Overall, the report said the nation's federal, state and local prisons and jails were holding more than 2 million people on June 30, 2003, the largest number in four years.
 Executions By State, 1997 -2003 Source: Bureau of Justice Statistics http: //www. ojp. usdoj. gov/bjs/pub/pdf/cp 03. pdf