

686e161709891afbb717be3678e64203.ppt
- Количество слайдов: 39
 R&D Innovation and Australia’s Manufacturing Future Dr John Blakemore Principal Blakemore Consulting International Sydney masc@blakemore. com. au www. blakemore. com. au
 Australian Manufacturing Has a Problem
 Problem • Manufactured imports greater than manufactured exports • Net contraction in real terms, of the production of value added goods • Despite record terms of trade we trade in deficit with CAD = approx 6%GDP • Solution is Innovation of process and product and increase in Business R&D
 R&D $ & Productivity Source: OECD Main Science and Technology Indicators, 2005 -1 Source: OECD Productivity Database, 17 December 2004 GERD is defined as total expenditure by all sectors — business enterprise, government, private non-profit, higher education — on R&D that is performed within the boundaries of the country
 Australia Exports & Employment Excellent Correlation
 CSIRO Exp vs Comparative Adv
 Process Innovation versus Product Development • There is no point in adding a new product to a bad system • Process innovation and product innovation must be integrated together to achieve the flexibility needed • Products need to be modular and design and customer friendly
 Where Do You Start? The World is your Market 1. Processes must be world class 2. Concentrate effort in areas in which we have a competitive advantage 3. Join the global supply chains 4. Integrate processes and systems, pull 5. by customer, then spread out both ways. 6. 5. Recognize that it is all about QCD 7. 6. Use internal digital data on shorter periods 8. 7. Hook up digitally with customers & suppliers 9. 8. Reduce or Eliminate forecasting as much as possible
 Parameters 1 • The resources boom and a weak US$ has led to an elevation of the $A and squeezed manufactured exports…Dutch/Spanish Disease in the future? • Labour costs often blamed (incorrect? ) • Serious infrastructure constraints • Servicing costs on foreign debt high • Interest rates high by global standards and will go up higher when Net Financial Debt seen as a problem (60% GDP, CAD = 6% GDP) • Italy highest on record in 1924 at 7. 1% of GDP, then, in 1925 what happened?
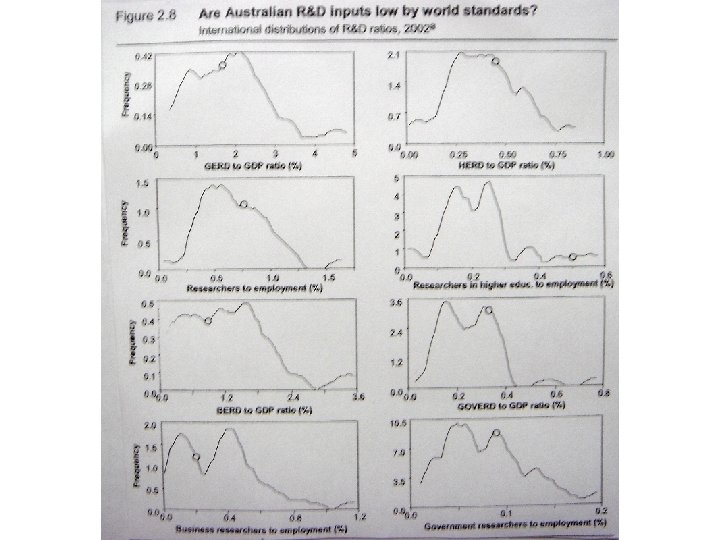
 Parameters 2 • R&D and Innovation are the key drivers of manufacturing growth and sustainability • Australia’s private R&D investment is very low by world standards • Australia concentrates its innovation and R&D in the middle of the supply chain. This effort is more valuable closer to the customer.
 Innovation and Performance • We need to be flexible and fast like Australia 2 in the America’s Cup in 1983 when we came from behind 3 to 1 and had to win the next 3 races in a row Even though we lost the next 3 starts we won the cup. • The secret was the Ben Lexcen’s innovation. • We need a winged keel!!!
 Manufacturing or Service? • There is no such thing as a pure manufacturing company • All companies are service driven • What is your position in the supply chain?
 Solutions • Two plans needed • 1. Short term objectives to immediately build a planning system to release working capital by reducing the planning cycle and making to order ( Process and System Innovation) • 2. Long term strategies to utilize all national resources to link process and product innovation systems and R&D and maximize performance by reducing planning cycles and maximizing value added in the whole of the supply chain (Process, System Product Dev).
 Key Business Financial Ratios To Aid Process & Product Innovation • • • EBITA ROWC = Return on Working Capital (Dr=Cr) Days Inventory Value Added Percent of Sales and Product WC as % Sales Cash Flow (Current Ratio) (Labour + oncosts) as % Sales $ Quality (Waste), Cost (COS), Delivery (OTD) R&D as % Sales (Process vs Product) Intangible Assets? RONA (How do you value assets? )
 Changes to plan") Key Operational Ratios • • On Time Deliveries % (CROTD, Actual) Changes to plan Planning lead Time Lead Time ( Time to produce from RM) Value Added Time (Run Time/ 168 ) Measures (Setup, Run, BD, PMT, Idle, CU), Manned Time (% Available) % Major Ops with adequate backup personnel
Key Operational Ratios • • On Time Deliveries % (CROTD, Actual) Changes to plan Planning lead Time Lead Time ( Time to produce from RM) Value Added Time (Run Time/ 168 ) Measures (Setup, Run, BD, PMT, Idle, CU), Manned Time (% Available) % Major Ops with adequate backup personnel
 Current Accounting Procedures are Inadequate and Mislead • Spread overheads over all processes. ( but Admin Overheads? ) • Isolate what is in the overheads and allocate them correctly to products and processes • Use the appropriate line entries in the P&L to focus on the cost of non value added processes • Do not be misled by the fact that inventory is seen as an asset on the Balance Sheet… it is a waste.
 P&L and Improved Flow
 Some Operational Measures can be Misleading • % up time may be high because run or batch sizes are too large and this creates excess inventory of some and out of stock for others • Solution is to measure and reduce continuously the Economic Production Run (EPR) and reduce setups, idle time, cleanups, colour changes, breakdowns, • Preventative maintenance needs to be optimised
 Machine Measures Typical 1 2 3 4 5 6 7 8 9 10 11 12 13 14 15 16 No Machines 23 10 15 1 1 1 9 24 11 51 20 1 1 1 No Shifts per Wk 18 18 13 2. 5 5 10 5 15 15 15 5 10 0 0 0 3. 6 7. 9 0. 4 - 3. 1 4. 5 1 - - - - Ops Setup % Run Time % (7 d)* 33 Run Time % (5 d)** 38. Down time %(7 d) * 67 Down time %(5 d) ** 61. 26. 5 31. 6 1 73. 4 5 68. 18 21. 4 82 9 78. 21. 2 - 6 52. 58. 3 - 7 24. 72. 15. - 6 - - 55. - 4 - 5 - - 42. - 7 96. 45. 5 31. 1 1 23. 63. 3 4 52. 1 4 32. 40. 57. 9 3 56. 5 9 39. 59. 3 - 1 39. 49. 2 - 3 50. 7 - 8 32. 82. - 2 7. 2 - 6. 2 25. Cleanup % 4. 8 0. 8 3. 4 2. 1 2. 2 1 7. 5 2. 4 2. 1 Idle % h 5. 1 5 8 5. 7 4. 7 0. 5 Prevent Maint % 0 R&D % 5. 6 1. 3 0. 1 0 Rework % 7 2. 2 0. 3 0 2
 •") My R&D and Innovation Grant Observations • 800 R&D Innovation Applications (6 yrs) • 50% received grants, 5% successful • IP mostly exploited Overseas • (e. g. Shi Zhengrong and Suntech) • Tasmanian windfarm technology to China • Small no. people rich • Little National Benefit • Favours Product over Process Innovation • Commercial Ready needs Improvement!
My R&D and Innovation Grant Observations • 800 R&D Innovation Applications (6 yrs) • 50% received grants, 5% successful • IP mostly exploited Overseas • (e. g. Shi Zhengrong and Suntech) • Tasmanian windfarm technology to China • Small no. people rich • Little National Benefit • Favours Product over Process Innovation • Commercial Ready needs Improvement!
 Industry Statement May 2007 • • • Recognizes the need to act now 3 Major initiatives 1. Productivity Centres 2. Global Opportunities Program 3. R&D concession improvements. Claims Manufacturing has grown by 1. 2% pa for the last 10 years, (inflation? ) • Recognises that large overseas owned enterprises are not contributing significantly to private R&D • Initiatives for these to use Overseas Intellectual Property in Australian R&D. Is this surprising?
 Judging Commercial Ready 1. 2. 3. 4. 5. Management Capability (P&L, Fin Ratios, Balance Sheet, Organization) Commercial Potential (Market, Export Potential, Plan) Technical Strength (Innovation, Proof of Concept, Plan, Integration of R&D with functions, milestones) Need for Funding (Proof can fund 50% ) National Benefit (Australian employment potential, export potential) All 5 of equal weight, (6 points each), must score min 17 to be supported
 Reasons for Failure of R&D Poor Understanding of the: 1. connection between Process & Product Innovation 2. use of correct resources (inc Partnerships, Pana/Leica) 3. ways to release working capital to max Technology 4. needs of the market (needs versus wants) 5. scientific method (observation and measurement) 6. need to articulate the concept and plan 7. way to raise funds to support the application 8. best way to use capital 9. measurement of risk 10. need to tap the wisdom of the worker
 Innovation Process versus Product There is no point in adding a new product to a bad system. Honda, Canon, Kawai, Toyota, Panasonic, all link Process and Product Innovation
 How do we Implement Creative Manufacturing, the immediate need and the Step Beyond Lean It is all about People, Training, Culture, Leadership and Commitment
 Kyosei • Kyosei = Living and Working Together for the common good • Kaizen = Continuous Improvement • Genchi genbutsu = place of understanding • Obeya = big room • Sensai = teacher • Poka-yoke = mistake-proofing • Jidoka = stop machines (Toyoda Loom) • Miyamoto Musashi “The Book of Five Rings” the Samurai warrior after Shogun liberation
 Demand = Production • Pull by Customer •") Rule 1 Make to Order (MTO) Demand = Production • Pull by Customer • Apply Continuous flow rules (26) • Continuously reduce batch sizes by reducing the Economic Production Run (One piece Flow? ) • Plan by replacement short Lead t • Reduce forecasting as much as possible
Rule 1 Make to Order (MTO) Demand = Production • Pull by Customer • Apply Continuous flow rules (26) • Continuously reduce batch sizes by reducing the Economic Production Run (One piece Flow? ) • Plan by replacement short Lead t • Reduce forecasting as much as possible
 Rule 2 Maximum Flexibility Machine and Labour • Match Manufacturing Capability with Demand • Tirelessly improve flexibility by reducing EPR’s • Continuously reduce lead time • Focus on the financial parameters to prioritise • Aim for continuous flow • Maximise the use of Appropriate Technology (Six Sigma) • A process can be treated like a machine (Adam Smith)
 Rule 3 Innovate • Drive Product Innovation with Process Innovation
 Rule 4 Use Digital Data Effectively Recognise that Digital Data can be obtained at the POS and sent to any point in the supply chain •
 Rule 5 Design for Flexibility • Reduce Complexity • Modularize • Introduce Complexity late in SC • Universal design (Toyota) • Backup suppliers (standardise)
 Rule 6 Reduce Waste in All Forms • Planning waste • Expenses waste • Resources waste
 actual") Some Values of Key Parameters • Days Inventory = 8 Days (Canon Panasonic) actual 38 Days but 30 Days on Water • Value add % = Never stop Improving (Samurai Warrior, Toyota < 10%) • Planning Cycle = 7 days to one day • R&D as % Sales = > 5% • Process Control at 6 Sigma • On Time Deliveries (CRLT) = 100%
Some Values of Key Parameters • Days Inventory = 8 Days (Canon Panasonic) actual 38 Days but 30 Days on Water • Value add % = Never stop Improving (Samurai Warrior, Toyota < 10%) • Planning Cycle = 7 days to one day • R&D as % Sales = > 5% • Process Control at 6 Sigma • On Time Deliveries (CRLT) = 100%
") Australian Example 1 Profit in $300 M T/O (Ref Blakemore Consulting Reports )
Australian Example 1 Profit in $300 M T/O (Ref Blakemore Consulting Reports )
 Defectives") Australian Example 2 (2 X Productivity (Ref Blakemore Consulting Reports) Defectives
Australian Example 2 (2 X Productivity (Ref Blakemore Consulting Reports) Defectives
 Conclusion • Build a flexible system that can respond to changing markets quickly and optimize the supply chain. • Remove wasteful inventory by matching lead time and cycle time and continuously increasing value added time • Use the capital released from wasteful inventory to innovate flexible systems and processes that can respond faster to new products. • Continuously innovate new products and processes • Use a consistent strategy based on the systems of Honda, Toyota and Canon • Use all resources and be aware of the tools and knowledge available and foster partnerships with the best.
 Innovation, R&D and Australia’s Manufacturing Future We need to be Creative, Innovative, Fast & Flexible (Like Australia 2 1983) John Blakemore
 The End