fd5cf888e7e1d20b0cd54d6ae4383287.ppt
- Количество слайдов: 29


Quality Education for All, Shared by All International Seminar in Madrid 29 November – 1 December 2004 • • Professor David Hopkins Chief Advisor on School Standards, Df. ES

The Problem: • Link between social class and outcomes • Within and between school variation • Too many children insufficiently engaged by learning, leading to • very poor participation rate at 17 The challenge is to put all this right….

Brief history of standards in primary schools 11 plus dominated "Formal" Standards and accountability NLNS Professional control "Informal" 2003 1950 1960 1970 1980 1990 2000 2010

Policies to Drive School Improvement Intervention in inverse proportion to success Accountability Ambitious Standards High Challenge High Support Access to best practice and quality professional development Devolved responsibility Good data and clear targets

4

575 550 525 500 475 450 425 400 375 350 325 300 Belize Morocco Kuwait Iran, Islamic Rep of Argentina Colombia Macedonia, Rep of Turkey Moldova, Rep of Cyprus Norway International Avg. Slovenia Israel Romania Iceland Slovak Republic Greece France Hong Kong SAR Russian Federation Singapore Scotland New Zealand Czech Republic Germany Italy United States Hungary Lithuania Canada (Ontario, Quebec) Latvia Bulgaria England Netherlands Sweden Distribution of Reading Achievement in 9 -10 year olds in 2001 Source: PIRLS 2001 International Report: IEA’s Study of Reading Literacy Achievement in Primary Schools

GCSE: Percentage of Pupils Achieving 5+A*-C Grades 54 52. 9 51. 6 52 49. 2 Percentage 50 50 2000 Year 2001 47. 9 48 46. 3 46 45. 1 44 42 40 1997 1998 1999 2002 2003

Reducing Turnaround Times for Failing Schools

PISA 2001: Mean Score in Student Performance on the Combined Reading Literacy Scale Finland Canada New Zealand Australia Ireland Korea United Kingdom Japan Sweden Iceland Belgium Austria Norway France United States Denmark Switzerland Spain Czech Republic Italy Germany Hungary Poland Greece Portugal Luxembourg Mexico 300 320 340 360 380 400 420 440 460 480 500 520 540 560 Source: OECD, Programme for International Student Assessment (PISA)

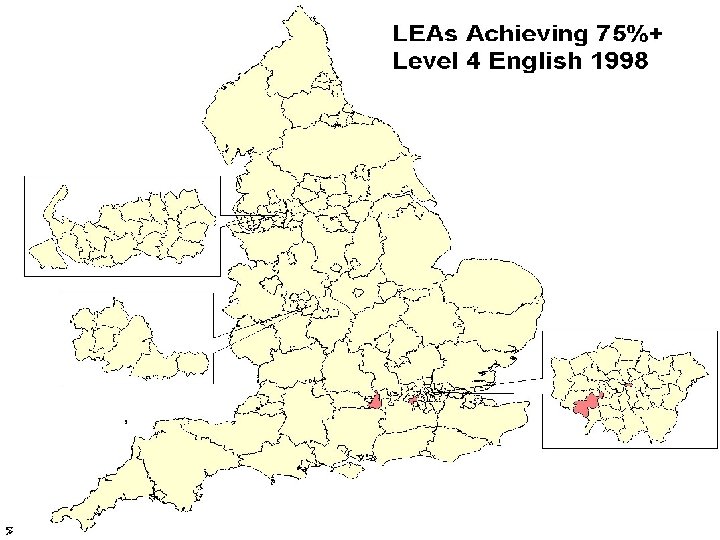
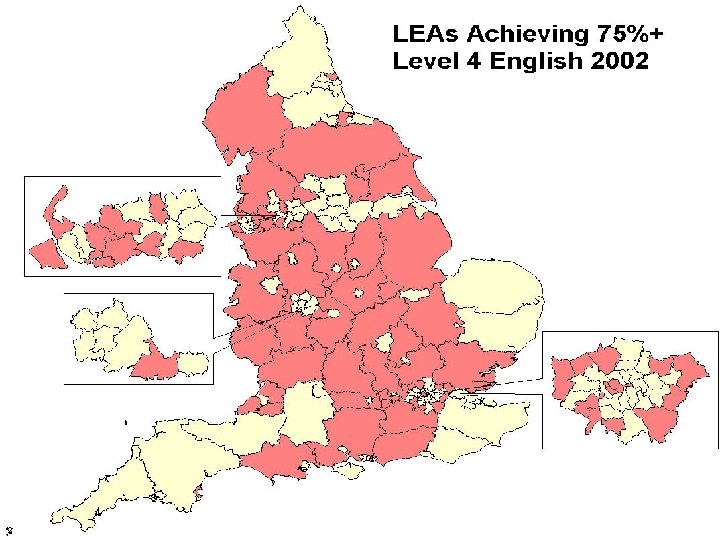
Percentage of Pupils Achieving Level 4 or Above in Key Stage 2 Tests 1998 -2004 English 80 Maths Percentage 75 70 65 60 55 50 1998 1999 2000 2001 Test changes in 2003 • Major changes to writing test/markscheme • Significant changes to maths papers 2002 2003 2004

Percentage achieving level 4 or above Key Stage 2 – Attainment by Free School Meal band 100 90 80 70 60 50 40 30 20 10 0 Low FSM Up to 8 % High FSM 8 - 20% 20 - 35% FSM band 35 - 50% + 1998 Median Line 2002 Median Line

Underperforming Schools - data for KS 3 -KS 4 100% All Other Schools 90% 80% Underperforming Below 30% 5 A-C Underperforming Schools are those in the lowest quartile value-added for EITHER Capped Points Score OR 5 A*- C Actual 5 A*C 70% 60% 50% 40% 30% 20% 10% 0% 0% 10% 20% 30% 40% 50% 60% 70% 80% Estimated 5 A*C (from Pupil KS 3 Data, Gender and School FSM) 90% 100%

Mean performance in reading literacy Towards a High Excellence, High Equity Education System 560 540 High excellence Low equity 520 High excellence High equity Finland U. K. U. S. Canada Japan Korea Belgium 500 • Germany 480 Switzerland Spain Poland 460 Low excellence Low equity 440 Low excellence High equity 420 60 80 100 120 140 • 200 – Variance (variance OECD as a whole = 100) Source: OECD (2001) Knowledge and Skills for Life

Achieving the High Excellence, High Equity System National Prescription High Excellence, High Equity Schools Leading Reform a b Personalised Learning c

Five Drivers for Reform • Personalised learning, enriched curriculum, whole child • System wide focus on workforce reform and teacher professional development • Strong institutions committed to excellence and equity • A synchronised system generating its own momentum for reform • The whole enterprise capturing the heads and minds of the nation

Adding Value to the Learning Journey I know what my learning objectives are and feel in control of my learning I get to learn lots of interesting and different subjects I can get a level 4 in English and Maths before I go to secondary school I know what good work looks like and can help myself to learn I know if I need extra help or to be challenged to do better I will get the right support My parents are involved with the school and I feel I belong here I can work well with and learn from many others as well as my teacher I enjoy using ICT and know how it can help my learning I know how I am being assessed and what I need to do to improve my work I can get the job that I want All these …. whatever my background, whatever my abilities, wherever I start from

The Five Components of Personalised Learning Assessment for Learning Inner Core Effective Teaching and Learning Curriculum Enrichment and Choice Personalising the School Experience Organising the School for Personalised Learning Beyond the Classroom “We need to engage parents and pupils in a partnership with professional teachers and support staff to deliver tailor made services – to embrace individual choice within as well as between schools and to make it meaningful through public sector reform that gives citizens voice and professional flexibility” (David Miliband, 18 May 2004)

Enhancing Professional Development through Workforce Reform is essentially about creating the conditions to deliver personalised learning: • Teachers freed to focus on teaching and learning (released from tasks that don’t require their expertise) • More professional support staff both in and outside the classroom (HLTAs, pastoral and business managers, cover supervisors) and the flexibility to deploy them • Teacher promotion based on classroom practice through ‘teaching and learning reviews’ • Cutting edge ICT to revolutionise curriculum delivery and streamline “back office” systems • Getting the culture right, willingness to re-examine existing models and working practices

The School as a Professional Learning Community • Build in time for collective inquiry • Collective inquiry creates the structural conditions for school improvement • Studying data on classroom practice increases the focus on student learning • Use the research on teaching and learning to improve school improvement efforts • By working in small groups the whole school staff can become a nurturing unit • Staff Development as inquiry provides synergy and enhanced student effects

New Relationship with Schools David Miliband, Minister for Schools, in his North of England Speech, on 9 th January 2004 said: “If we want to make personalised learning the defining feature of our education system then we need to develop a new, more focussed and purposeful relationship between the Department, LEAs and schools. • Strip out clutter and duplication • Align national and local priorities • Release greater local initiative and energy”

The Main Changes SELF-EVALUATION • “continuous, searching, objective … how students progress and how core systems are working” INSPECTION • “short and focussed review of the fundamentals of a school’s performance and systems …. every 3 years … very short notice” SCHOOL IMPROVEMENT PARTNER • “credible practitioner … in many cases with current or recent secondary headship experience … a critical friend” SINGLE CONVERSATION • “about school’s priorities, targets, support needs…. reduce multiple accountabilities … reengineer Df. ES and LEA programmes” PROFILE • “reflecting the breadth and depth of what schools do” DATA • “collected once, used many times” COMMUNICATIONS • “information that schools need, when they need … Amazon-style online ordering”

System Wide Reform tt o en oll en ho m Sc ove pr pr m IIm Te ac Le hi ar ng ni a ng nd Personalised Learning

Networks and Innovation Networks support educational innovation by: • Providing a focal point for the dissemination of good practice and the agents of knowledge creation, transfer and utilisation. • Keeping the focus on the core purposes of schooling in particular creating and sustaining a discourse on teaching and learning. • Enhancing the skill of teachers. • Building capacity for continuous improvement at the local level. • Ensuring that systems of pressure and support are integrated, not segmented. • Acting as a link between the centralised and decentralised policy initiatives.

A Five Year Strategy for Children & Learners Putting people at the heart of public services

Key Principles for Reform • Greater personalisation & choice • Opening up services and new ways of delivery • Freedom & independence • A major commitment to staff development • Partnerships

The 5 Priorities from the 5 Year Strategy • Supporting the education & welfare of the whole child • Continuing the drive in primary education • Widening choice & increasing achievement in secondary & Further Education • Reducing the historic deficit in adult skills • Sustaining an excellent university sector

POWERFUL LEARNING EXPERIENCES
fd5cf888e7e1d20b0cd54d6ae4383287.ppt