9a2b4be6431c8a18f713fc162f9eca84.ppt
- Количество слайдов: 39


Qlik. View technology Jörgen Simon OEM Manager Benelux, Eastern Europe, Turkey and Israel

Our Mission Simplifying Decisions For Everyone

About Qlik. Tech Heritage Board • • Paul Wahl, former COO Siebel and CEO, SAP America • Alex Ott, JVP, former President, Siebel North America • Bruce Golden, Accel, former Executive, Sun, Illustra and Informix • Claes Björk, former CEO, Skanska • Måns Hultman, Chairman, Qlik. Tech • Lars Björk, CEO, Qlik. Tech Founded in 1993 in Sweden R&D located in Lund, Sweden Granted patents on in-memory associative technology Eight major Qlik. View product releases Qlik. View 8 released in 2007 Lead investors – Accel Partners and JVP Organization Results • Management Team: – Former executives from SAP, Siebel, Oracle, PA Consulting, Mactive, Intentia • ~500 employees across 17 offices in 9 countries • More than 500 partners • Headquartered in US (Radnor, PA) • Leading provider of next generation BI solutions • Fastest growing BI software company in the world for three years running (2005 – 2008) according to IDC • Profitable, annual revenue growth of ~50% • 10, 000+ customers in 92 countries • Adding 14. 5 new customers every day • 500, 000+ live users

”In fo rm at io n Ac ce ss ” M ar k et What market are we in? en pm BI lo ve ket De e Mar ris terp n OEM Platform $80 Million Enterprise BI E 09 20 08 20 07 20 06 20 05 20 04 Mid Market BI 20 03 20 02 Midmarket BI 20 rm tfo la t. P M t rke a

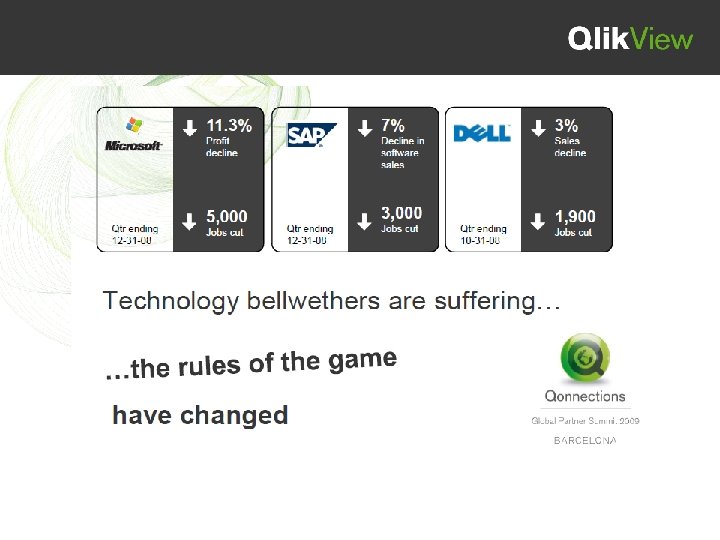
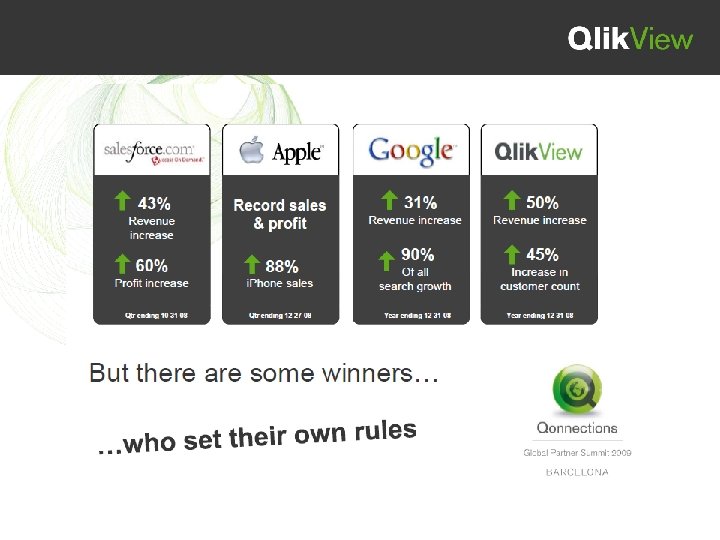
Managing your company through the downturn

Objective To prove that Qlik. View is, now more than ever, the single most important IT investment a company must make to deliver a: high impact, high speed, low cost, and low risk solution to achieve faster and more trusted business decisions. Do this not only to survive, but thrive during and, therefore, after the economic downturn.


Risk Transparency at speed Trust

Ten Positive Steps 1. The True Picture 2. Act, don’t freeze 3. Cash 4. Future Care 4. Don’t slash costs, staff, 8. Intelligent acquisitions of low 5. Understand your Cap. EX is the of your 10. Avoidassets: downturn it 9. 3. Understandkey or cash Be dismissing at not 5. Howon topis Competition 1. Motivation how this valued indiscriminately – 2. Avoid Paralysis: this is customers 7. Avoid Empower affect. Actof 6. will damage R&D layers Protect the your customer time. cuts wholeand excite recruiting that placed. or position, distribution affecting them? most business is to. Budget, the opportunity beat the franchise. 6. Innovate valuedfor successchain = orvital Continue Repricing. staff. customers. inget Management Graduate teams networks/supply Protect Identify competition zones accordinglyhealthy the ie. will Core will from core sales Target in Retaining andinshare holder distractedupturn. waste. recruitment. Talent from easier 7. Target Cuts increasedbe end retail). (ie. AM, lowcustomer the Invest termand adapt Focus short USPs survival Hard on. Fixed costs rather Target business. Competitors will emerge. future. value. 8. Look for opportunities Adjust Revenue andconflict relationships sales decisionsto win shouldn't KPIs: All Operations, Also ‘out-invest’goals your Look than Variable. for new markets with medium targets 9. Recruit product planning, KPIs: must Performance, KPIs: competitors HR, be accessible Predictive KPIs: Sales, Cost KPIs: all. Cost Controlling, Buying Patterns, 10. Motivate Staff KPIs: Recruitment. etc scheduling, QA to by. Transparency across with what-if KPIs: Supplier KPIs: Control, culture KPI: Customer Profitability Sales by industry, client, Customer Service KPIs: All Finance, P&L, empower. Performance, Competitive all for intelligent informed geography AR, decisions data. Risk. Pricing win analysis, Market

Vital Business Transparency and related KPIs R&D and IT Executive • Product Portfolio Analysis • Balanced Scorecard • Product / Project Management • System Performance Controlling • Service Level Reporting • Infrastructure Planning / Sizing • Performance Management • Predictive Analysis • What-if Analysis • Activity-Based Management Finance & HR Sales, Marketing, Service & Web • Financial Consolidation Reporting • Sales Planning Analysis • Customer Analysis • P&L Analysis by Division / Business Unit • IFRS / GAAP / SOX Compliance • Risk Management & Sustainability Report • Workforce and Benefits Analysis • Campaign Performance Analysis • Product Profitability / Price Waterfall • Contact Center / SR Performance Operations Supply Chain • Production Planning & Scheduling • Production Management • Quality Management • Six Sigma / Process Analysis • Demand Planning • Procurement Analysis • Supplier Performance Dashboards • Plant / Equipment Maintenance Analysis Reporting • Inventory and Warehouse Management • Logistics & Fulfillment Analysis Very Few Companies have this insight

Simplifying Analysis for Everyone Else Qlik. View New Rules “Fast Implementation” • Fast Implementation… Customers are live in less than 30 days, and most in a week “Easy-to-Use” • Easy to Use… End users require no training and enjoy “qliking” through the application “Powerful” • Powerful… Near instant response time on data volumes as high as a billion records across thousands of users “Flexible” • Flexible… Allows unlimited dimensions and measures and can be modified in seconds “Integrated” • Integrated… Dashboards, analysis and reporting in a single solution and on a single architecture “Low Cost” • Low Cost… Less costly, shorter implementations result in fast return on investment “Risk-Free” • Risk-Free… Fully-functional free trial download, and a seeing-isbelieving experience Qlik. View Value Proposition: 1/4 the Time, 1/2 the Cost, 2 x the Value

Business Intelligence is Vital Nick Millman, the UK and Ireland lead at Accenture Information Management Services, has stated that the current economic conditions mean firms need business data that will help them make the best decisions. He added that growing companies will benefit from knowing how to "react rapidly to the changing business environment", while he also suggested it could help with direct marketing strategies. "Knowing which geographies, market segments, products and services are making or losing money is critical to making decisions based on reliable data rather than relying on gut instinct, " he explained. "Business intelligence has a key role in helping organisations to out-perform their competition. "

The Market Gartner's view is that BI platform revenue will be less affected by the economic downturn than some other technologies because of the heightened need to make better, fact-based decisions. The BI platform market's compound annual growth rate (CAGR) through 2012 is expected to be 7. 0% for stand-alone BI platforms and 7. 9% for both stand-alone and embedded functionality. BI was the number one technology priority in 2008 in a worldwide survey by Gartner of 1, 500 CIOs – the third consecutive year that the technology has held the top spot. .
 in")
Real Customer Results Sales, Marketing & Service Benefits 100% revenue increase ($33 million) in two years Improved customer retention rates to 96% Supply Chain & Operations Benefits 5% decrease in costs for prescribed medical products, saving $1. 1 million annually WHSmith 50% improvement in inventory forecasting accuracy for 4, 500 SKUs 18% increase in delivery-topromise rates from 79% to 93% 98% reduction in excess and obsolete inventory Finance & HR Benefits $140, 000 in cost reductions for overtime personnel staffing 20% decrease in aging receivables improving cash flow; 15% decrease in inventory levels

Information Provider Industry Trends Gartner BI Predicts 2009 ‘By 2010, 20% of organizations will have an industry-specific analytic application delivered via Saa. S as a standard component of their BI portfolio’ “Information aggregators such as Nielsen, Thomson Reuters and IMS Health will increasingly rely on multi-tenant Saa. S to deliver industry-specific analytic applications built from the data they collect from numerous competitors within a given industry” “Business users will be able to subscribe to Saa. S-based analytic applications that provide an array of reporting and analysis capabilities” Gartner BI Predicts 2009

Information Providers using Qlik. View

33 million

Qlik. View in Action Your Company Your Industry Your Economy

Business Opportunity Headroom Improvements CRM & Billing Simulation Process Management

t’s i en h , w st t us d mo Tr de ee. Taking politics out of business n Putting business into politics

Summary ü ü ü BI is vital, but not traditional OLAP cubes Qlik. View is high speed Qlik. View is world class on high data volumes Qlik. View handles multiple sources Qlik. View is scalable Qlik. View is validated by customers (10, 500 and adding 14. 7 a day) Qlik. View is so consistently successful, its disruptive Qlik. View changes culture: Trusted drill down Unique Associative Technology Qlik. View redefines Ease of use Qlik. View is low risk TCO: Payback in a qlik! ü Ultimately Simple: The recession beater. TRANSPARENCY in a Qlik!
 (or ks ü ee")
“Prove it!” ou 1 h ha rc ge llen $) (or ks ü ee 4 w IB in S ü ion ck ct ba du ey Pro on ü ym da 30 ü tee ran ua g

Objective To prove that Qlik. View is, now more than ever, the single most important IT investment a company must make to deliver a: high impact, high speed, low cost, and low risk solution to achieve faster and more trusted business decisions. Do this not only to survive, but thrive during and, therefore, after the economic downturn. ü

Thank You! Are you a Qlik. View addict like I am yet?

Go-to-Market Timeline

Value Proposition • • • Drive new revenue sources – Sell new analysis applications to existing and new customers and sell more of your existing products and services Improve customer satisfaction – New visibility and instant answers on the business processes driven by your solutions Easy to learn, develop and maintain – Use existing development skill sets and keep existing database structure and business logic Time to Market – Introduce new analytical applications on the market within a quarter Flexible Licensing Model – Business-friendly and adopted to your business model

Seeing is Believing You Provide We Engage You Receive Agreement on project scope: Development scope: Deliverables: • Scoping document • Sample reports • Checklist • Software installation • Data connections • Application layout Onsite setup prior to Si. B: Participation scope: • Hardware configured • Internal data identified • Actively engage in 2 -3 day workshop • User experience evaluation • Qlik. View application prototype • Immediate results from the data analysis • User evaluations to assess areas of improvement • No risk opportunity to assess business value

Qlik. View Case Study Major Global Information Services Provider • Challenge • How do we make information more usable, easier to deliver, quicker to develop and then drive more value for the end customer? • All Data Delivery Through OEM Qlik. View • • • Online Saa. S solution Offline product for low bandwidth regions Yearly syndicated studies via offline executable • Benefits • • • Data goes beyond the analyst and into the business unit for real business decisions Interactive easy to use dashboards and analysis One information services development platform for all customers and all products End user audience find their value in the data Huge data volumes handled with ease • Thousands of projects, hundreds of customers, one solution

Key Business Drivers in Information Services Business Value of Data Customer Self-Service Customers want timely, actionable data that fits their exact needs for making business decisions. Enable customers to explore data on their own and answer questions unique to their business that analysts could not be expected to anticipate. Data must be not only industryspecific, but customer-specific for driving business decisions. Data Visualization Visual representation of data communicates information more clearly and effectively through graphical means, providing customers with more insights into the key relationships of complex data sets in a more intuitive way. Data Delivery Channels Provide customers with the same reporting and analysis capabilities through their preferred channel – on-premise software or in Saa. S models via standalone applications, web, email and i. Phone.

Performance Challenges in Information Services Responsiveness to Market Changes and Customer Needs Enable analysts to expedite and expand analysis of research. Time to Market with User-Friendly Products For any type of research offering – ad hoc projects, syndicated studies, market trackers, social and economic research, multiple-answer surveys, etc. – reduce development time, costs and time to market. Increase Customer Satisfaction & Loyalty Improve upon spreadsheets and static reports as a delivery mechanism for research to customers. New Revenue Sources Create product offerings that command higher value and wider use within customer organizations.

Delivering High Performance for Large Data Volumes 200 GB of data or 140 million records 15 – 20 TB of data or 2 billion records 5 million records pulled from multiple data sources Millions of records pulled from network of hospital trusts Massive data sets 850 products 90% data compression

Industry Recognition & Awards Broad Software & IT Industry Recognition Aberdeen Axis Qlik. Tech the sole champion in the 2009 Aberdeen Axis Report for B I and Performance Management Sand Hill Group Innovation Showcase Winner Selected as one of 25 companies in the Innovation Showcase at the Software 2007 conference. Recognized in the Fast Track category for the company’s significant market traction. Deloitte Technology Fast 500 and Fast 50 Award Winner Named to Deloitte’s Technology Fast 500 and Fast 50 (Philadelphia) in 2008 listing the 500 and 50 fastest growing technology companies in North America and Philadelphia area. Ranked #235 overall. European Technology Entrepreneur of the Year 2008 The prestigious award was presented to the European Technology Entrepreneur whose private company has had the biggest impact, on the largest number of people, in the least amount of time. World Economic Forum Technology Pioneer 2008 Selected by a panel of the world’s leading technology experts based on innovation, potential impact, growth and sustainability and leadership. Previous winners include Google and Business Objects. Gartner Recognition as ‘Visionary BI Provider’ Predicts predominance of ‘In-Memory’ BI solutions for 70% of Fortune 1000. Recognized as a ‘Visionary’ in Gartner Group’s annual Magic Quadrant (2009). IDC Recognition as ‘Fastest Growing BI Company’ Acknowledged as the fastest growing BI software company in the world for two years in a row (2005 2006) with profitable, annual revenue growth rates of ~80%.
 for BI/Performance Management")
Qlik. View Leads According to Independent Analysts 2009 Aberdeen AXIS(TM) for BI/Performance Management

Patented In-Memory Associative Technology What Associative • Thought driven • Flexible • Collaborative • Personal • Empowering How In Memory • Visually Interactive • Fast • Summary and Detail • Simple The Power of Simplicity

Partnership for Success - Quotes “Qlik. View, the product, improves our capabilities, our processes, our people and the actionable intelligence we can deliver to our clients. Qlik. Tech, the partner, increases our opportunities to introduce our innovations to new markets. ” Howard Davies, Co-founder, Context “Informatica’s leading data integration and data quality software and Qlik. View’s versatile and flexible technology solution are important building blocks of our channel intelligence services platform, ” “This partnership will provide a strong foundation for Zyme’s data management and visualization capabilities, and will allow us to expand our distinctive and proprietary channel intelligence software and content offerings. ” Chandran Sankaran, CEO of Zyme Solutions. “Qlik. Tech is an excellent partner. The development of Qlik. View is sharp and vital and also very applicable on our own products” Peter Edling, Product Manager Analysis and BI services PAR AB

World Economic Forum

Providing An Integrated Approach Traditional BI Stack User Interface, Dashboards, Scorecards, Reports • User Interface One tool Multiple vendors OLAP, Query and Reporting tools Lots of tools One vendor • Chart and Report Engine IT driven Months to change Data Marts End user driven • Analysis Engine Minutes to change Data Compression • High Cost Data Warehouse Low Cost • Integration Layer (ETL) ERP Unstructured Data CRM
9a2b4be6431c8a18f713fc162f9eca84.ppt