61152b35dc8ed2b9ec4cff076b9dfe41.ppt
- Количество слайдов: 17


PV System Design and Installation LO 4 B – Solar Energy Fundamentals RPS SOLAR SOLUTIONS

Shading Issues Sun - Radiant Energy Cloud

Sun Chart Diagrams and Shading http: //solardat. uoregon. edu/Sun. Chart. Program. html

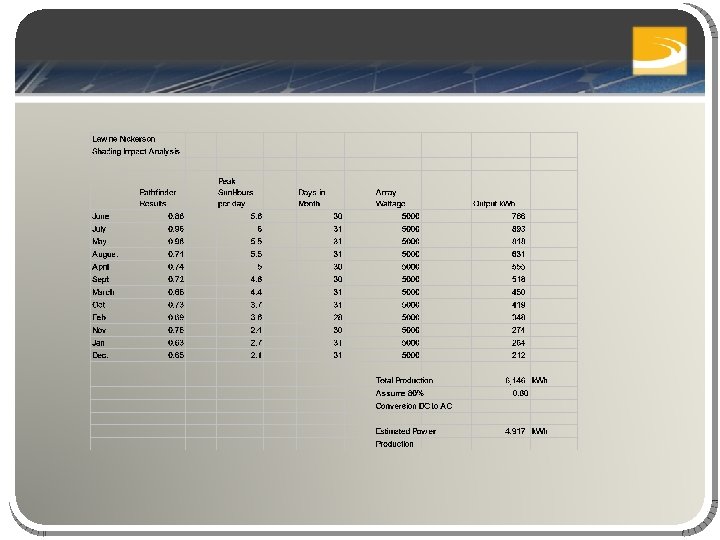
Solar Pathfinder and Shading Analysis

Nickerson House Example Roof slope = 30 degrees

Nickerson Solar Pathfinder

Information needed in addition to Solar Pathfinder for Shading Analysis 1. PV system size (5 k. W) 2. Solar Radiation Data (Peak Sun Hours) 3. Roof Slope (5 : 12)

Roof Pitch to Roof Angles Chart for Conversion of Roof Pitch to Roof Angles Y = Rise Angle X = Run

Energy Production adjustments for orientation and tilt angle Reference 4 Annual Solar Irradiation (k. Wh/m 2) in Berlin as function of azimuth (x) and tilt angle (y)

Energy Production adjustments for orientation and tilt angle Reference 3

Class Analysis of Shading Problem Bowerman House

Bowerman House Looking South

Bowerman Solar Pathfinder

House information PV System Size = 5. 96 k. W Location = Averill Park, NY Zip Code 12018 Magnetic Declination = 14 degrees Roof slope = 5: 12
 Break up into 4 groups Select someone to present results")
Class Work (20 minutes) Break up into 4 groups Select someone to present results Prepare hand written spreadsheet showing shading analysis Calculate Shading Percentages, Daily Peak Sun-Hours, Monthly Power Production (DC k. Wh) and Annual Energy Production (k. Wh) Roof Slopes Group 1 Slope is 0 degrees (horizontal PV module) Group 2 Slope is 6: 12 Group 3 Slope is 10: 12 Group 3 Slope is 57 degrees from the horizon

A Sun Chart Diagram can be developed for an point on the planet based on latitude and longitude.
61152b35dc8ed2b9ec4cff076b9dfe41.ppt