f419a158008b7d2fa1c641c42b80ffbe.ppt
- Количество слайдов: 136

Public Health Surveillance in a Changing Telecommunication Environment. 21 January 2009 Ali H. Mokdad, Ph. D. Professor, Global Health UNIVERSITY OF WASHINGTON

Outline • IHME • Background • Behavioral Risk Factor Surveillance System (BRFSS) • Improvements • Conclusion • Future

IHME Overview UNIVERSITY OF WASHINGTON

Global Context: Attention and Opportunity • More media/political attention, social commitment and resources for global heath than ever before. • Political importance of health within countries and in foreign policy dialogue has increased. • Growing set of diagnostics, drugs, vaccines, procedures for improving health. • New willingness to experiment in how health resources should be channelled to those in need. 4

Why is IHME Needed Now? 1) To sustain interest in global health by demonstrating results; 2) To be more efficient by creating knowledge-related global public goods on what works and what doesn't that can form the basis for a process of shared learning among actors; 3) To promote the values of transparency and accountability worldwide; 4) To provide a strong foundation of publicly-available evidence that empowers policymakers, donors, practitioners, researchers, local and global decision-makers, and others to strategically allocate limited resources for measuring and ultimately improving population health.

IHME’s Core Funding Main sources: The Institute receives $2 million a year from Washington State These funds are supplemented with a 10 year grant of $105 million from the Bill and Melinda Gates Foundation. Project Grants: Projects are often funded by individual grants, rather than from the core grant or state money. 6

Vision and Goal Vision: IHME aspires to make available to the world high quality information on population health and its determinants, and on the performance of health systems. We seek to achieve this directly, by catalyzing the work of others, and by training researchers as well as policy makers. Goal: Our goal is to improve the health of the world’s populations by providing the best information on population health. 7

Who are we trying to reach? • Policy makers (elected, appointed, and technocrats) and policy professionals (staff, analysts, etc. ) • Practitioners • Researchers in global health • Donors • General public 8

Executive Management Team Institute Director of Administration and Operations Director of Strategy and Special Projects Director of Education and Training Director of Global Data Bank Director of Communications 9

A Few Key Projects • GBD • GC 13 Health Outcomes Mortality Causes of Death Functional Health Status Health Services Effective Coverage Technical Quality Decision Analytics International Resources for Health Common Indicators Evaluation Methods Models Inequalities Evaluation Studies National Health Information Systems National Public Expenditure Priority Setting Evaluations Forecasting Human Resources GC 13 • US Project Resource Inputs Household Expenditure Responsiveness Burden of Disease and Comparative Risk Assessment GBD • AVAHAN Evaluation Health Systems Performance Assessment Tools and Instruments Survey Design and Implementation AVAHAN US Project Active Dormant 10

Staff 110 70 54 40 4 July ‘ 07 July ‘ 08 Oct ‘ 08 June ‘ 09 2011 11

Tracking progress towards universal childhood immunisation and the impact of global initiatives: a systematic analysis of three-dose diphtheria, tetanus, and pertussis immunisation coverage Stephen S Lim, David B Stein, Alexandra Charrow, Christopher JL Murray UNIVERSITY OF WASHINGTON

Background Two main questions: 1. What is the trend in three-dose diptheria, tetanus and pertussis vaccination (DTP 3) coverage based on surveys over the period 1986 to 2006? 2. Do target-oriented initiatives such as universal childhood immunization (UCI) and results-based financing initiatives such as GAVI’s Immunization Services Support (ISS) lead to over-reporting of DTP 3 immunization coverage? 13

GAVI Immunization Services Support (ISS) • Performance-based payment • • Reports largely based on administrative data • Baseline is the year prior to approval of the proposal • • Number of additional children reported by countries to have received DTP 3 US$20 is paid once per additional child Data quality audit (DQA) of administrative data system before reward payments commence (from Year 3) 14

15

16

17

18

Global trends in DTP 3 coverage Survey-based global coverage of DTP 3 (black) with 95% uncertainty estimates compared to countries’ officially reported (red) and WHO and UNICEF estimates (blue), 1986 to 2006. 19

GAVI Immunization Services Support (ISS) • Number of additional children vaccinated in 51 countries receiving ISS funding up to the year 2006 : • Based on official reports: 13. 9 million • Survey-based: 7. 3 (5. 5 to 9. 2) million • ISS payments • Based on official reports: US$289 million • Survey-based: US$148 million 20

GAVI Immunization Services Support (ISS) • Out of 51 countries • 4 countries that reported increases, number of additional children did not increase • 6 overestimated by > 4 x • 10 overestimated by > 2 x but ≤ 4 x • 23 overestimated by > 1 x but ≤ 2 x • 8 countries underestimated 21

Summary • Substantial resources are being directed towards increasing the effective coverage of interventions to improve population health • Must ensure that increased resources for health are being utilized costeffectively and for their intended purpose • Independent, contestable, empirically-based monitoring of health indicators 22

Challenges in Public Health Surveillance Background

Coverage problems • Face-to-face coverage: • Available household lists not complete • Need to manually count and list • Telephone coverage: • Households with no telephones (2 -3%) • Cell phone only households (13 -15%) • No directory of cell phone numbers • Number portability and erosion of geographic specificity • Mail coverage: • USPS list only readily available source for general populations – Poor coverage in rural areas • Email coverage: • No systematic directory of addresses

Declining response rates • Response rates decreasing significantly in the last 10 – 15 years. • Decline has occurred for most types of surveys— particularly telephone and in-person interviews • Evidence of trends for mail surveys not as clear due to lack of long-term trend studies. • Web surveys are too new to provide good trend data. • Increase in nonresponse is a global problem • No single or clear explanation for these trends.

Behavioral Risk Factor Surveillance System (BRFSS) • Monthly state-based RDD survey of health issues • 50 states, District of Columbia, Puerto Rico, Guam, and Virgin Islands • 430, 000+ adult interviews conducted in 2007 • From 2002 to 2007: • completed 1, 950, 000 interviews • Dialed 18, 500, 000 telephone numbers

BRFSS Strengths • Flexible • Timely • Standardized • Useful

Prevalence of Obesity* Among U. S. Adults (*BMI 30, or about 30 lbs overweight for 5’ 4” person) 1996 1990 No Data <10% 10%– 14% 2004 15%– 19% 20%-24% 25% Prevalence of Diabetes* Among U. S. Adults (*Includes gestational diabetes) 1990 No Data 1996 <4% 4%-6% 2004 6 -8% 8 -10% >10%

Prevalence of Women Who Never Had a Mammogram, Ages 40 and Older BRFSS 1990– 2004

Support Policies and Legislation: Mandatory Insurance Coverage for Screening Mammography 1981 1990 2004 No mandatory insurance coverage for screening mammography. Mandatory insurance coverage for screening mammography. Source: National Cancer Institute — State Cancer Legislative Database Program, Bethesda, MD, 2004.

Support Policies and Legislation: Prevalence of Safety Belt Use, 2002 Areas with primary safety belt laws Prevalence > 80% of always using a safety belt among persons aged > 18 years. Prevalence < 80% of always using a safety belt among persons aged > 18 years. Source: CDC. Impact of primary laws on adult use of safety belts – United States, 2002. MMWR 2004; 53: 257 -260.

Develop Local Programs and Policies: SMART BRFSS in Fargo • Fargo, ND – 24. 9% binge drinking vs. 16. 4% nationwide • Formed community coalition: AMP (Alcohol Misuse Prevention) • Mission: Reduce alcohol use among those under 21 in the Fargo-Moorhead area. Ø Anti-binge drinking campaign Ø Policy change sanctioning facilities Ø Intervention with ER doctors

People Prepared for Emerging Health Threats

Vaccine Shortage – Timeline • Oct 5: Vaccine shortage announced • Oct 5: Initial discussions within CDC • Oct 19: Call with BRFSS state coordinators • Oct 19 -26: New questions developed and cognitively tested • Oct 27: CATI specifications to states • Nov 1: Data collection began

December MMWR • Dec 1 -11: States collected December data • Dec 13: Submitted files to CDC • Dec 16: Dr. Gerberding holds press conference & MMWR released on the CDC website

Response rate trends: Behavioral Risk Factor Surveillance System (BRFSS)

Percentage of U. S. Households Without Landline Telephones ¡ Based on National Health Interview Survey data


Percent Distribution of Household Telephone Status for Adults, July-December 2007 Phoneless: 1. 9% Unknown: 1. 3% Landline Only: 19. 1% Wireless Only: 14. 5% Wireless Mostly: 14. 0% Landline with Some Wireless: 49. 2%

40

Coverage • Sampling frame must include all units of the population of interest • Frame coverage errors • Coverage by key modes: • Face-to-face: expensive to develop (lists help) • Telephone: cell phones and number portability • Mail: USPS list not complete, but improving • Web: no comprehensive list

Sampling • Each element has a known and non-zero probability of selection from sampling frame • Protection against selection bias • Quantify sampling error • Sampling by key modes: • Face-to-face and telephone: well developed techniques • Mail: within household selection techniques quasirandom for general pop surveys • Email: tend to be nonprobability; opt-in samples

Nonresponse • Inability to obtain data from selected respondent: • Unit nonresponse • Item nonresponse • Nonresponse by key modes: • Highest in face-to-face • Lowest in internet • Item nonresponse varies by mode and question

Measurement • Measurement error occurs when a respondent’s answer to a question is inaccurate (departs from the “true” value) • Modes vary in terms of: • Interviewer versus self-administered • Stimuli / manner in which survey question is conveyed to respondent (and response is recorded)

Interviewer administered questions • Help to: • Motivate respondents • Guide through complex questionnaires • Clarify questions and instructions • Probe for detailed answers • Potential problems: • Less privacy, less anonymous • Social desirability • More positive

Self-administered questions • Help to: • Ensure privacy • Self-paced • Conduct survey at convenience of respondent • Potential problems: • Ensuring correct respondent completes survey • Little/no option for requesting assistance • Stray/out-of-range responses • No means of assess cognitive engagement of respondent

Goal: Optimize survey design to decrease total survey error for a given cost Coverage Sampling Costs Nonresponse Measurement

Costs for single modes • Face-to-face (most expensive): • 5 -10 times higher than telephone • Telephone: • 2 -3 times more expensive than mail • Mail: • higher than Web due to fixed costs plus per interview processing • Web (least expensive): • Primarily fixed set-up costs, little per interview costs

Assessing Data Validity

What do we mean by “validity”? • The closeness of our survey estimates to the “true value” • Ideally there is no difference • Potential survey bias is minimized • “Bias” in survey estimates results from product of: • Level of nonresponse • Difference between respondents and nonrespondents on measures of interest

Ensuring validity of BRFSS Estimates • Monitoring data collection process • Refining post-survey adjustments • Benchmarking to other studies • Testing alternative ways of collecting data • Cell phone interviewing • Address-based sampling (ABS)

Monitoring the Data Collection Process

Monitoring 54 monthly surveys • BRFSS data collection process is semi-centralized • States: • In charge of own data collection • Conduct front-line monitoring • Centers for Disease Control (CDC): • Provides sample • Weighting • Quality reports

Web-based systems are key • Data transfer via upload/download site • Automated quality control programs • State level and CDC level • Monthly detailed reports to states: • Key quality indicators • Deviations from norm and/or past trends within state • Year-end quality report • Comparison across states • Newest tool: Simplified web-based / color coded system


What did we learn? • Estimates are only as valid as the process in which the data were collected • Tools for monitoring the quality of data collection and collecting valid data are only good: • … if they are actually used • … and if they are understood • … and initiate follow-up action

Refining post-survey adjustments

Goals and limits of weighting • Weighting and other post-survey adjustments are used to correct for imbalances in the data due to issues of: • Coverage • Sampling • Nonresponse • Weighting methodology affects the estimates produced • Can only weight data you have • Assumes no difference between respondents and nonrespondents on variables of interest • Can only weight to external standards that exist • Typically limits weighting to a handful of demographic variables, not “substantive” variables

Current BRFSS Weighting System • Use poststratification (cell-based approach) • Controls for: • Age by sex • Race/Ethnicity (in some states) • Region (in some states) • Problems: • Small sample cells produce highly variable weights and require collapsing • No factor to account for socioeconomic status

Conducted detailed analysis to identify key demographic correlates of BRFSS Measures • Age • Race/ethnicity • Gender • Education • Marital status

New weighting system • Uses “Multi-Dimensional Raking” (Sample Balancing) • Controls for: • Age by sex • Race/ethnicity (2. 5% rule) • Region (as necessary) • Education level • Marital status • Telephone service interruption

Does It Represent an Improvement?

Changes in estimate of health status Percentage with Fair or Poor Health Status 25. 0 24. 0 % At Risk 23. 0 22. 0 21. 0 20. 0 19. 0 BRFSS Final Weight Add Race Add Education Add Marital Status Add Age by Educ Add Age by Race

Implications for users of BRFSS data • Break in time series • Plan to release both classic (old) and new weights • Full changeover in 2010 • Health condition and risk factor estimates will likely be higher

What did we learn? • Modifications to post-survey adjustments can improve the quality of the estimates produced • Sometimes need to be innovative in the use of external data in developing population estimates

Benchmarking to external standards

Importance and challenges of benchmarking • True standards rarely exist in health surveys – relative standards • Better coverage, response • No two studies are identical • Populations • Modes / procedures • Wording / question order • Post-survey adjustments / population standards

Benchmark surveys for BRFSS • National Health Interview Survey (NHIS): • In-person interviews with adults 17+ • 2004: 94, 460 adults in 36, 579 households • Household-level response rate = 86. 9% • National Health and Nutrition Examination Survey (NHANES): • In-person survey with physical measures at mobile lab • 2003 -04: 10, 122 adults • Household-level response rate = 91. 0%

Comparison across 15 key health variables • Cigarette smoking • HIV testing • Diabetes • Alcohol consumption • Height • Medical coverage • Weight • Influenza vaccination • Body mass index • Pneumonia shot • Health status • Asthma

Summary of findings • BRFSS vs NHIS estimates: • Significantly different on 10 of 15 variables • Relative difference: – Asthma = +35% – HIV testing = +26% • BRFSS vs. NHANES estimates: • Significantly different on 5 of 6 variables • Relative difference: – Current smoking = -12. 2% – Body mass index = -2. 1%

Ever smoke cigarettes 48. 0% 44. 0% 42. 4%

Ever told had diabetes 8. 1% 8. 0% 6. 1%

Body Mass Index 27. 6 27. 0

Percentage of 18– 34 year olds 41. 5% 31. 2% 31. 5%

Percentage of Males 50. 9% 48. 4%

Percentage of whites 74. 9% 71. 7% 70. 4%

What did we learn? • There are no “gold standards” in health statistics • All comparisons are relative • Surveys can vary in terms of backend processing just as much as on front-end design and operational issues • Determining if BRFSS compares favorably with other surveys is a matter of perspective

Finding new ways of collecting data: Cell phones & Address-based sampling

The Plague of Cell Phones!!!

Cell phones and telephone surveys • Reliance on cell phones increasing • Conducting surveys via cell phones can be operationally challenging: • Cell phone frame very inefficient • Cannot use autodialers • Charges for incoming calls/minutes used • Safety concerns • Potential mode effects / measurement errors

2007 BRFSS cell phone pilot • Conducted in 3 U. S. states • Target: 600 cell & landline / 600 cell-only • Abbreviated BRFSS core interview: • 66 questions • 15 -17 minutes (on average)

Response rates 29. 7% 14. 8% 14. 1%

Landline and Cell phone populations and frames LANDLINE B A C CELL PHONE

Percent male 37. 9 38. 2 Landline survey 46. 6 51. 1 Cell phone survey State equalized design weight applied

Percent 18– 34 years 51. 4 14. 5 19. 6 Landline survey 24. 0 Cell phone survey State equalized design weight applied

Percent Hispanic 16. 8 12. 2 Landline survey 15. 2 21. 4 Cell phone survey State equalized design weight applied

Percent high school or less education 60. 3 48. 5 33. 6 Landline survey 39. 8 Cell phone survey State equalized design weight applied

Comparison of key survey estimates

Percent any kind of health care coverage 89. 0 78. 7 86. 0 70. 1* Landline survey Cell phone survey State equalized design weight applied

Percent currently smoke cigarettes 24. 8 17. 3 Landline survey 19. 7 31. 1* Cell phone survey State equalized design weight applied

Percent ever tested for HIV 54. 2* 37. 5 36. 6 Landline survey 43. 6 Cell phone survey State equalized design weight applied

Percent binge drink past 30 days 11. 0 21. 1 Landline survey 13. 0 23. 5 Cell phone survey State equalized design weight applied

What did we learn? • The part of the population we are missing due to cell phones is different from those we interview --- and we cannot ignore them • Missing critical information needed to integrate landline and cell phone samples at the sub-national level • No reliable external standards denoting telephone usage at subnational level

Address-based sampling

Key questions to address • How do ABS mixed-mode surveys and RDD telephone surveys compare in terms of: • response rates • respondent demographics • estimates on key health issues • costs of implementation • Can ABS mail surveys reach households without telephones and cell phone-only households?

Response rates by mode: 2003 BRFSS mode pilot (address-matched sample)

Why Not Complete Mail Survey? • Letter not received: 58% • Men • Blacks/Hispanics • 18 -34 • Other reasons: • Lost questionnaire 23% • Too much junk mail 19% • Just don’t like surveys! No le tte r No Ot he tim e r

Why Not Complete Web Survey? • No web access: • 65 and older • Lower SES 38% 33% • No children • Letter not received: • Men • 18 -34 17% • Upper SES 12% • Blacks/Hispanics • HHs with children No w No eb le tte No r tim Ot e he r

Item Nonresponse: Telephone vs Mail (Percent DK / RF / Blank) Health condition / risk factor Telephone (%) Mail (%) Asthma 0. 2 2. 4*** Diabetes 0. 1 0. 9*** High blood pressure 0. 2 1. 7*** Obese (BMI > 30) 8. 2 3. 0*** Current smoker 0. 4 1. 9*** Binge drinking 2. 3 2. 1 Tested for HIV 1 5. 6 2. 8*** HIV risk behaviors 1 3. 7 3. 4 Note: Percentages are unweighted. Significance: * p<. 05, ** p<. 01, *** p <. 001 1 Questions not asked of respondents age 65 years or older

Potential mode affects on response: Unadjusted estimates Unadjusted prevalence estimates Health condition / risk factor CATI % (95% CI) Mail Survey % (95% CI) Web survey % (95%CI) Asthma 12. 0 (9. 8 -14. 2) 11. 9 (10. 0 -13. 8) Diabetes 9. 5 (8. 2 -10. 8) 11. 9 (9. 7 -14. 1) 10. 2 (8. 4 -12. 0) High blood pressure 31. 1 (29. 1 -33. 1) 38. 1 (34. 8 -41. 4) 33. 2 (30. 5 -35. 9) Obese (BMI > 30) 21. 6 (19. 8 -23. 4) 26. 5 (23. 5 -29. 5) 25. 6 (23. 0 -28. 2) Current smoker 22. 8 (21. 0 -24. 6) 16. 9 (14. 4 -19. 4) 17. 3 (15. 1 -19. 5) Binge drinking 14. 4 (12. 9 -15. 9) 12. 3 (10. 1 -14. 5) 21. 6 (9. 0 -24. 2) STD prevention 1 8. 2 (6. 8 - 9. 6) 4. 3 (2. 6 - 6. 0) 3. 3 (2. 2 - 4. 4) Tested for HIV 1 ‡ 11. 7 (10. 3 -13. 1) 38. 8 (36. 3 -41. 3) 30. 8 (27. 0 -34. 6) 32. 1 (29. 1 -35. 1) Questions not asked of respondents age 65 years or older

Potential mode affects on response: Adjusted estimates Adjusted odds ratios* Health condition / risk factor Web survey AOR (95%CI) 1. 07 (0. 84 -1. 34) 1. 06 (0. 83 -1. 38) Diabetes 1. 0 1. 16 (0. 89 -1. 51) 1. 30 (1. 01 -1. 67) High blood pressure 1. 0 1. 22 (1. 01 -1. 46) 1. 30 (1. 09 -1. 54) Obese (BMI > 30) 1. 0 1. 37 (1. 12 -1. 66) 1. 31 (1. 10 -1. 57) Current smoker 1. 0 0. 83 (0. 67 -1. 03) 0. 77 (0. 63 -0. 93) Binge drinking 1. 0 1. 17 (0. 90 -1. 52) 1. 87 (1. 50 -2. 34) STD prevention 1 1. 0 0. 69 (0. 43 -1. 12) 0. 51 (0. 33 -0. 78) Tested for HIV 1 1 Mail survey AOR (95%CI) Asthma * CATI 1. 0 0. 81 (0. 65 -1. 01) 0. 85 (0. 71 -1. 03) Models are adjusted for respondents’ state of residence, sex, race, age, education, and number of adults in the household. Questions not asked of respondents age 65 years or older

BRFSS 2006 Address-based sample (ABS) mixed-mode pilot survey • Six states: CA, FL, MA, MN, TX, & SC • Address-based sampling frame: USPS Delivery Sequence File (sample provided by Marketing Systems Group) • Mixed mode data collection: • Initial mail survey • Postcard reminder • Second mail survey (to nonrespondent) • Telephone survey follow-up (of nonrespondents) • 75 questions from BRFSS core questionnaire • Field period: June 20 -Oct 4, 2006 • Compared to monthly RDD surveys from same time frame

Sample design • Probability sample from DSF household frames in each state • Excluded business addresses identified by USPS or Marketing Systems Group • Included seasonal units, vacant units, PO Boxes, throwback units, and drop point units • Stratified sample by county and address type • Drew 1, 870 addresses per state using systematic random sampling (goal: 800 completes per state)

Within household randomization • Mail survey (3 approaches tested): • Most recent birthday (25%) – One questionnaire • Next birthday (25%) – One questionnaire • All adults in household (50%) – Three questionnaires – Toll free number for additional questionnaires • Telephone follow-up survey: • Used BRFSS protocol – number of males / number of females

Response rates

RDD telephone and ABS multimode survey AAPOR #4 response rates State RDD telephone survey ABS multimode Survey Mail survey (only) Telephone follow-up (only) CA 25. 4 36. 1*** 33. 1 3. 0 FL 32. 8 37. 4*** 33. 4 4. 0 MA 26. 3 42. 4*** 36. 5 5. 9 MN 48. 5 54. 1*** 48. 5 5. 6 SC 49. 1 41. 8*** 37. 3 4. 5 TX 28. 7 35. 3*** 30. 8 4. 5 Mean 35. 1 41. 2 36. 6 4. 6

Comparison of respondent demographics

Percent male 48. 6 39. 3 40. 9 41. 3 38. 5 RDD and ABS data weighted by state equalized design weight only.
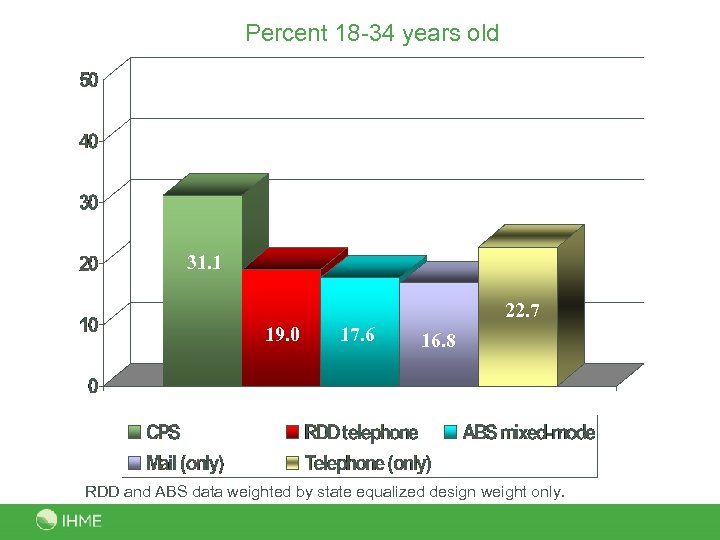
Percent 18 -34 years old 31. 1 22. 7 19. 0 17. 6 16. 8 RDD and ABS data weighted by state equalized design weight only.
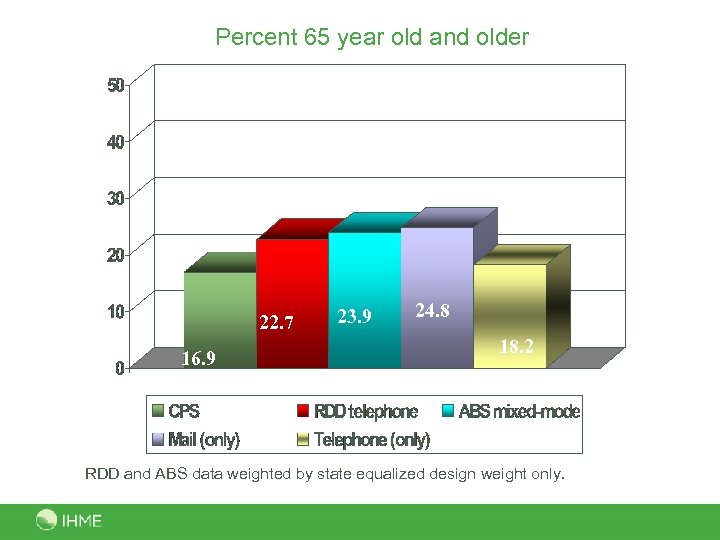
Percent 65 year old and older 22. 7 16. 9 23. 9 24. 8 18. 2 RDD and ABS data weighted by state equalized design weight only.
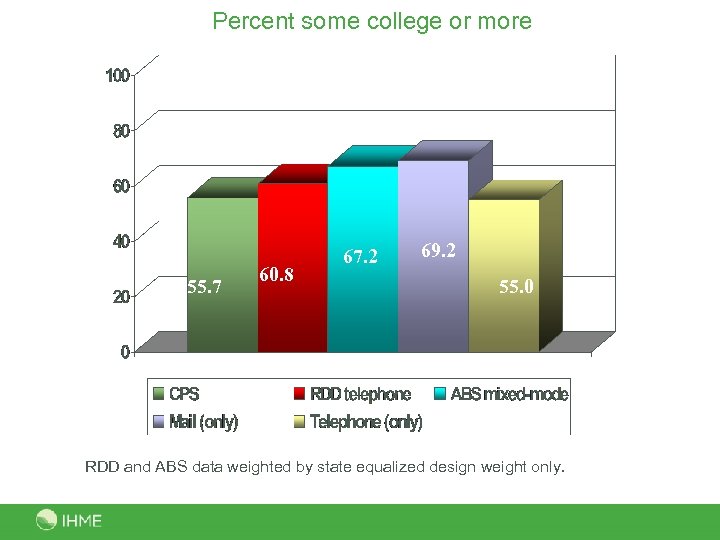
Percent some college or more 55. 7 60. 8 67. 2 69. 2 55. 0 55. 7 RDD and ABS data weighted by state equalized design weight only.
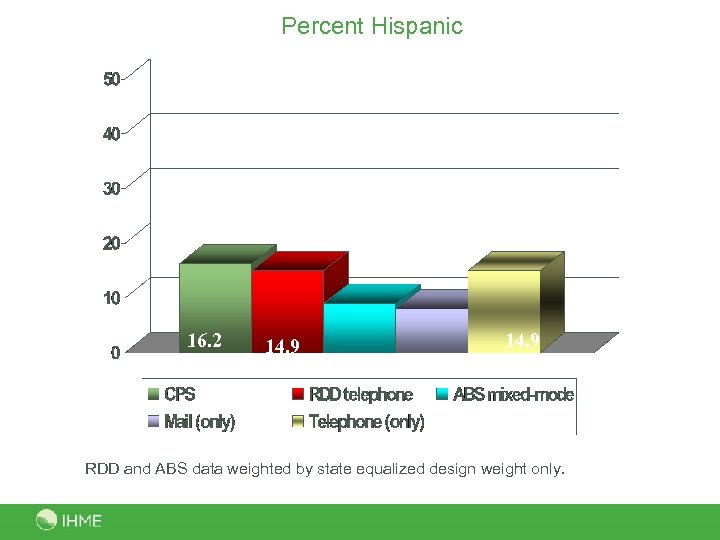
Percent Hispanic 16. 2 14. 9 8. 9 7. 9 RDD and ABS data weighted by state equalized design weight only.
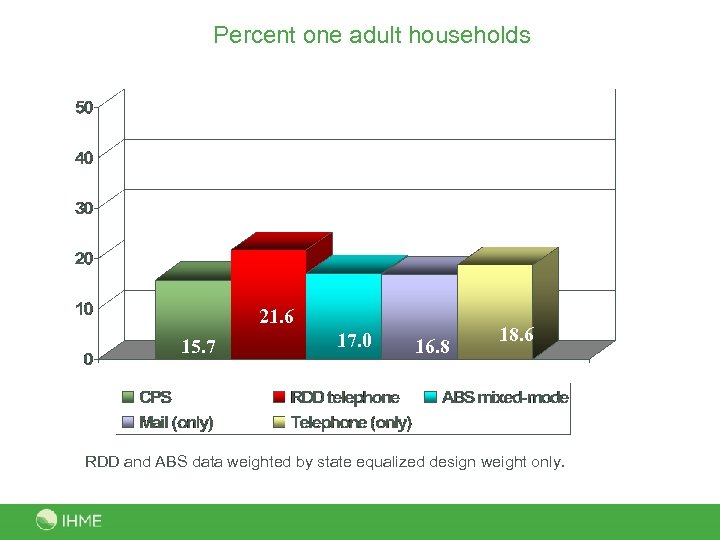
Percent one adult households 21. 6 15. 7 17. 0 16. 8 18. 6 RDD and ABS data weighted by state equalized design weight only.
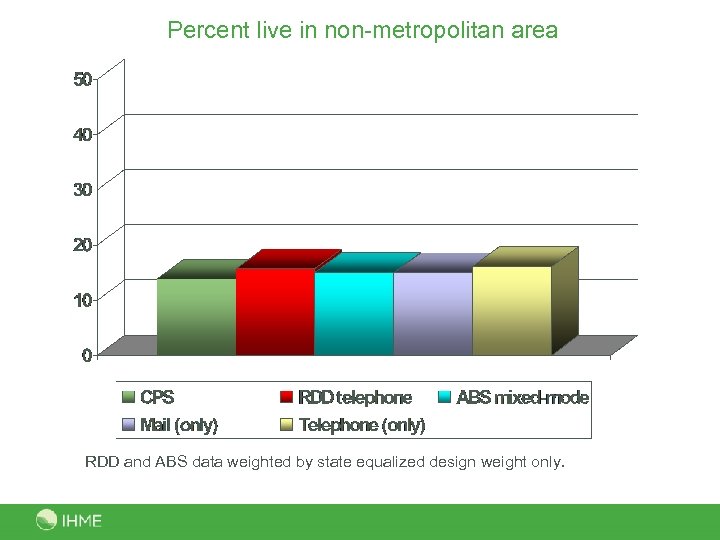
Percent live in non-metropolitan area 13. 8 15. 6 15. 0 14. 9 16. 1 RDD and ABS data weighted by state equalized design weight only.
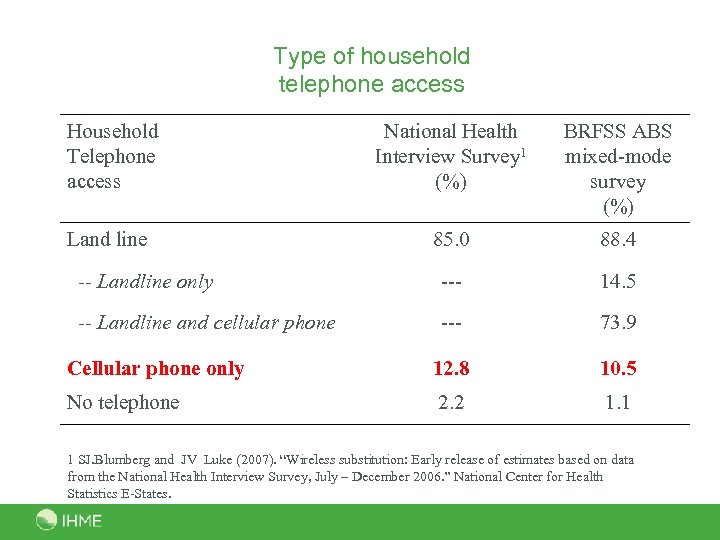
Type of household telephone access Household Telephone access National Health Interview Survey 1 (%) BRFSS ABS mixed-mode survey (%) Land line 85. 0 88. 4 -- Landline only --- 14. 5 -- Landline and cellular phone --- 73. 9 Cellular phone only 12. 8 10. 5 No telephone 2. 2 1. 1 1 SJ. Blumberg and JV Luke (2007). “Wireless substitution: Early release of estimates based on data from the National Health Interview Survey, July – December 2006. ” National Center for Health Statistics E-States.
Comparison of Survey Estimates
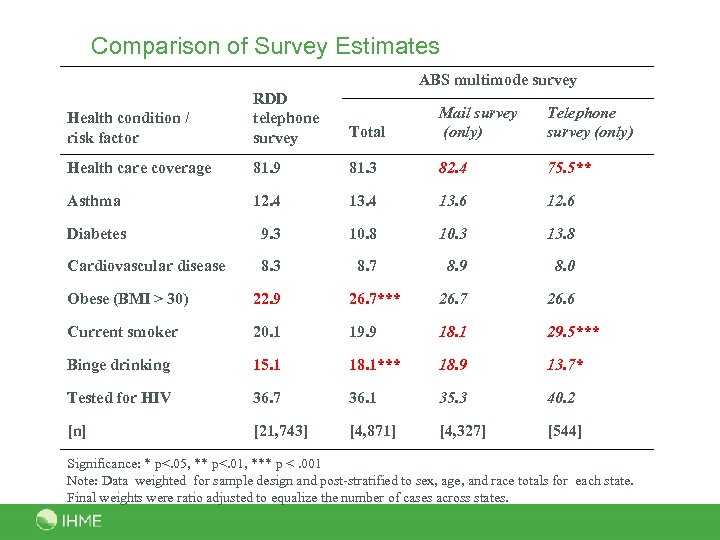
Comparison of Survey Estimates ABS multimode survey Health condition / risk factor RDD telephone survey Health care coverage Total Mail survey (only) Telephone survey (only) 81. 9 81. 3 82. 4 75. 5** Asthma 12. 4 13. 6 12. 6 Diabetes 9. 3 10. 8 10. 3 13. 8 Cardiovascular disease 8. 3 8. 7 8. 9 8. 0 Obese (BMI > 30) 22. 9 26. 7*** 26. 7 26. 6 Current smoker 20. 1 19. 9 18. 1 29. 5*** Binge drinking 15. 1 18. 1*** 18. 9 13. 7* Tested for HIV 36. 7 36. 1 35. 3 40. 2 [n] [21, 743] [4, 871] [4, 327] [544] Significance: * p<. 05, ** p<. 01, *** p <. 001 Note: Data weighted for sample design and post-stratified to sex, age, and race totals for each state. Final weights were ratio adjusted to equalize the number of cases across states.
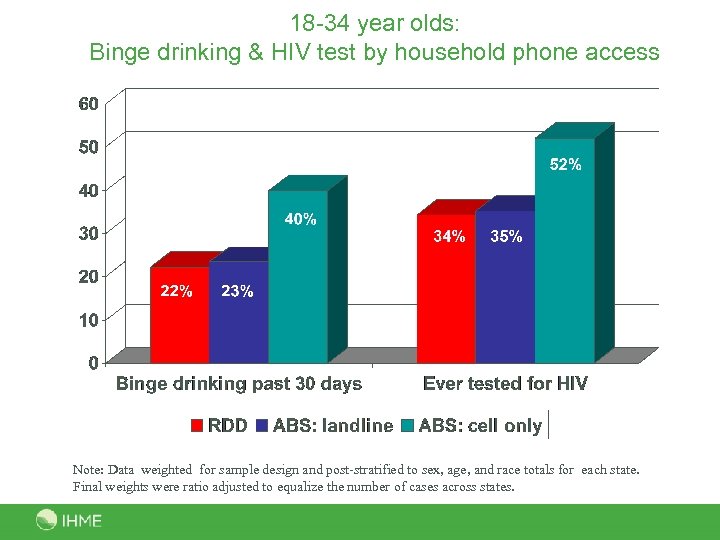
18 -34 year olds: Binge drinking & HIV test by household phone access Note: Data weighted for sample design and post-stratified to sex, age, and race totals for each state. Final weights were ratio adjusted to equalize the number of cases across states.
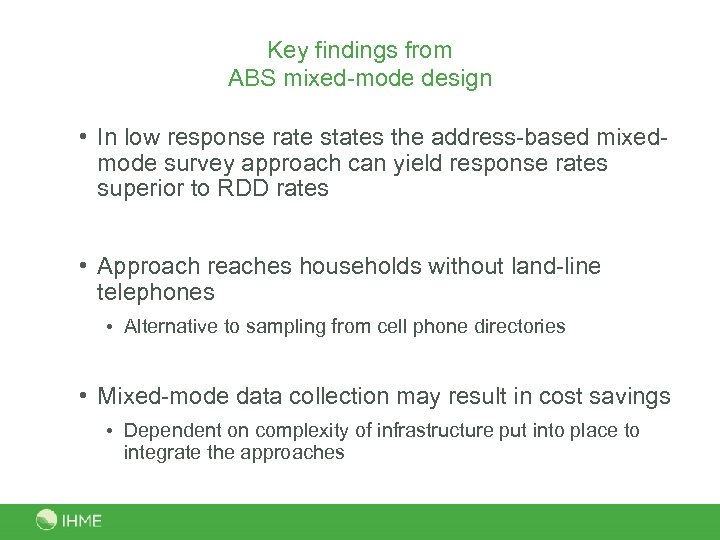
Key findings from ABS mixed-mode design • In low response rate states the address-based mixedmode survey approach can yield response rates superior to RDD rates • Approach reaches households without land-line telephones • Alternative to sampling from cell phone directories • Mixed-mode data collection may result in cost savings • Dependent on complexity of infrastructure put into place to integrate the approaches
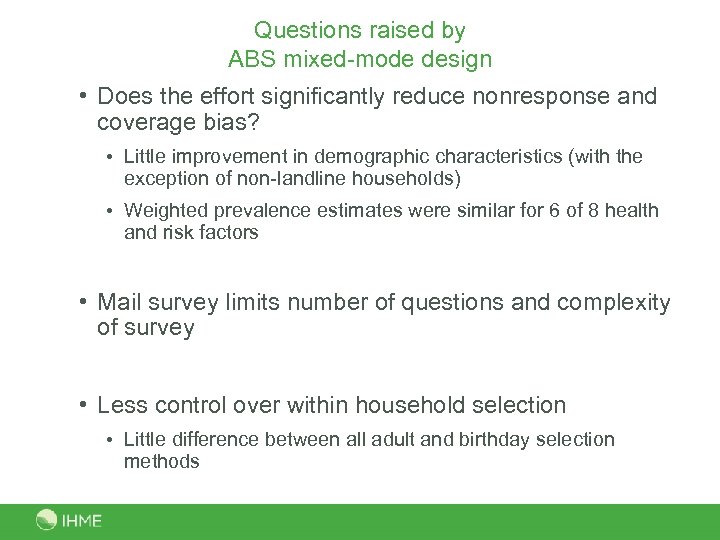
Questions raised by ABS mixed-mode design • Does the effort significantly reduce nonresponse and coverage bias? • Little improvement in demographic characteristics (with the exception of non-landline households) • Weighted prevalence estimates were similar for 6 of 8 health and risk factors • Mail survey limits number of questions and complexity of survey • Less control over within household selection • Little difference between all adult and birthday selection methods
What did we learn? • We can reach cell phone population • We can reach households with no telephones
Operational considerations
Cost for multimodes • Typically design mix of modes to: • Optimize coverage, response, and costs • Less expensive to most expensive • However: • Set-up costs with each mode • Per unit costs may be high even for “low cost” mode if few use the mode
Multimode: Operational Considerations • Population of interest • Sequential versus concurrent use of modes • Comparability • Within study • Across studies • Questionnaire design and reducing measurement error
Reaching population of interest • Need to understand certain elements of population you are trying to reach: • Physical accessibility • Telephone access – Landline – Cell phone • Literacy level • Web-enabled • How do respondents prefer to be interviewed? • Need to match mode combination to best fit population
Comparability across modes • Changing methods over time in longitudinal surveys • Confounding time and mode effects • Different modes for different subgroups • Are groups really different or is it mode effect? • Different modes for different samples • Comparing across surveys conducted using different modes
Reducing measurement error • Different modes have tradition of different formats • Question format has effect on response distribution • Consequences: Designers routinely enhance unwanted mode effects in mixed-mode surveys • What to do?
MULTI-MODE • MAY ALLOW FOR LOWER TOTAL SURVEY ERROR FOR GIVEN COST • BUT • ADDED COMPLEXITY MAY PRODUCE MISTAKES AND UN-EXPECTED CONSEQUENCES
ASSESSING MODE EFFECTS
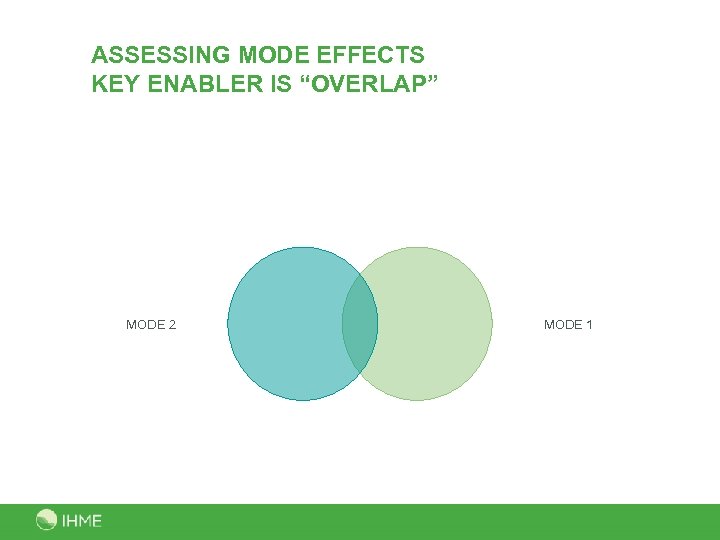
ASSESSING MODE EFFECTS KEY ENABLER IS “OVERLAP” MODE 2 MODE 1
ASSESSING MODE EFFECTS • MULTI MODE OVERLAPPING MEASURES SAME SAMPLE ELEMENTS • FEWER ASSUMPTIONS REQUIRED • ORDER EFFECTS AND CONDITIONING • MULTI MODE OVERLAPPING MEASURES DIFFERENT SAMPLE ELEMENTS BY SAME FRAME • SELECTION BIAS • OTHER RESPONSE RELATED FACTORS
Concluding thoughts • Producing valid survey estimates is a multiphase / multifaceted process • Assessing validity is often quite difficult, involving a mix of scientific rigor and subjective judgment • Ensuring validity is a necessity for the long-term survival of any health surveillance system
2008 BRFSS • Cell phone in 21 states (250+) • Mutli mode in 19 states (RDD as base)? • Physical measurements in 3 states?
Future of BRFSS • Mutli mode system • Web as a refusal conversion • Physical measurements in every state • Non response research

Ali H. Mokdad, Ph. D. mokdaa@u. washington. edu UNIVERSITY OF WASHINGTON
f419a158008b7d2fa1c641c42b80ffbe.ppt