
Project Work Touchstone 3 MAKING A SURVEY

- Размер: 372 Кб
- Количество слайдов: 10
Описание презентации Project Work Touchstone 3 MAKING A SURVEY по слайдам
Project Work Touchstone 3 MAKING A SURVEY
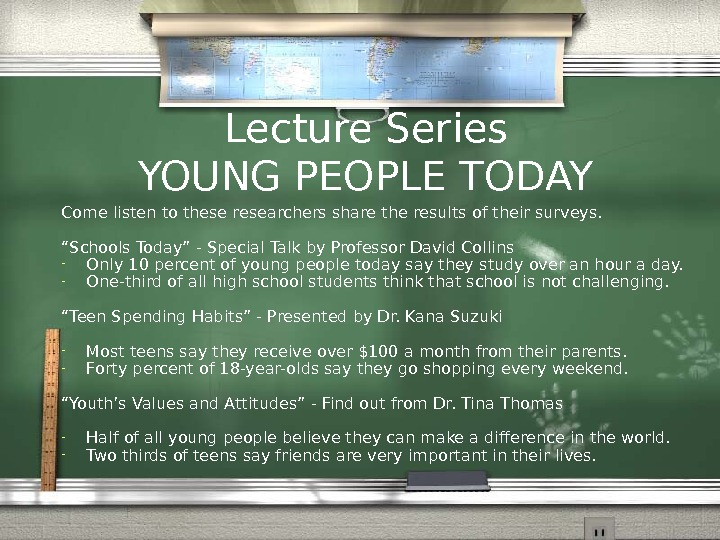
Lecture Series YOUNG PEOPLE TODAY Come listen to these researchers share the results of their surveys. “ Schools Today” — Special Talk by Professor David Collins — Only 10 percent of young people today say they study over an hour a day. — One-third of all high school students think that school is not challenging. “ Teen Spending Habits” — Presented by Dr. Kana Suzuki — Most teens say they receive over $100 a month from their parents. — Forty percent of 18 -year-olds say they go shopping every weekend. “ Youth’s Values and Attitudes” — Find out from Dr. Tina Thomas — Half of all young people believe they can make a difference in the world. — Two thirds of teens say friends are very important in their lives.
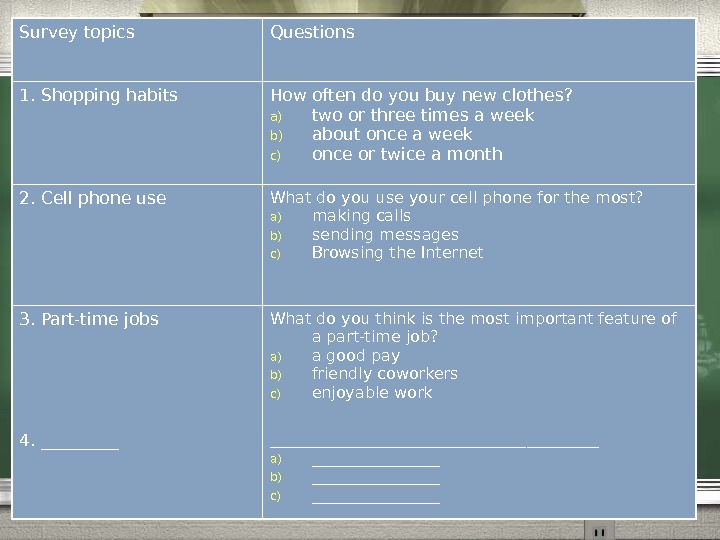
East West North 0102030405060708090 1 st Qtr 2 nd Qtr 3 rd Qtr 4 th Qtr. Survey topics Questions 1. Shopping habits How often do you buy new clothes? a) two or three times a week b) about once a week c) once or twice a month 2. Cell phone use What do you use your cell phone for the most? a) making calls b) sending messages c) Browsing the Internet 3. Part-time jobs What do you think is the most important feature of a part-time job? a) a good pay b) friendly coworkers c) enjoyable work 4. _________________________ a) ________ b) ________ c) ________
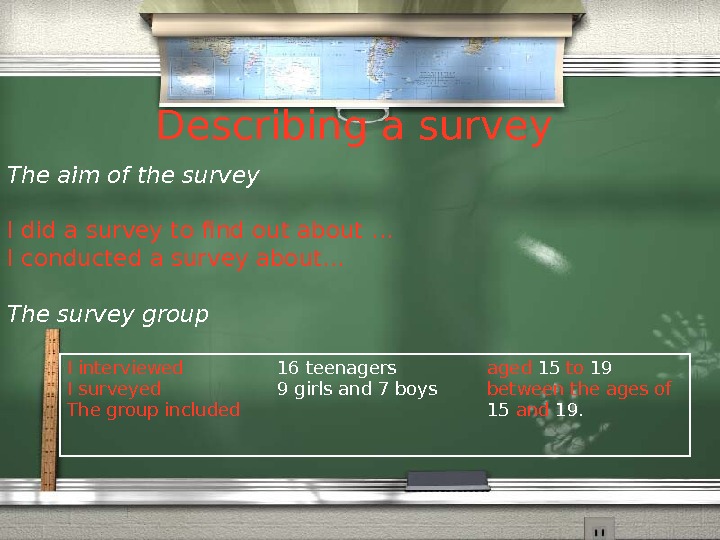
Describing a survey The aim of the survey I did a survey to find out about … I conducted a survey about… The survey group I interviewed I surveyed The group included 16 teenagers 9 girls and 7 boys aged 15 to 19 between the ages of 15 and 19.
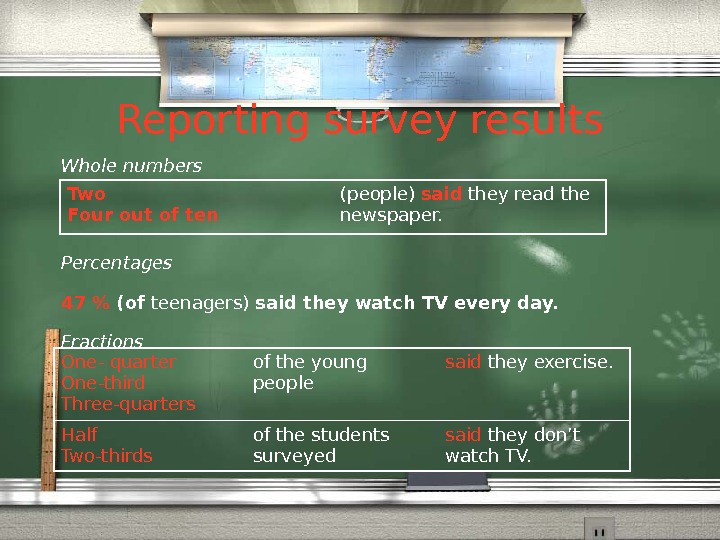
Reporting survey results Whole numbers Percentages 47 % (of teenagers) said they watch TV every day. Fractions Two Four out of ten (people) said they read the newspaper. One- quarter One-third Three-quarters of the young people said they exercise. Half Two-thirds of the students surveyed said they don’t watch TV.
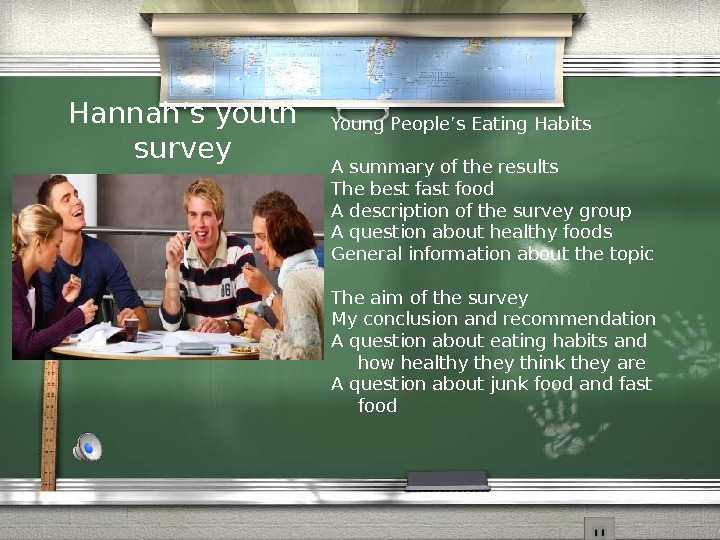
Hannah’s youth survey Young People’s Eating Habits A summary of the results The best fast food A description of the survey group A question about healthy foods General information about the topic The aim of the survey My conclusion and recommendation A question about eating habits and how healthy they think they are A question about junk food and fast food
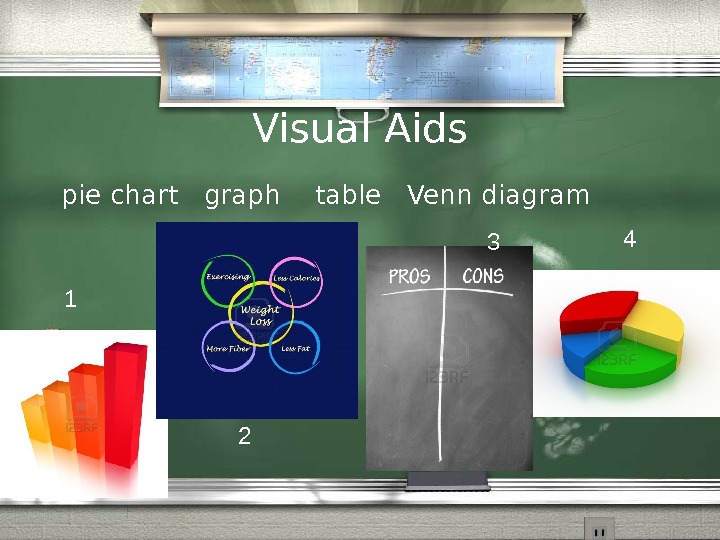
Visual Aids pie chart graph table Venn diagram
NOW DIVIDE IN PROJECT GROUPS! Each group shouldn’t be more than 5 students.
Brainstorming Theme of your project this term is FAMILY LIFE. Choose a survey topic. Write it in the center of the brainstorming map. Then brainstorm survey questions you can ask about the topic.
Survey your classmates 1. Talk to students from other project groups. 2. Make notes. 3. Be ready to prepare a draft 3 -5 -slide Power Point Presentation by the next class.