My Project Management Concepts.pptx
- Количество слайдов: 62


PROJECT MANAGEMENT CONCEPTS prof. Bushuyev S.

Project, Defined • A project is an endeavor to accomplish a specific objective through a unique set of interrelated tasks and the effective utilization of resources. • It has a well-defined objective stated in terms of scope, schedule, and costs. • Project s are “born” when a need is identified by the customer – the people or organization willing to provide funds to have the need satisfied. • It is the people (project manager and project team), not the procedures and techniques, that are critical to accomplishing the project objective. • Procedures and techniques are merely tools to help the people do their jobs.

Examples of Projects • Planning a wedding • Designing and implementing a computer system • Hosting a holiday party • Designing and producing a brochure • Executing an environmental clean-up of a contaminated site • Holding a high school reunion • Performing a series of surgeries on an accident victim
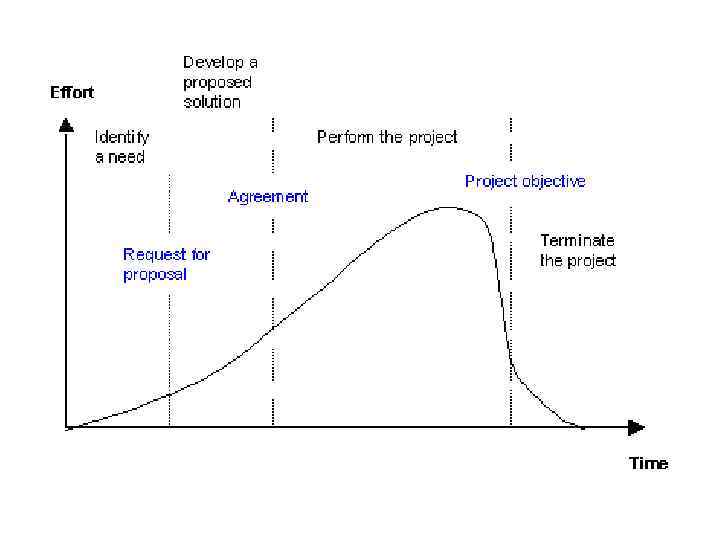

Phases of the Project Life Cycle 1 • The first phase involves the identification of a need, problem, or opportunity. – The need and requirements are usually written by the customer into a document called a request for proposal (RFP).

Phases of the Project Life Cycle 2 • The second phase is the development of a proposed solution to the need or problem. – This phase results in the submission of a proposal. – The customer and the winning contractor negotiate and sign a contract (agreement).

Phases of the Project Life Cycle 3 • The third phase is performing the project. – Different types of resources are utilized – Results in the accomplishment of the project objective

Phases of the Project Life Cycle 4 • The final phase is terminating the project. – Perform close-out activities – Evaluate performance – Invite customer feedback

• The Project Management Process The project management process means planning the work and then working the plan. – 7 steps of planning 1. Clearly define the project objective. 2. Divide and subdivide the project scope into major “pieces” 3. Define the specific activities for each piece (work package) 4. Graphically portray the activities that need to be performed fro each work package in order to accomplish the project objective – in the form of network diagram. 5. Make a time estimate for how long it will take to complete each activity – resources needed. 6. Make a cost estimate for each activity. 7. Calculate a project schedule and budget to determine whether the project can be completed within the required time, with the allotted founds, and with the available resources.

Project Control Process
 what activities")
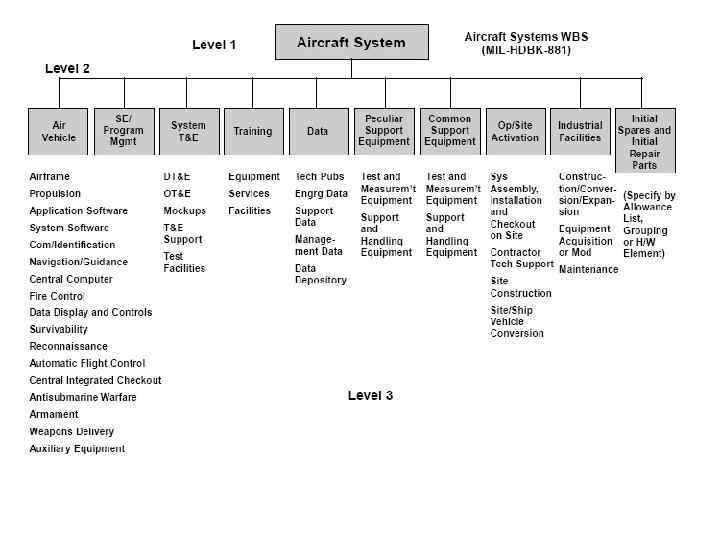
• • • Work Breakdown Structure The second step is to(WBS) what activities need determine to be performed. A list of all the activities must be developed. The WBS is a hierarchical tree of end items to be accomplished. A work item is one small piece of the project. A work package is the lowest-level item.

Microsoft Project WBS

1. Start new project • Turn on the Project Guide – On the Tools menu, click Options, and then click the Interface tab. – In the Project Guide settings section, select the Display Project Guide check box. • Manually set up a new project

Project – Project Information… or View – Turn on project guide… http: //office. microsoft. com/en-us/project/HA 102639631033. aspx

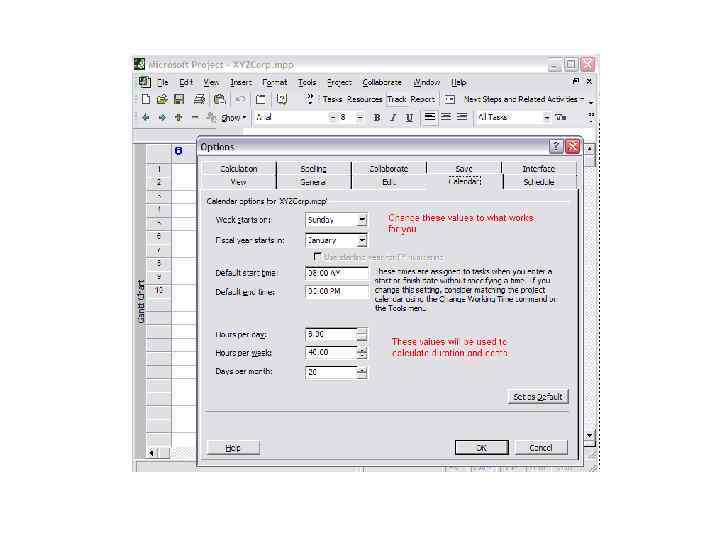
Tools - Options

2. Tasks • There are four major types of tasks: 1. Summary tasks - contain subtasks and their related properties 2. Subtasks - are smaller tasks that are a part of a summary task 3. Recurring tasks - are tasks that occur at regular intervals 4. Milestones - are tasks that are set to zero duration and are like interim goals in the project

Add tasks

Insert new task

Outlining tasks

Tools – Options… - check “Show project summary task”

Predecessor

Tasks can be linked in four ways • Finish-Start FS Predecessor finishes and the other starts • Start-Finish S-F Task begins at the same time as its predecessor • Finish-Finish F-F Both tasks finish at the same time • Start-Start S-S Start of the predecessor determines when the other starts

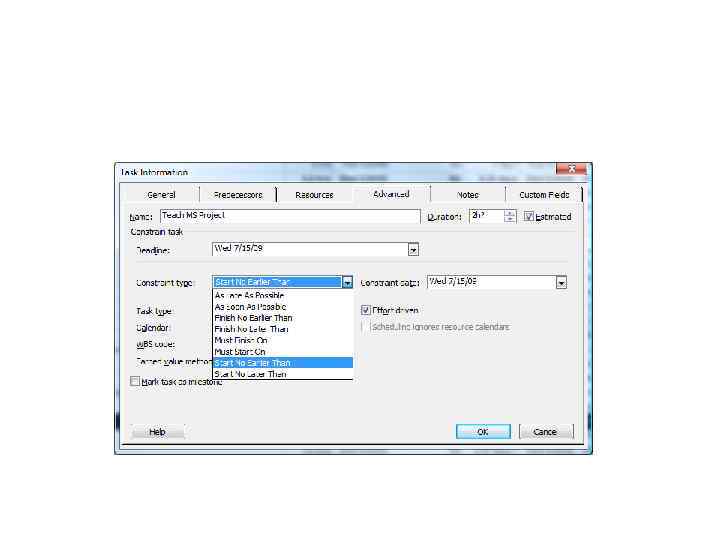
Constraints • Certain tasks need to be completed within a certain date. • Intermediate deadlines may need to be specified. • By assigning constraints to a task you can account for scheduling problems. • There about 8 types of constraints and they come under the flexible or inflexible category.

3. Managing task
, • a pessimistic value, D(p)")
Defining a Timeline • Find an optimistic value, D(o), • a pessimistic value, D(p) and • a realistic value, D(r). • Then: Duration = ( D(o) + D(p) + 4 x D(r) ) / 6

• The importance of tracking progress Techniques to manage projects effectively: Critical Path Management (CPM) and Program Evaluation and Review Techniques (PERT). They are similar and you will now often find the technique referred to as: CPM/PERT. The technique involves using network models to trace the links between tasks and to identify the tasks which are critical to meeting the deadlines. Once you've identified the critical path, any delay on any part of the critical path will cause a delay in the whole project. It is where managers must concentrate their efforts. – In MS Project, you use the Tracking Gantt diagram to show the critical path in red and you can see the PERT diagram by looking at the Network view. – –

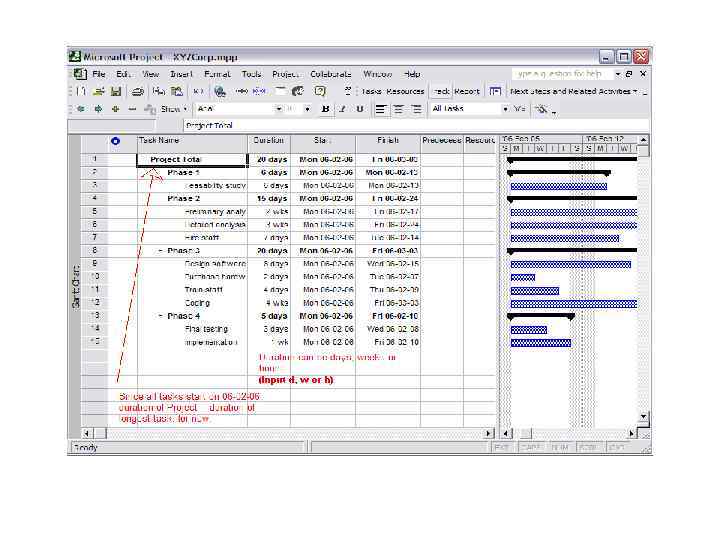
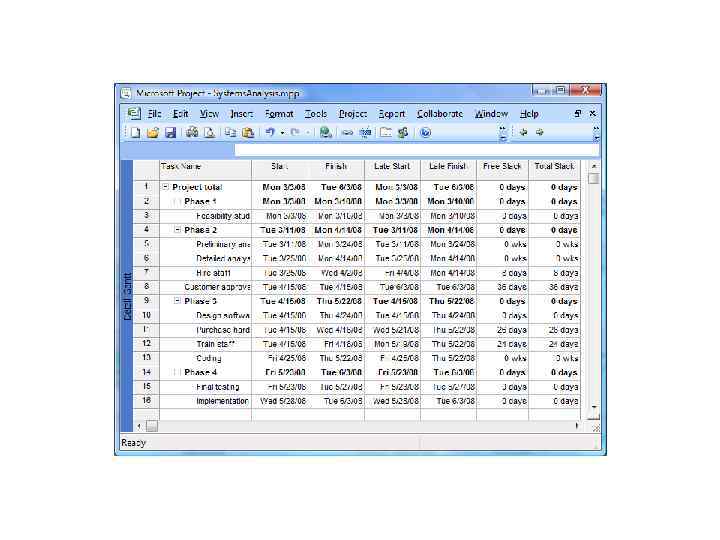
Gantt Chart View – critical path • A Gantt chart is a type of bar chart that illustrates a project schedule. • Critical path: View – More views… - Detail Gant

PERT diagram - Network view

Views • Views allow you to examine your project from different angles based on what information you want displayed at any given time. • You can use a combination of views in the same window at the same time. • Project Views are categorized into two types: • Task Views (5 types) • Resource Views (3 types)

Saving a baseline • Baseline plan: The original project plans used to track progress on a project. • The baseline plan is a snapshot of your schedule at the time that you save the baseline and includes information about tasks, resources, and assignments. • You can set a baseline for your project, enabling you to compare your progress with the original plan and any additional baselines you set at milestones throughout your project.

Saving a Baseline • Tools – Tracking – Save Baseline… http: //office. microsoft. com/home/video. aspx? assetid=ES 102776241033&width=1024&height=768&startindex=0&CTT=11&Origin=HA 102751251033&ap p=WINPROJ&ver=12

RESOURCES

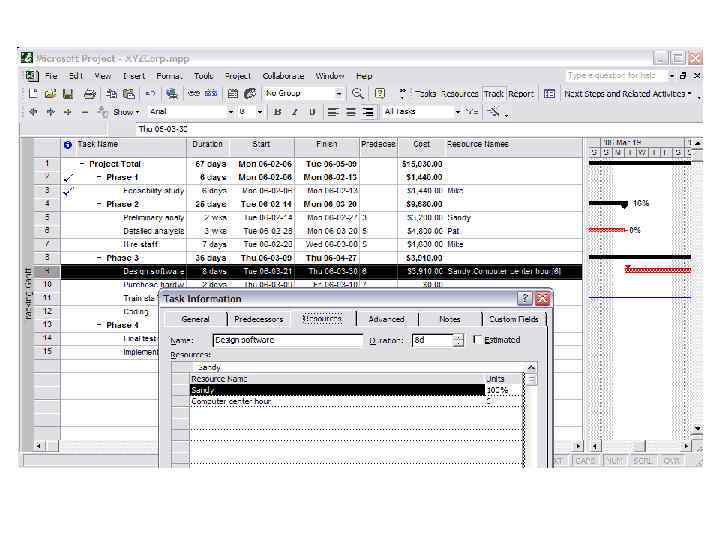
Manage the project • resources: • • Resources are of three types: • people equipment supplies – work resources, material resources and cost resources. • • • Work resources complete tasks by expending time on them. They are usually people and equipment that have been assigned to work on the project (you track their participation by the amount of time they spend). Material resources are supplies and stocks that are needed to complete a project. You assign material resources by the quantity that you need: two tons of gravel or 300 gallons of diesel fuel, for instance. Because materials aren't measured by time, quantities usually affect only the cost of your project. Materials affect dates or duration only when you have to wait for those materials to become available. Cost resources are the new kid on the Project 2007 block, and they're strictly cost; no time, no quantities—just dollars. Expenses, such as travel or fees, increase the project price tag, but they aren't associated with work or material resources. You must start by identifying the resources available along with their costs. Resource costs will be multiplied by duration to calculate project costs. You have to open the Resource sheet to specify the project resources and costs.
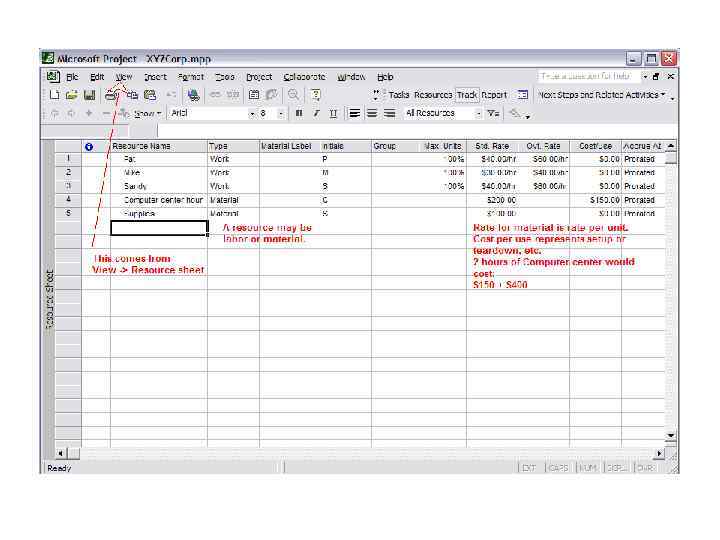

Fields in the Resource Sheet may be blank or contain different types of information depending on the type of resource. For example, a work resource doesn't have a Material label, and costs are calculated initially as dollars per hour. Material resources have a cost per unit—per pound, gallon, or piece—and the Material label field defines the units. Cost resources receive a value only when you assign them to tasks.
 • On the View menu,")
Use the Detail Gantt view to find slack (float) • On the View menu, click More Views. • In the Views list, click Detail Gantt, and then click Apply. • On the View menu, point to Table, and then click Schedule. In the chart portion of the view, slack appears as thin bars to the right of tasks, with slack values adjoining the regular Gantt bars.

To shorten a project schedule • Reduce duration of activities on critical path – More resources – Change their scope

Technically Constrained Activity Sequence

Resource-Constrained Planning

Painting Project Showing Needed Resources

Create a budget for your project • Step 1: Create budget resources for your project • Step 2: Assign the budget resources to the project summary task • Step 3: Enter values for the budget resources • Step 4: Categorize resource costs according to their budget type • Step 5: Group resources to view how they compare against the budget

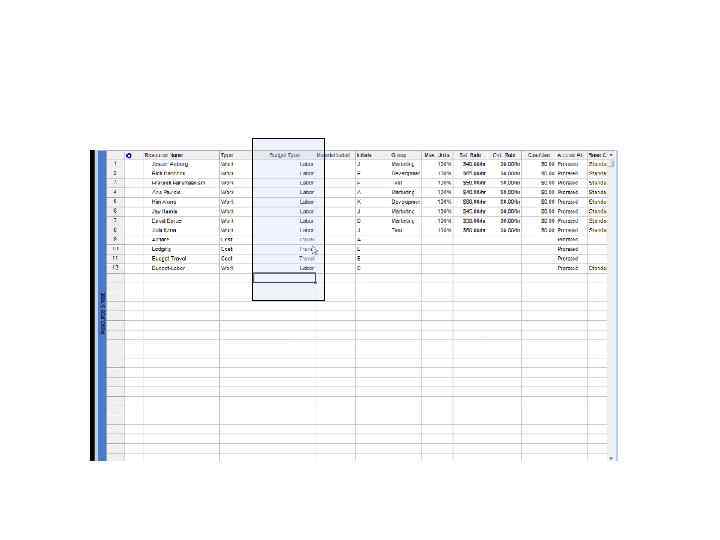
Step 1: Create budget resources for your project • Create Budget-Travel and Budget-Labor on your resource sheet View – Resource Sheet

Check the check box for Budget

Step 2: Assign the budget resources to the project summary task • Gent chart view – Tools – Options – View Tab – Show project summary task (check box) • Task is added to the top of the project list. Select this task. • Click on Button “Assign Resources” • Select the two budget resources you created earlier and click “Assign”

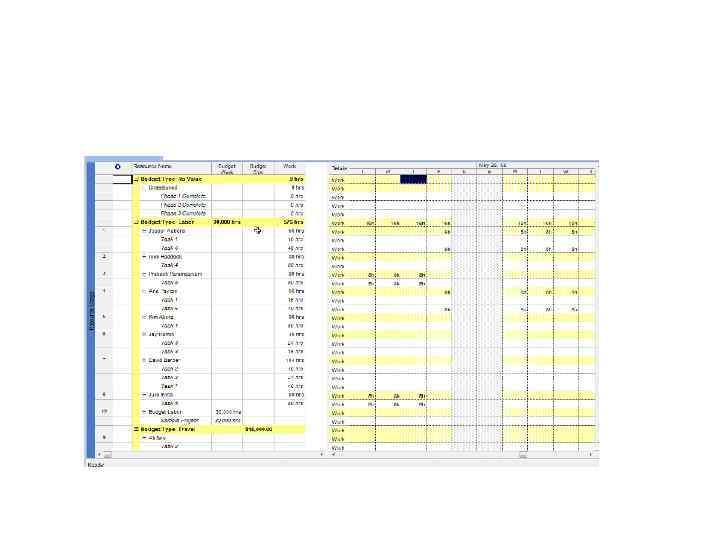
Step 3: Enter values for the budget resources • View – Resource Usage view • Add Budget Cost and Budget Work fields (columns): – Insert – Column – Budget Cost and Budget Work – Add values for travel and Labor cost
")
Add: 15, 000 for Budget-Travel and 30, 000 for Budget-Labor (Budget Work column)
")
Step 4: Categorize resource costs according to their budget type Create custom filed (column) • Open Resource Sheet view • Tools – Customize – Fields • Choose Resource text filed and rename: Budget Type

Select Option Button: Roll down unless manually entered Add field to the resource sheet view: Insert – column – choose Budget Type column ( you can now identify your resources as labor or travel

Step 5: Group resources to view how they compare against the budget • Resource Usage view • Project – Group by: No Group – Customize Group By… - Select the Budget Type field

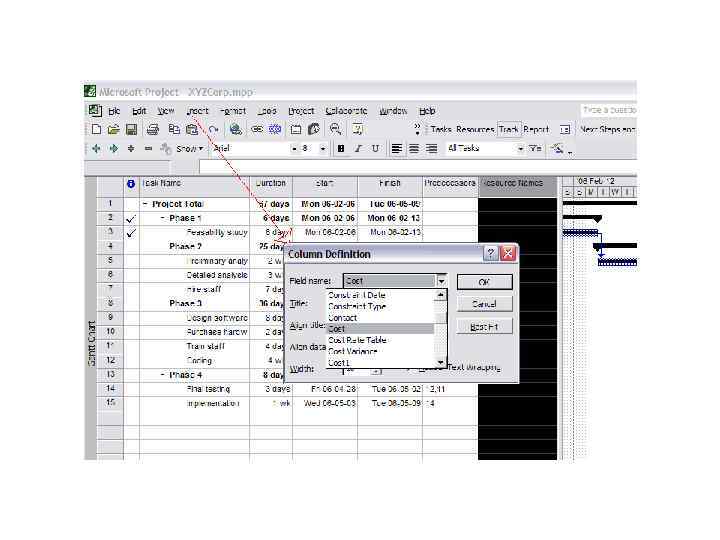
Viewing Project Cost Information • Right click the Select All button and click Cost • Or • View – Table: Entry – Cost

Reports • Cost Report: Reports - Reports – Costs – Cash Flow: – Edit – Column list • Project Summary report: Reports – Overview – Project Summary

Resource Usage Report

Current Activity Reports
My Project Management Concepts.pptx