fde212893bd99b8e7ef5c513262d5107.ppt
- Количество слайдов: 25
 Project F 2: Application Performance Analysis John Curreri Seth Koehler Rafael Garcia
 Outline Introduction HLL runtime performance analysis tool Motivation Instrumentation Framework Visualization Case study Application mappers Historical background Performance analysis today Molecular Dynamics Conclusions & References
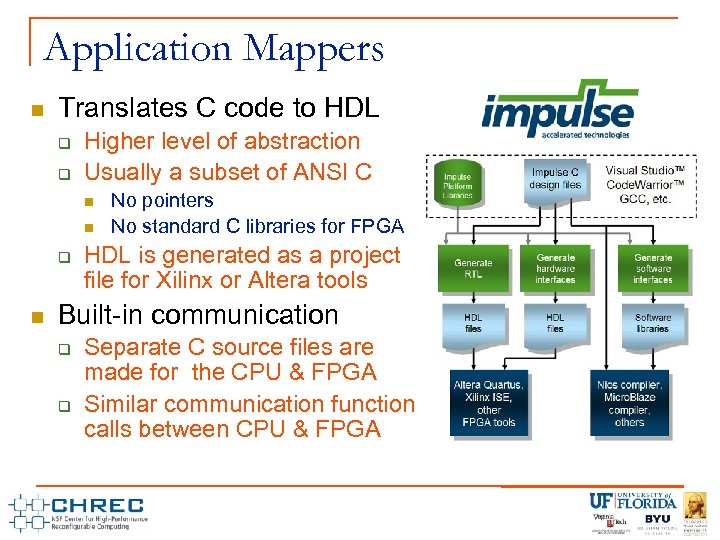 Application Mappers Translates C code to HDL Higher level of abstraction Usually a subset of ANSI C No pointers No standard C libraries for FPGA HDL is generated as a project file for Xilinx or Altera tools Built-in communication Separate C source files are made for the CPU & FPGA Similar communication function calls between CPU & FPGA
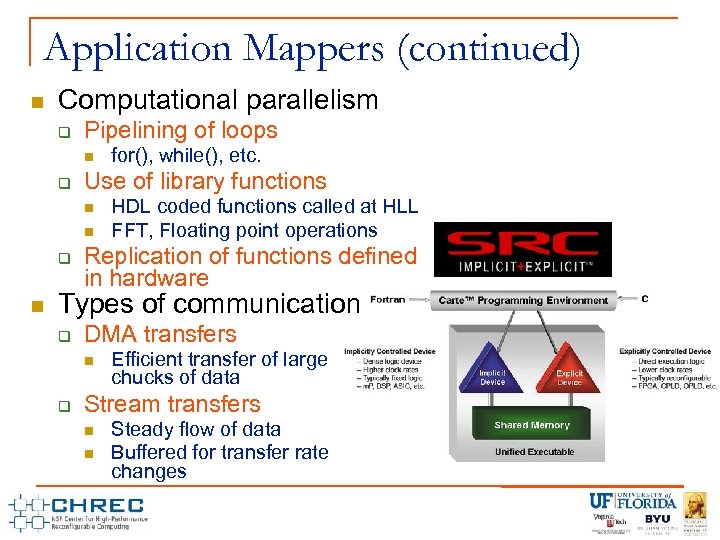 Application Mappers (continued) Computational parallelism Pipelining of loops Use of library functions for(), while(), etc. HDL coded functions called at HLL FFT, Floating point operations Replication of functions defined in hardware Types of communication DMA transfers Efficient transfer of large chucks of data Stream transfers Steady flow of data Buffered for transfer rate changes
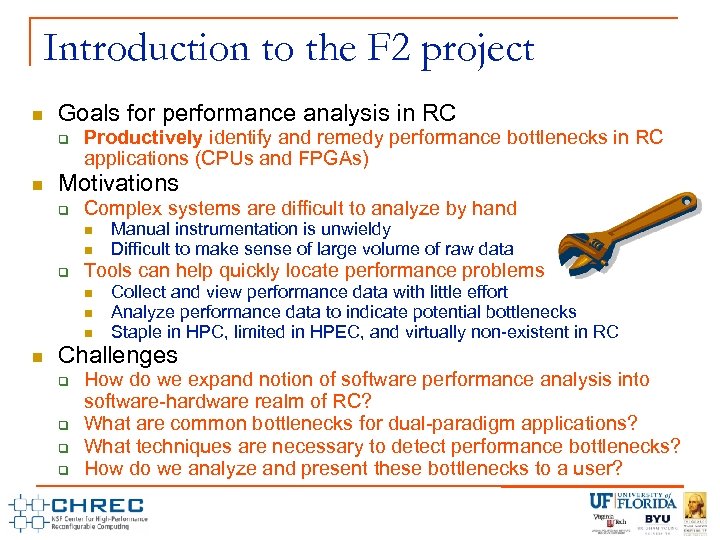 Introduction to the F 2 project Goals for performance analysis in RC Productively identify and remedy performance bottlenecks in RC applications (CPUs and FPGAs) Motivations Complex systems are difficult to analyze by hand Tools can help quickly locate performance problems Manual instrumentation is unwieldy Difficult to make sense of large volume of raw data Collect and view performance data with little effort Analyze performance data to indicate potential bottlenecks Staple in HPC, limited in HPEC, and virtually non-existent in RC Challenges How do we expand notion of software performance analysis into software-hardware realm of RC? What are common bottlenecks for dual-paradigm applications? What techniques are necessary to detect performance bottlenecks? How do we analyze and present these bottlenecks to a user?
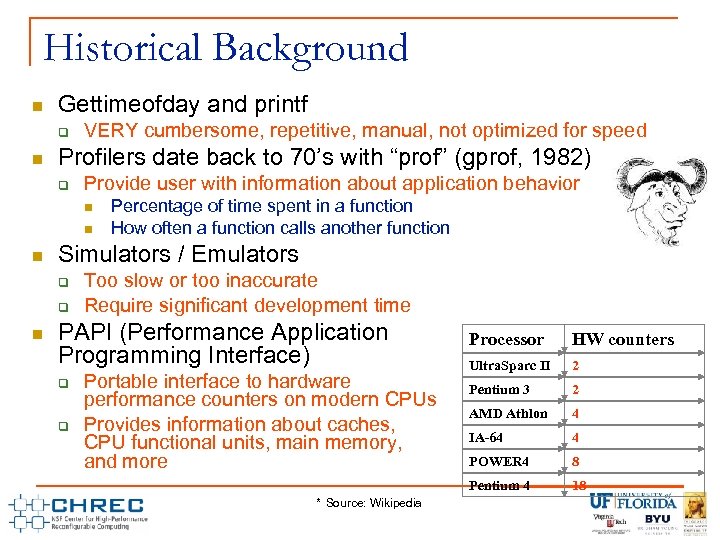 Historical Background Gettimeofday and printf VERY cumbersome, repetitive, manual, not optimized for speed Profilers date back to 70’s with “prof” (gprof, 1982) Provide user with information about application behavior Simulators / Emulators Percentage of time spent in a function How often a function calls another function Too slow or too inaccurate Require significant development time PAPI (Performance Application Programming Interface) * Source: Wikipedia HW counters Ultra. Sparc II 2 Pentium 3 2 AMD Athlon 4 IA-64 4 POWER 4 8 Pentium 4 Portable interface to hardware performance counters on modern CPUs Provides information about caches, CPU functional units, main memory, and more Processor 18
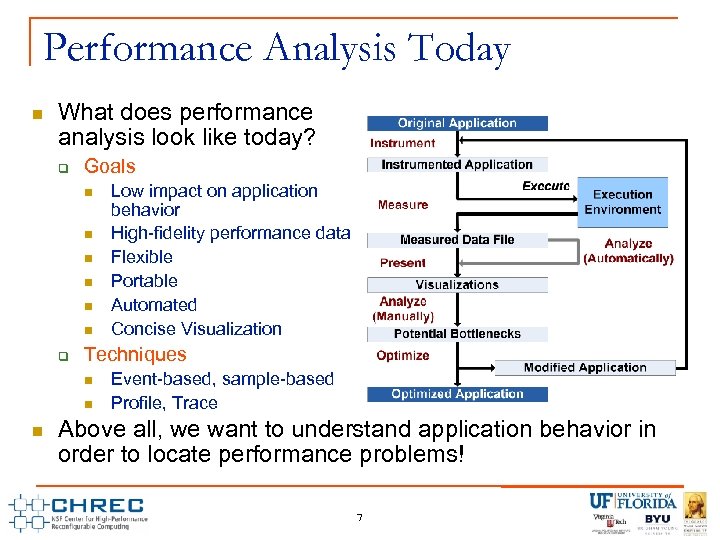 Performance Analysis Today What does performance analysis look like today? Goals Techniques Low impact on application behavior High-fidelity performance data Flexible Portable Automated Concise Visualization Event-based, sample-based Profile, Trace Above all, we want to understand application behavior in order to locate performance problems! 7
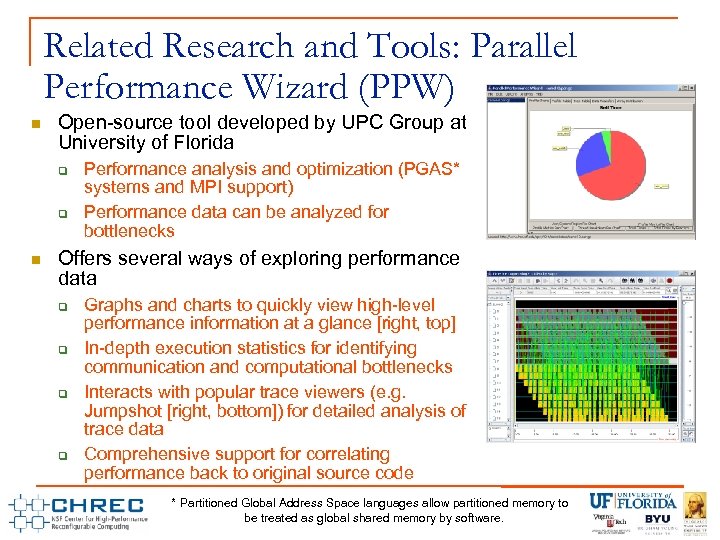 Related Research and Tools: Parallel Performance Wizard (PPW) Open-source tool developed by UPC Group at University of Florida Performance analysis and optimization (PGAS* systems and MPI support) Performance data can be analyzed for bottlenecks Offers several ways of exploring performance data Graphs and charts to quickly view high-level performance information at a glance [right, top] In-depth execution statistics for identifying communication and computational bottlenecks Interacts with popular trace viewers (e. g. Jumpshot [right, bottom]) for detailed analysis of trace data Comprehensive support for correlating performance back to original source code * Partitioned Global Address Space languages allow partitioned memory to be treated as global shared memory by software.
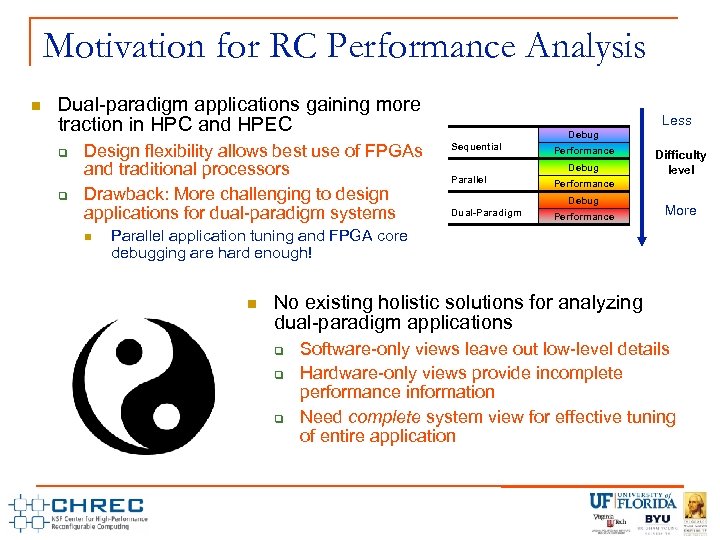 Motivation for RC Performance Analysis Dual-paradigm applications gaining more traction in HPC and HPEC Design flexibility allows best use of FPGAs and traditional processors Drawback: More challenging to design applications for dual-paradigm systems Less Debug Sequential Performance Debug Parallel Performance Debug Dual-Paradigm Difficulty level Performance More Parallel application tuning and FPGA core debugging are hard enough! No existing holistic solutions for analyzing dual-paradigm applications Software-only views leave out low-level details Hardware-only views provide incomplete performance information Need complete system view for effective tuning of entire application
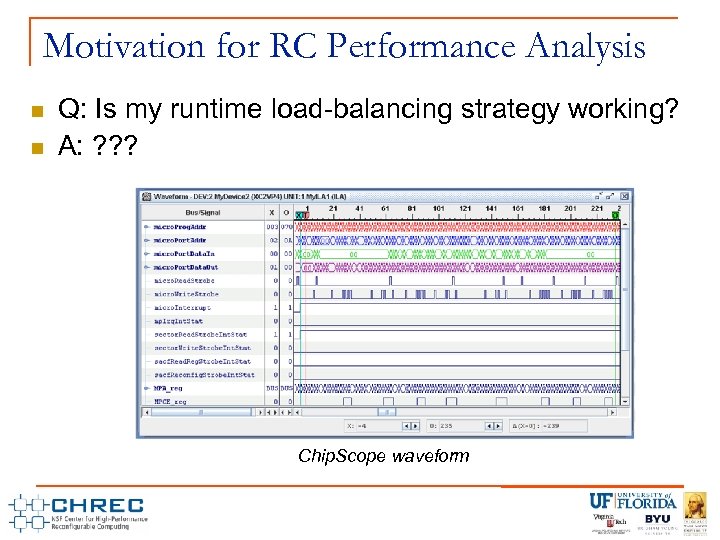 Motivation for RC Performance Analysis Q: Is my runtime load-balancing strategy working? A: ? ? ? Chip. Scope waveform
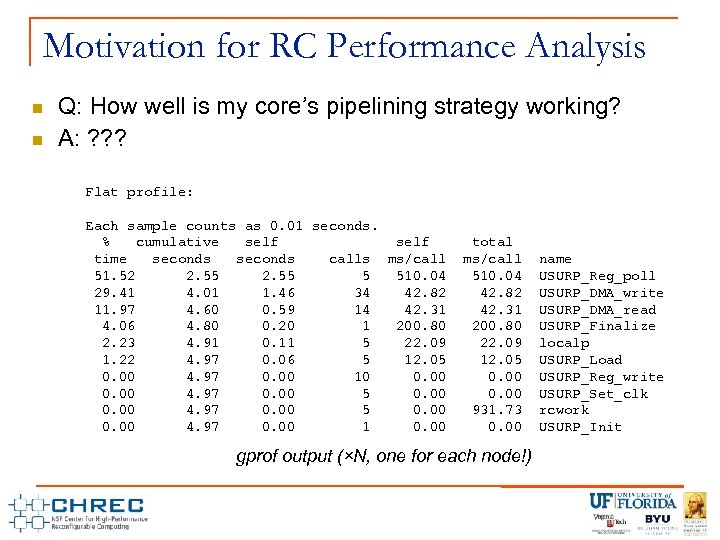 Motivation for RC Performance Analysis Q: How well is my core’s pipelining strategy working? A: ? ? ? Flat profile: Each sample counts as 0. 01 seconds. % cumulative self time seconds calls ms/call 51. 52 2. 55 5 510. 04 29. 41 4. 01 1. 46 34 42. 82 11. 97 4. 60 0. 59 14 42. 31 4. 06 4. 80 0. 20 1 200. 80 2. 23 4. 91 0. 11 5 22. 09 1. 22 4. 97 0. 06 5 12. 05 0. 00 4. 97 0. 00 10 0. 00 4. 97 0. 00 5 0. 00 4. 97 0. 00 1 0. 00 total ms/call 510. 04 42. 82 42. 31 200. 80 22. 09 12. 05 0. 00 931. 73 0. 00 gprof output (×N, one for each node!) name USURP_Reg_poll USURP_DMA_write USURP_DMA_read USURP_Finalize localp USURP_Load USURP_Reg_write USURP_Set_clk rcwork USURP_Init
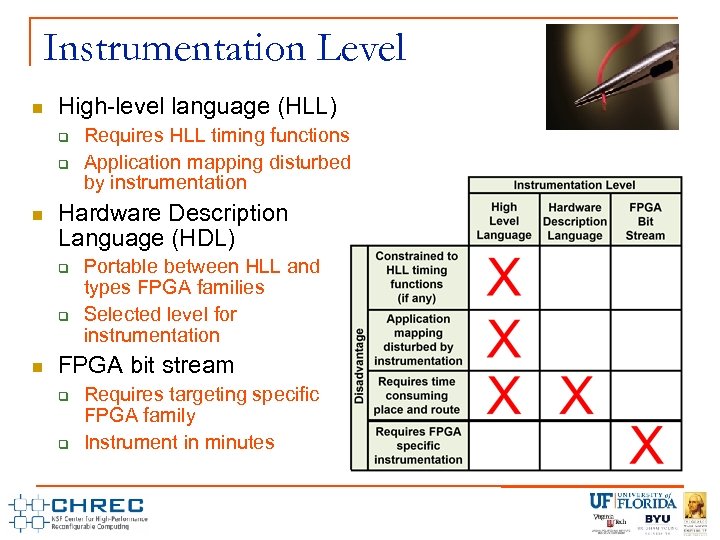 Instrumentation Level High-level language (HLL) Hardware Description Language (HDL) Requires HLL timing functions Application mapping disturbed by instrumentation Portable between HLL and types FPGA families Selected level for instrumentation FPGA bit stream Requires targeting specific FPGA family Instrument in minutes
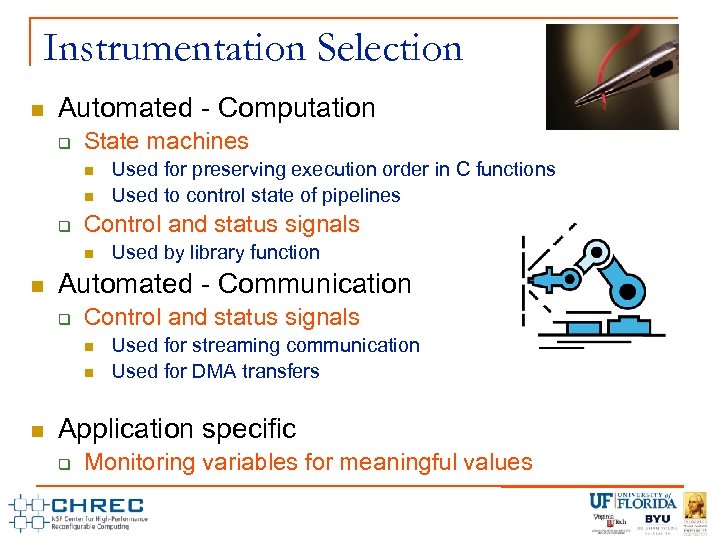 Instrumentation Selection Automated - Computation State machines Control and status signals Used by library function Automated - Communication Control and status signals Used for preserving execution order in C functions Used to control state of pipelines Used for streaming communication Used for DMA transfers Application specific Monitoring variables for meaningful values
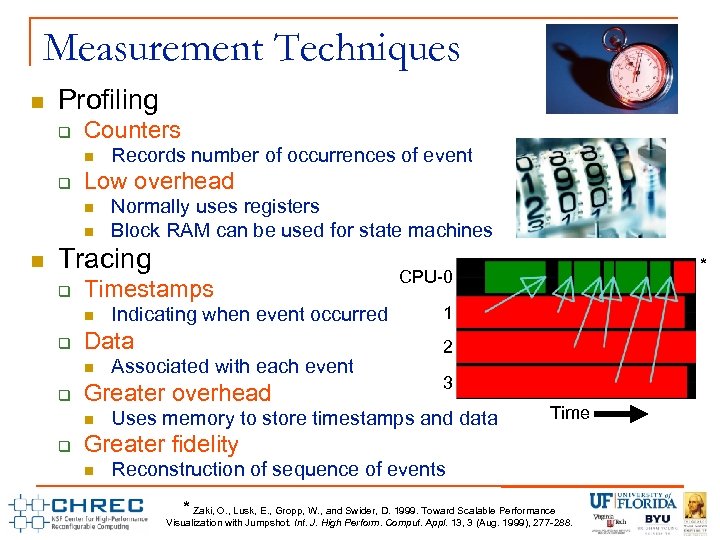 Measurement Techniques Profiling Counters Low overhead Records number of occurrences of event Normally uses registers Block RAM can be used for state machines Tracing Timestamps Data Associated with each event Greater overhead Indicating when event occurred * CPU-0 1 2 3 Uses memory to store timestamps and data Time Greater fidelity Reconstruction of sequence of events * Zaki, O. , Lusk, E. , Gropp, W. , and Swider, D. 1999. Toward Scalable Performance Visualization with Jumpshot. Int. J. High Perform. Comput. Appl. 13, 3 (Aug. 1999), 277 -288.
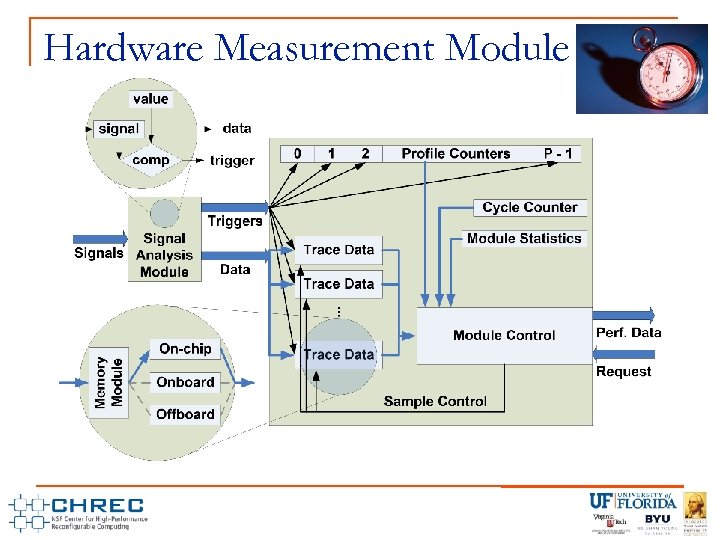 Hardware Measurement Module
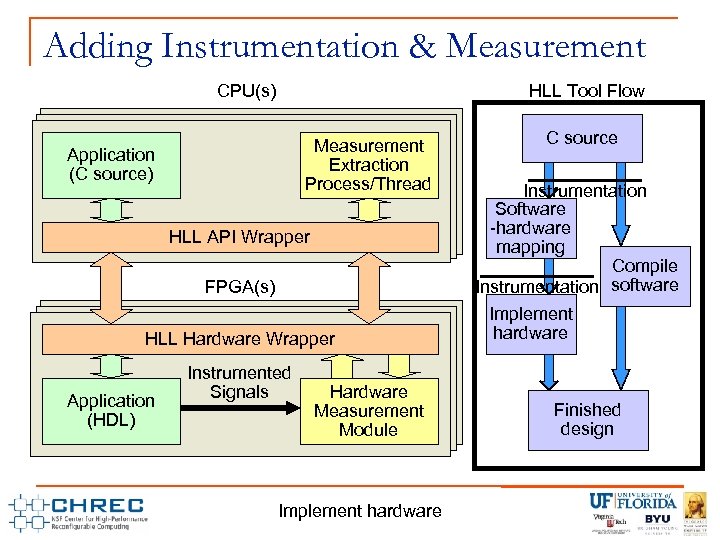 Adding Instrumentation & Measurement CPU(s) HLL Tool Flow Measurement Extraction Process/Thread Application (C source) HLL API Wrapper FPGA(s) HLL Hardware Wrapper Application (C(HDL) source) Instrumented Signals C source Instrumentation Software -hardware mapping Compile Instrumentation software Implement hardware Hardware Measurement Loopback Module (C source) (HDL) C source for FPGAhardware source Instrumentation added. Project HDL Instrumentation added to HDL Uninstrumented to C to Implement mapped Finished design
 Reverse Mapping & Analysis Mapping of HDL data back to HLL Variable name-matching Observing scope and other patterns Bottleneck detection Load-balancing of replicated functions Monitoring for pipeline stalls Detecting streaming communication stalls Finding shared-memory contention
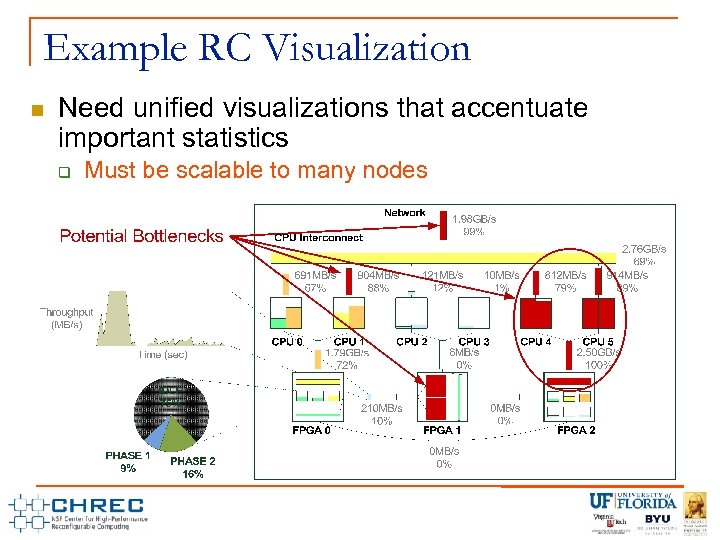 Example RC Visualization Need unified visualizations that accentuate important statistics Must be scalable to many nodes
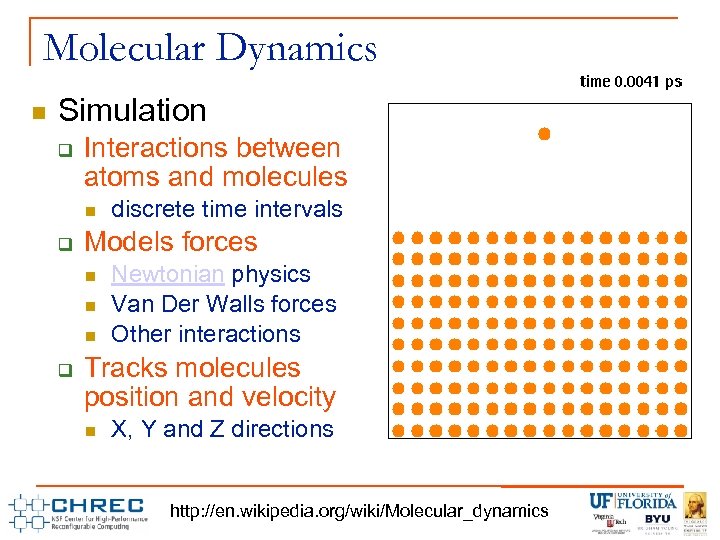 Molecular Dynamics Simulation Interactions between atoms and molecules Models forces discrete time intervals Newtonian physics Van Der Walls forces Other interactions Tracks molecules position and velocity X, Y and Z directions http: //en. wikipedia. org/wiki/Molecular_dynamics
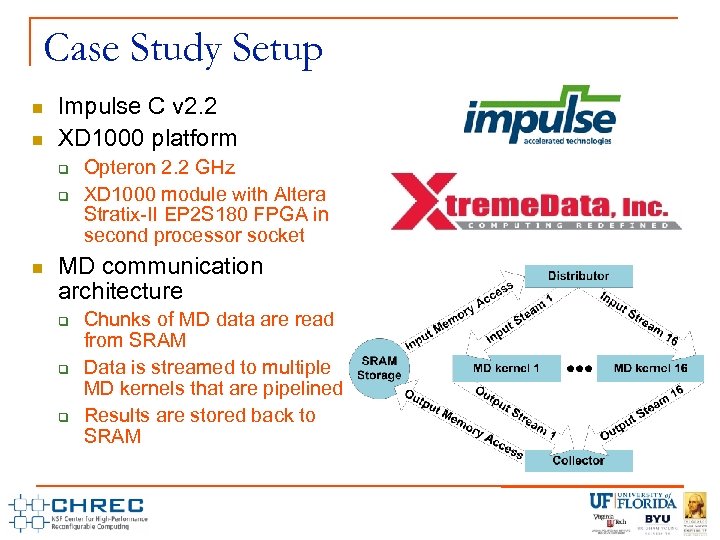 Case Study Setup Impulse C v 2. 2 XD 1000 platform Opteron 2. 2 GHz XD 1000 module with Altera Stratix-II EP 2 S 180 FPGA in second processor socket MD communication architecture Chunks of MD data are read from SRAM Data is streamed to multiple MD kernels that are pipelined Results are stored back to SRAM
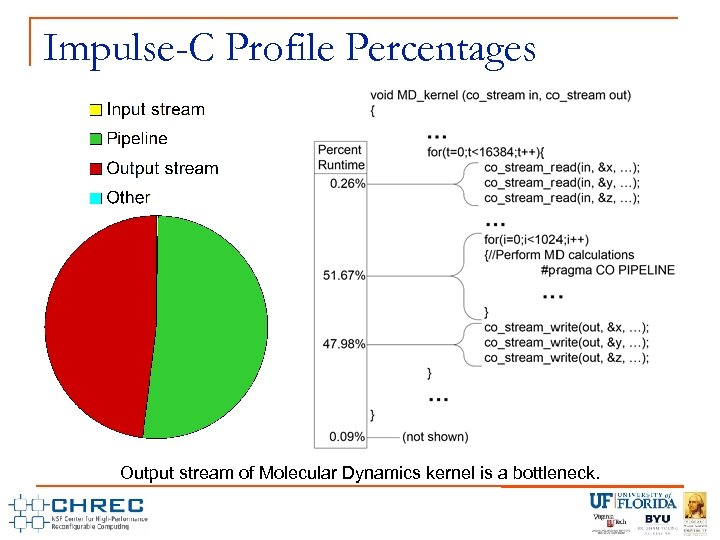 Impulse-C Profile Percentages Output stream of Molecular Dynamics kernel is a bottleneck.
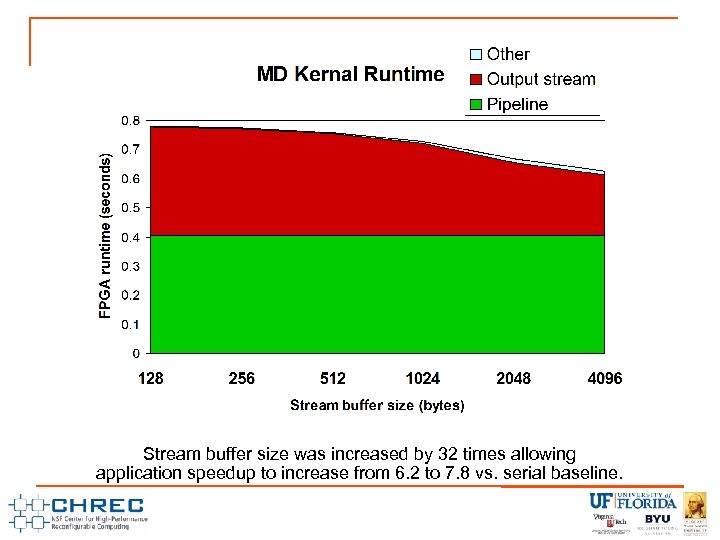 Stream buffer size was increased by 32 times allowing application speedup to increase from 6. 2 to 7. 8 vs. serial baseline.
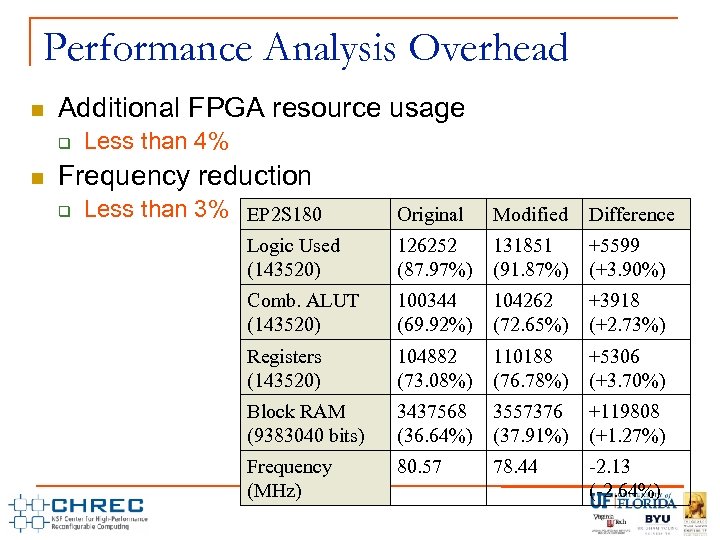 Performance Analysis Overhead Additional FPGA resource usage Less than 4% Frequency reduction Less than 3% EP 2 S 180 Original Modified Difference Logic Used (143520) 126252 (87. 97%) 131851 (91. 87%) +5599 (+3. 90%) Comb. ALUT (143520) 100344 (69. 92%) 104262 (72. 65%) +3918 (+2. 73%) Registers (143520) 104882 (73. 08%) 110188 (76. 78%) +5306 (+3. 70%) Block RAM (9383040 bits) 3437568 (36. 64%) 3557376 (37. 91%) +119808 (+1. 27%) Frequency (MHz) 80. 57 78. 44 -2. 13 (-2. 64%)
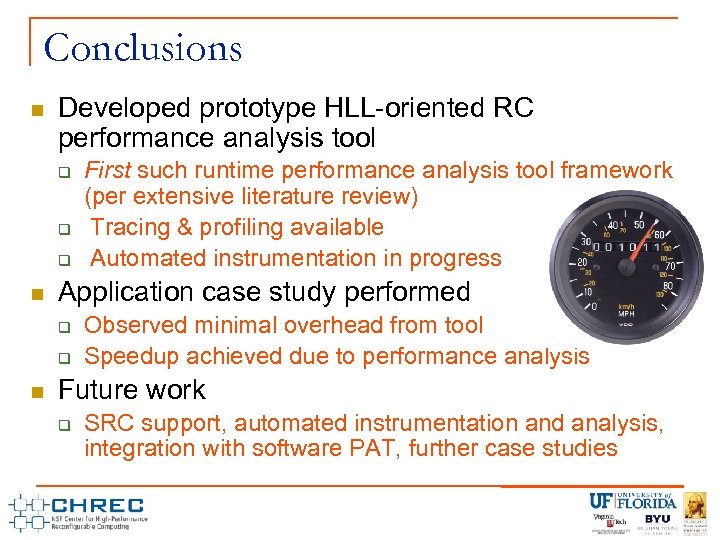 Conclusions Developed prototype HLL-oriented RC performance analysis tool Application case study performed First such runtime performance analysis tool framework (per extensive literature review) Tracing & profiling available Automated instrumentation in progress Observed minimal overhead from tool Speedup achieved due to performance analysis Future work SRC support, automated instrumentation and analysis, integration with software PAT, further case studies
 References Paul Graham, Brent Nelson, and Brad Hutchings. Instrumenting bitstreams for debugging FPGA circuits. In Proc. of the 9 th Annual IEEE Symposium on Field-Programmable Custom Computing Machines (FCCM), pages 41 -50, Washington, DC, USA, Apr. 2001. IEEE Computer Society. Sameer S. Shende and Allen D. Malony. The Tau parallel performance system. International Journal of High Performance Computing Applications (HPCA), 20(2): 287311, May 2006. C. Eric. Wu, Anthony Bolmarcich, Marc Snir, David. Wootton, Farid Parpia, Anthony Chan, Ewing Lusk, and William Gropp. From trace generation to visualization: a performance framework for distributed parallel systems. In Proc. of the 2000 ACM/IEEE conference on Supercomputing (CDROM) (SC), page 50, Washington, DC, USA, Nov. 2000. IEEE Computer Society. Adam Leko and Max Billingsley, III. Parallel performance wizard user manual. http: //ppw. hcs. ufl. edu/docs/pdf/manual. pdf, 2007. S. Koehler, J. Curreri, and A. George, "Challenges for Performance Analysis in High. Performance Reconfigurable Computing, " Proc. of Reconfigurable Systems Summer Institute 2007 (RSSI), Urbana, IL, July 17 -20, 2007. J. Curreri, S. Koehler, B. Holland, and A. George, "Performance Analysis with High-Level Languages for High-Performance Reconfigurable Computing, " Proc. of 16 th IEEE Symposium on Field-Programmable Custom Computing Machines (FCCM), Palo Alto, CA, Apr. 14 -15, 2008.


