

b9659171c15b8c9b35b310d44d45fd83.ppt
- Количество слайдов: 66
 Project Economic Evaluation
 Capital Cost Estimation Classes of estimates Error Order of magnitude > ± 30 % Study ± 30 % Preliminary Control ± 20 % Definitive ± 10 % Detailed ± 5 %
 Typical Approval Process R&D Data Market Assessment Detailed Design $$ AFE AFD $$$$$ Preliminary Design Customer Identification Construction
 Capital Costs Fixed Capital Investment Land Working Capital Total Capital Investment Start up Expenses
") Fixed Capital Investment (FCI)
Fixed Capital Investment (FCI)
 FCI Components
 FCI Components
 FCI Components
 “ 6 tenths” Rule for Bare Equipment
 FCI Determination Bare Equipment Delivery Cost Delivered Equipment “Factored” Cost Methods Lang Hand Chilton FCI
 Bare Equipment Costs 2002 Cost Data
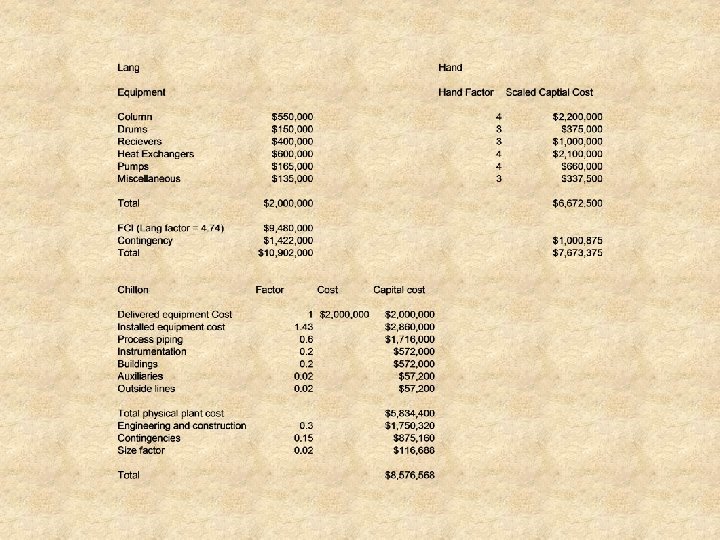
 Lang and Hand Methods FCI = Delivered Bare Equipment Cost * Factor * Contingency
 Chilton Method
 Capital Cost Example Problem Statement A small fluid processing unit is to be constructed adjacent to a larger operating unit in a multi purpose chemical plant. The present costs of the equipment delivered to the plant site are listed below: Equipment Delivered Cost $ 12 ft diameter tower $ 200, 000 Trays and internals for tower 350, 000 Accumulator drum 150, 000 Receivers 400, 000 Heat exchangers 600, 000 Pumps and motors 165, 000 Miscellaneous equipment 135, 000 Estimate the fixed capital cost using the Lang, Hand, and Chilton methods. Assume 15 % contingency.
 CE Cost Index
 CE Cost Index 600 580 560 540 520 500 480 CE = 2. 2524 (Year) 3965. 8 460 440 420 400 2007 2008 2009 2010 2011 2012 2013 2014 2015 2016
 10 Minute Problem Determine the installed cost using the Lang Method in 2018 for a jacketed / agitated stainless steel reactor to be used for the neutralization of 50 tons per day of a 20 wt. percent H 2 SO 4 solution (sp. gr. = 1. 15) using a 50 wt. percent Na. OH solution (sp. gr. = 1. 54) Holding time in the tank should be one hour based on the total flow to the tank. Assume the tank level is held at 80 percent of the tank height. Reactor Bare Equipment Cost Equation (s = volume in m 3) C = a + b s n e a = 61, 500 b = 32, 500 Cost basis: Gulf Coast January 2016 n = 0. 8
 Manufacturing Costs
 Operating Cost Components 1989 Cost Basis
 Labor Rates 1999 Cost Basis
 Global Economy Capital Investment Location Factors US Gulf Coast US west Coast Western Europe Mexico Japan Pacific Rim India 1. 00 1. 25 1. 20 0. 95 1. 15 1. 00 0. 85
 Corporate Cash Flow
 Project Cash Flow Corporation Cash Flow Working Capital Revenue / Sales Expenses Operations Depreciation Net Income Taxes
 Project Cash Position Chart
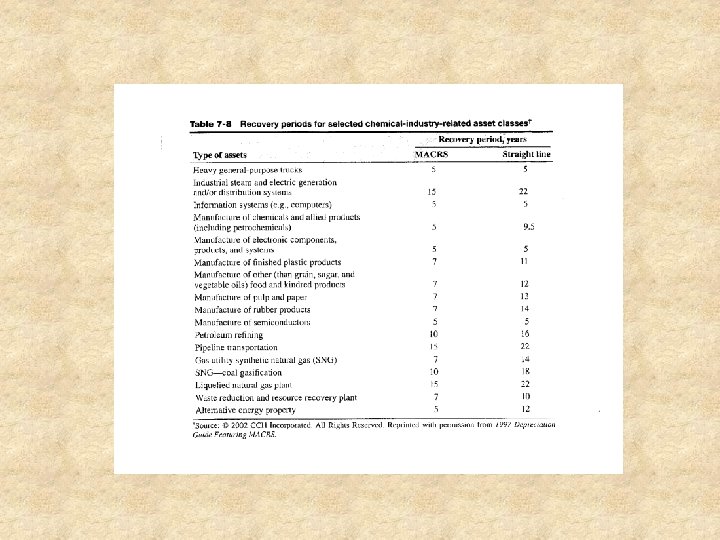
 Depreciation IRS Definition “A reasonable allowance for exhaustion, wear and tear, and normal obsolescence of a property used in the trade of business. Such property must have a determinable useful life more than one year. ” The IRS permits no more than 2/3 of the value to be written off in the first half of the depreciable life.
 Depreciation Methods Straight Line: Declining Balance Where: d = depreciation / yr V = original value Vs = salvage value N = Total depreciable life VBV = book value in year n
 Where: d = depreciation /") Depreciation Methods Double Declining Balance 2 (straight line rate) Where: d = depreciation / yr V = original value Vs = salvage value VBV = book value at year n
Depreciation Methods Double Declining Balance 2 (straight line rate) Where: d = depreciation / yr V = original value Vs = salvage value VBV = book value at year n
 Modified Accelerated Cost Recovery System Recovery Year 3 Year 5 Year 7 Year 10 Year 1 33. 33 20 14. 29 10 2 44. 45 32 24. 49 18 3 14. 81 * 19. 2 17. 49 14. 4 4 7. 41 11. 52 * 12. 49 11. 52 5 11. 52 8. 93 * 9. 22 6 5. 76 8. 92 7. 37 The 3, 5, 7, and 10 year classes use 200 % depreciation and a half year convention. 7 8. 93 6. 55 * 8 4. 46 6. 55 All classes convert to straight line depreciation in the optimal year, shown with an asterisk (*). 9 6. 56 10 6. 55 11 3. 28 A half year depreciation is allowed in the first and last recovery years. http: //accountingexplained. com/financial/non current assets/macrs
 MACRS Example Basis: Depreciable assets $ 100 Year DDB Formula DDB Depreciation SL Formula SL Depreciation 1 0. 4 (100)(0. 5) = 20 (100 ) / 5 20. 0 2 0. 4 (100 20) = 32 (100 20) / 4. 5 17. 78 3 0. 4 (100 52) = 19. 2 (100 52) / 3. 5 13. 71 4 0. 4 (100 71. 2) = 11. 52 (100 71. 2) / 2. 5 11. 52 5 0. 4 (100 82. 72) = 6. 91 (100 82. 72) / 1. 5 11. 52 0. 5 (100 94. 24) / 0. 5 5. 76 6
 Depreciation Example FCI = $ 22, 000 Salvage value = $ 2, 000 Depreciable life = 10 yrs. Determine the annual depreciation charge using: • • Straight line Double declining balance Hybrid double declining balance plus straight line MACRS

 A chemical plant can be installed for $ 1, 000. Operating income is estimated to be $ 600, 000 annually – this is revenue minus annual expenses. Assume 10 yr straight line depreciation and a 50 percent tax rate. Land can be purchased for $ 100, 000. Plant construction will take two years and at start up $ 100, 000 of working capital will be required. The plant salvage value is $ 50, 000 and will be realized as income during the 10 th year of operation – do not include the salvage value in the depreciation calculation. Determine the cash flow for each year. Period Investment Summary Cash Flow Cash Position Start of year 2 100, 000 During year 2 500, 000 600, 000 Start of year 1 0 During year 1 500, 000 1, 100, 000 Time zero 100, 000 FCI 100, 000 1, 200, 000 Land Cash Flow ($ 350, 000) Working Capital Year 1 350, 000 850, 000 Year 2 350, 000 500, 000 Year 3 350, 000 200, 000 Year 5 350, 000 550, 000 Year 6 350, 000 900, 000 Year 7 350, 000 1, 250, 000 Year 8 350, 000 1, 600, 000 Year 9 350, 000 1, 950, 000 Year 10 350, 000 2, 300, 000 End Year 10 225, 000 2, 525, 000 Expenses 150, 000 Year 4 Revenue Operations Operating Income ( $ 600, 000) Depreciation ( $100, 000) ($ 500, 000) Net Income ($ 250, 000) Taxes ($ 250, 000)
 stream is being debutanized in") Design Project Example A mixed natural gas liquids (NGL) stream is being debutanized in a distillation tower. The feed currently enters the tower subcooled at 100 F. To save energy, your supervisor has suggested installing a heat integration system which will cross exchange the hot column bottoms stream with the feed. Her approach will also require a booster pump be added to the feed line. Existing system data: Feed rate: 40, 000 std BBL / day Feed composition: 25 wt % i. C 4, 25 wt% n C 5, 50 wt % n hexane Feed temperature = 100 F Current feed pressure = 80 psig Bottoms stream conditions bubble point at 120 psig. Revised process information: The column bottoms flow rate should be based on 100 % recovery and purity of i. C 4 in column overhead. Pump discharge pressure = 150 psig
Design Project Example A mixed natural gas liquids (NGL) stream is being debutanized in a distillation tower. The feed currently enters the tower subcooled at 100 F. To save energy, your supervisor has suggested installing a heat integration system which will cross exchange the hot column bottoms stream with the feed. Her approach will also require a booster pump be added to the feed line. Existing system data: Feed rate: 40, 000 std BBL / day Feed composition: 25 wt % i. C 4, 25 wt% n C 5, 50 wt % n hexane Feed temperature = 100 F Current feed pressure = 80 psig Bottoms stream conditions bubble point at 120 psig. Revised process information: The column bottoms flow rate should be based on 100 % recovery and purity of i. C 4 in column overhead. Pump discharge pressure = 150 psig
 Base Case Q Q
 Process Revision Q q q
") Aspen Simulation (Base Case)
Aspen Simulation (Base Case)
 Aspen Simulation
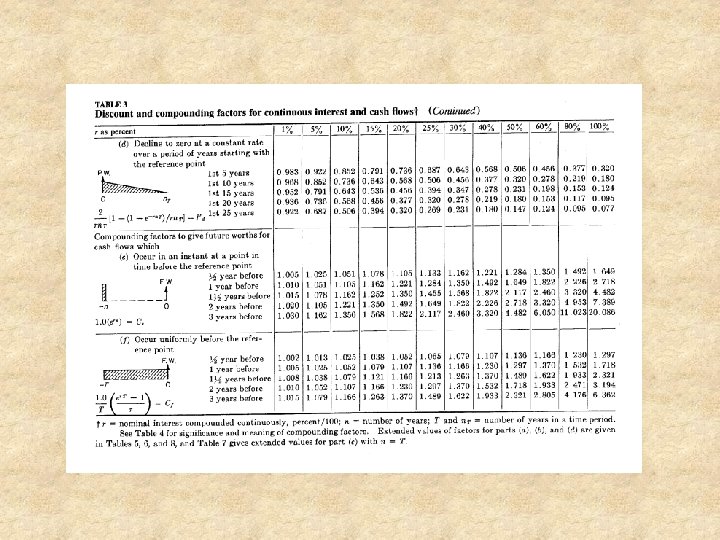
 Time Value of Money Future Sum Discrete Interest Continuous Interest Annuity Payments Present Worth
 Future Worth S Where: S = future sum P = principal i = interest rate n = number of periods P
.") Future Worth Example Manhattan Island was purchased in 1626 for $ 24. 00 (P). Taxable real estate value in 1984 = $ 24 billion Who got the best deal assuming a 6 % discrete yearly interest rate S P = $ 24
Future Worth Example Manhattan Island was purchased in 1626 for $ 24. 00 (P). Taxable real estate value in 1984 = $ 24 billion Who got the best deal assuming a 6 % discrete yearly interest rate S P = $ 24
 P Where: R = uniform payments P = principal i = interest") Annuity (Loan) P Where: R = uniform payments P = principal i = interest rate n = number of periods R R
Annuity (Loan) P Where: R = uniform payments P = principal i = interest rate n = number of periods R R
 Example $ 62, 000 Calculate your monthly payments (R) for a new") Annuity (Loan) Example $ 62, 000 Calculate your monthly payments (R) for a new $ 62, 000 Corvette assuming a interest rate of 6 percent and a loan period of 60 months R R
Annuity (Loan) Example $ 62, 000 Calculate your monthly payments (R) for a new $ 62, 000 Corvette assuming a interest rate of 6 percent and a loan period of 60 months R R
 10 Minute Problem You plan to borrow $200, 000 to purchase a new house. The nominal interest rate is fixed at 6. 5 % p. a. , compounded monthly. a. What is the monthly payment on a 30 year mortgage? b. What is the monthly payment on a 15 year mortgage? c. What is the difference in the amount of interest paid over the lifetime of each loan? P R R
 F A A A Where: A = uniform payments F =") Annuity (Uniform Payments) F A A A Where: A = uniform payments F = future sum i = interest rate n = number of periods
Annuity (Uniform Payments) F A A A Where: A = uniform payments F = future sum i = interest rate n = number of periods
 Annuity Example My daughter wants to go to Stanford !!! How much do I deposit in her college fund each year to pay her first year’s tuition of $ 65, 000 in 5 years ? ? The bank will pay me 4 % interest. $65, 000 A A A
 10 Minute Problem An IRA is an investment vehicle available to most individuals to save for retirement. The benefit is that the interest is not taxed until you withdraw money, and most retirees are in a lower tax bracket than when they worked. Under current laws, the maximum annual contribution is $5000 until age 50 and $6000 thereafter, including the year one turns 50. Suppose that you make the maximum contribution every year for 40 years, beginning at age 25 until age 65. a. What is the future value of this retirement fund after 40 years, assuming an effective annual interest rate of 9%? b. What effective annual interest rate is required for the future value of this investment to be $2 million after 40 years? F A A A
 CR = replacement cost") Capitalized Cost Where: Cv = installed equipment cost (original) CR = replacement cost
Capitalized Cost Where: Cv = installed equipment cost (original) CR = replacement cost
 Capitalized Cost Example An engineer buys equipment for $ 12, 000 – she wants a fund set up so she can have $ 10, 000 every 10 years to replace the equipment (the salvage value for the unit is $ 2, 000) How much money should be put in the annuity and what is the capitalized cost ? ? The annual interest rate is 6 percent Replacement Value ($ 10, 000) P 10 years Capitalized Cost = Initial Investment + Annuity
 $12, 645 10") Capitalized Cost Example $ 22, 645 Replacement Value ($ 10, 000) $12, 645 10 years
Capitalized Cost Example $ 22, 645 Replacement Value ($ 10, 000) $12, 645 10 years
 Capitalized Cost Example A high capacity pump has been designed for use in a chemical process. A standard type of pump with a negligible scrap value costs $ 4000 and will have a useful life of 5 years. Another proposed pump, of equivalent design capacity, costs $ 6800 but will have a useful life of 10 years and a scrap value of $ 800. Assuming an effective compound interest rate of 6 percent per year, determine which pump is the best investment by comparing the capitalized costs.
 Gregory Tables
 Textbook Discount Factors
 Discounted Cash Flow Period Investment Summary Cash Flow Cash Position Discount Factor (15 % ) Discounted Cash Flow Discounted Cash Position Start of year 2 100, 000 1. 350 135, 000 During year 2 to 0 500, 000 600, 000 1. 166 583, 000 718, 000 Start of year 1 0 During year 1 to 0 500, 000 1, 100, 000 1. 079 539, 500 1, 257, 500 Time zero 100, 000 1, 200, 000 1. 0 100, 000 1, 357, 500 Year 1 350, 000 850, 000 0. 929 325, 150 1, 032, 350 Year 2 350, 000 500, 000 0. 799 279, 650 752, 700 Year 3 350, 000 150, 000 0. 688 240, 800 511, 900 Year 4 350, 000 200, 000 0. 592 207, 200 304, 700 Year 5 350, 000 550, 000 0. 510 178, 500 126, 200 Year 6 350, 000 900, 000 0. 439 153, 650 27, 450 Year 7 350, 000 1, 250, 000 0. 378 132, 300 159, 750 Year 8 350, 000 1, 600, 000 0. 325 113, 750 273, 500 Year 9 350, 000 1, 950, 000 0. 280 98, 000 371, 500 Year 10 350, 000 2, 300, 000 0. 241 84, 350 455, 850 End Year 10 225, 000 2, 525, 000 0. 223 50, 175 506, 025
 = FCI (depreciable) Cash flow / yr Return on") Profitability Analysis Payout Period (POP) = FCI (depreciable) Cash flow / yr Return on Original Investment (ROOI) = Average annual NPAT TCI Return on Avg. Investment (ROAI) = Average Annual NPAT Land + WC + SUExp + License + FCI /2 Net Present Value (NPV) Internal Rate of Return (Discounted Cash Flow) IRR
Profitability Analysis Payout Period (POP) = FCI (depreciable) Cash flow / yr Return on Original Investment (ROOI) = Average annual NPAT TCI Return on Avg. Investment (ROAI) = Average Annual NPAT Land + WC + SUExp + License + FCI /2 Net Present Value (NPV) Internal Rate of Return (Discounted Cash Flow) IRR
 Net Present Value at 15 % Period Investment Summary Cash Flow Cash Position Discount Factor (15 % ) Discounted Cash Flow Discounted Cash Position Start of year 2 100, 000 1. 350 135, 000 During year 2 to 0 500, 000 600, 000 1. 166 583, 000 718, 000 Start of year 1 0 During year 1 to 0 500, 000 1, 100, 000 1. 079 539, 500 1, 257, 500 Time zero 100, 000 1, 200, 000 1. 0 100, 000 1, 357, 500 Year 1 350, 000 850, 000 0. 929 325, 150 1, 032, 350 Year 2 350, 000 500, 000 0. 799 279, 650 752, 700 Year 3 350, 000 150, 000 0. 688 240, 800 511, 900 Year 4 350, 000 200, 000 0. 592 207, 200 304, 700 Year 5 350, 000 550, 000 0. 510 178, 500 126, 200 Year 6 350, 000 900, 000 0. 439 153, 650 27, 450 Year 7 350, 000 1, 250, 000 0. 378 132, 300 159, 750 Year 8 350, 000 1, 600, 000 0. 325 113, 750 273, 500 Year 9 350, 000 1, 950, 000 0. 280 98, 000 371, 500 Year 10 350, 000 2, 300, 000 0. 241 84, 350 455, 850 End Year 10 225, 000 2, 525, 000 0. 223 50, 175 506, 025
 Internal Rate of Return Interest rate which yields NPV at end of project life = zero
 Internal Rate of Return = 22 % Period Investment Summary Cash Flow Cash Position Discount Factor (22% ) Discounted Cash Flow Discounted Cash Position Start of year 2 100, 000 1. 551 155, 100 During year 2 to 0 500, 000 600, 000 1. 255 627, 715 782, 815 Start of year 1 0 During year 1 to 0 500, 000 1, 100, 000 1. 118 559, 110 1, 341, 925 Time zero 100, 000 1, 200, 000 1. 0 100, 000 1, 441, 925 Year 1 350, 000 850, 000 0. 898 314, 256 1, 127, 669 Year 2 350, 000 500, 000 0. 721 252, 331 875, 338 Year 3 350, 000 150, 000 0. 580 202, 610 672, 728 Year 4 350, 000 200, 000 0. 465 162, 686 510, 042 Year 5 350, 000 550, 000 0. 373 130, 628 379, 414 Year 6 350, 000 900, 000 0. 300 104, 888 274, 526 Year 7 350, 000 1, 250, 000 0. 241 84, 220 190, 306 Year 8 350, 000 1, 600, 000 0. 193 67, 624 122, 682 Year 9 350, 000 1, 950, 000 0. 155 54, 299 68, 383 Year 10 350, 000 2, 300, 000 0. 125 43, 599 24, 784 End Year 10 225, 000 2, 525, 000 0. 111 24, 786 0. 000
 Design Project Example Economic criteria: Find NPV at 10 % Find IRR Costs: Electricity = 10 cents / kwh Steam (450 psi) = $ 10. 00 / mm BTU 10 year project life 6 year class life –straight line depreciation Working capital and start up expenses – 10 % of TCI No land cost One year construction period (2007 start of construction) Escalate costs at 3 % per year. Use textbook for cost information
 Practice Problem I am in the process of buying a new car and I am considering a 2016 Honda Civic either with a conventional engine or a hybrid drive system. Which decision makes economic sense based on a comparative NPV analysis (evaluated at a 10 % interest rate) ? Data: Honda Civic LX cost (MSRP) $ 18, 640 Honda Civic Hybrid cost $ 24, 735 Battery life 75, 000 miles Battery cost $ 2, 500 EPA mileage estimates (city / highway) Civic 31/42 Hybrid 44/47 Current price of gasoline $ 2. 30 / gallon (escalate at 4 % per year) My typical driving profile is around 50 percent in town and 50 percent highway. I drive 15, 000 miles per year. I plan on keeping the car for 10 years and I usually carry the car loan for 60 months and put 10 percent of the purchase price down. The current interest rate on a car loan is 6 percent. There is no depreciation credit and taxes are not paid after the initial purchase.
 Practice Problem For a new process, the land was purchased for $10 million. The fixed capital investment, paid at the end of year 0, is $165 million. The working capital is $15 million, and the salvage value is $15 million. The estimated revenue from years 1 through 10 is $70 million/y, and the estimated cost of manufacture over the same time period is $25 million/y. The internal hurdle rate (interest rate) is 14% p. a. , before taxes, and the taxation rate is 40%. a. Draw a discrete, non discounted cash flow diagram for this process. b. Determine the yearly depreciation schedule using the five year MACRS method. c. Determine the after tax profit for each year. d. Determine the after tax cash flow for each year. e. Draw a discrete, discounted (to year 0) cash flow diagram for this process. f. Draw a cumulative, discounted (to year 0) cash flow diagram for this process. g. What is the present value (year 0) of this process?
 Sensitivity Analysis Tornado Plot
 Sensitivity Analysis IRR +10 Sales Price +5 Sale Volume % Change 10 5 5 +5 +10 Investment 10 Spider Plot
 Uncertainty Analysis Variable 1 Variable 2 Total Project Variable 3