e9ddfc4b0cfd9c031b8dab134b9590a3.ppt
- Количество слайдов: 172
 Productivity Concept, Measurement and Improvement What is Productivity? • ILO defines Productivity as the ratio between “Output of Work” and “Input of Resources. Productivity= Output Input Process Output Waste 1
 • This definition applies to an enterprise, an industry or an economy as a whole. • Productivity is simply the ratio between the amount produced and amount of resources used in the course of production. • These resources can be: (Unit of resources is in brackets. ) 1. Land (Hectares) 2. Material (Metric Tonne) 3. Plant and Machinery (Machine Hours) 4. People (Man Hour) 5. Capital (Rupees) 2
 Is Productivity different from Performance? • Productivity takes into account output in relation to input. • Performance takes into account output alone. • Productivity =Output÷ Input • In performance, we consider only the output and not the input. • A performance index becomes comparison of actual output with some standard or expected output. • Performance Index = Actual work done÷ Ideal or standard expected work. 3
 →Case: It takes 3 Mtrs. of cloth to make a coat. In a day Prashant is expected to make 50 coats. He makes 40 coats from 111 Mtrs. Of cloth. • What is Prashant’s Performance ? - 40 coats • Performance Index ? - {40 ÷ 50} x 100= 80% • What is Prashant’s cloth productivity index? 4
 - Normally Prashant should have consumed 120 Mtrs. of cloth. However he managed to make 40 coats in 111 Mtrs. Of cloth. - Cloth Productivity Index = {120÷ 111} x 100= 108% • What is productivity of cloth? - Cloth productivity= {40÷ 111} = 0. 36 Coats/Mtr. 5
 • Case: Shalini was busy going through the production and machine hour consumption report of the past three months. MONTH INPUT (Machine Hours) OUTPUT (No. of Units) September 90, 000 99, 000 October 1, 00, 000 November 1, 50, 000 1, 35, 000 The reports clearly showed that there had been an increase in production with a simultaneous increase in machine hour consumption. Shalini was not sure whether it really indicated a rise in productivity or merely increase in production. How should she get an answer to this? 6
 • Solution: - Productivity per Machine Hour= Production Units÷ Machine Hours - Productivity for September= 99, 000÷ 90, 000= 1. 1 - Productivity for October= 1, 000÷ 1, 000= 1. 0 - Productivity for November = 1, 35, 000÷ 1, 50, 000= 0. 9 7
 MONTH INPUT (Machine Hours) OUTPUT (No. of Units) PRODUCTIVITY September 90, 000 99, 000 1. 1 October 1, 00, 000 1. 0 November 1, 50, 000 1, 35, 000 0. 9 We can see from the table that while production is rising from September to November; productivity is falling. 8
 • Typically when markets are booming it is worth increasing production so as to capture marketshare even if productivity does not increase. • Conversely, during the lean periods when selling becomes difficult, increasing production will only result in increasing unsold stocks. • It is, therefore, important to focus on increase in productivity a it helps in maintaining profitability. • Today’s organizations are looking at Productivity improvements by cost reduction thereby protecting their profit margins. 9
 Partial Productivity →Definition • Ratio of output to one class of input. • At a given time it considers only one input and ignores all other inputs. • Its significance lies in its focus on utilization of one resource. • For instance, labour productivity is measured using utilization of labour hours; whereas capital productivity is measured in Rupees. 10
 →Case: - As a part of new assignment, Parag of Pop-Corn Products was asked to identify areas for productivity improvements. He collected data on all inputs and outputs of previous year’s operations being transferred into equivalent of money units. The table below gives details with all figures in lakh rupees. OUTPUT 1000 INPUT Human 300 Material 200 Capital 300 Energy 100 Other Expenses 50 Parag plans to calculate values of partial productivity to aid in his study. Please help him in his endevour. 11
 →Solution: - Partial productivity of various inputs is as follows: • Human productivity= 1000÷ 300= 3. 3 • Material Productivity= 1000÷ 200=5. 0 • Capital Productivity= 1000÷ 300 =3. 3 • Energy Productivity= 1000÷ 100= 10. 0 • Productivity of other expenses= 1000÷ 50=20. 0 12
 Advantages Disadvantages Easy to understand Misleading if used alone. Easy to obtain data Cannot explain overall cost increase Diagnostic tool to pinpoint Profit control is not precise areas of improvement 13
 Total Factor Productivity • In an effort to improve productivity of labour, company may install more machinery. • Then productivity of labour will go up bringing down the capital productivity. • Partial productivity that typically uses only one resource at a time fails to grasp this paradox. • Historically labour and capital were considered to be the most significant in contribution in the process of production. 14
 • Therefore, in The Total Factor Productivity model developed by John W. Kendrick in 1951, he has taken only labour and capital as only two input factors. → For instance, Products worth Rs 100 lakhs were manufactured and sold in a month. It consumed Rs 20 lakhs worth labour hours and Rs 55 lakhs worth capital. - The Factor Productivity = 100÷ (20+55)= 1. 33 15
 Advantage Disadvantage Data is easy to obtain Does not consider impact of material and energy inputs, though material typically forms 60% of the product cost. Appealing from the viewpoint of the corporate and the National economist. 16
 Multi-factor Model of Productivity • Developed by Scott D. Sink Multi-factor Productivity Measurement Model considered Labour, Material and Energy as major inputs. • Capital was deliberately left out as it is most difficult to estimate how much capital is being consumed per unit/ time. • The concept of depreciation used by accountants make it further difficult to estimate actual capital being consumed. 17
 Total Productivity Model • Total Productivity Model developed by David J. Sumanth in 1979 considered 5 items as inputs. • These are Human, Material, Capital, Energy and other expenses. • This model can be applied in any manufacturing or service organization. • Total Productivity= Total Tangible Output÷ Total Tangible Input. 18
 • Total tangible output= Value of finished units produced + partial units produced + Dividends from securities + Interests from bonds +Other incomes. • Total tangible inputs= Value of human inputs+ capital inputs+ materials purchased+ energy inputs + other expenses (taxes, transport, office expenses etc. ) Advantages Disadvantages All quantifiable inputs are considered. Data is difficult to compute. Sensitivity analysis can be done. Does not consider intangible factors of input and output. Provides both firm level and operational unit level productivity. 19
 American Productivity Centre (APC) Model • American Productivity Centre has been advocating a productivity measure that relates profitability with productivity and price recovery factor. • Profitability= Sales Costs • {Output Quantities x Prices} {Input Quantities x Unit Costs} • Productivity x Price Recovery Factor. • The APC model is different from other models in its treatment, by inclusion of Price Recovery Factor. 20
 What is price recovery factor? • It is a factor that captures the effect of inflation. • The changes in this factor over time indicate whether changes in input costs are absorbed, passed on, or overcompensated for, in the price of the firm’s output. • Thus inclusion of this factor will show whether gains or losses of a firm are due to changes in productivity or it merely indicates the fluctuations in the prices of material consumed and sold. 21
 Sumanth’s Five Pronged Model • All efforts towards productivity improvement have always been focused on the resources i. e. men, material, money, time, machinery, etc and the processes through they undergo to give output. • In 1982, Sumanth and Omachanu proposed Five Pronged Approach, classifying fifty four different techniques based on the five basic types: (1) Technology (2) Employee (3) Product (4) Process, and (5) Material 22
 • In the areas of product and process improvement: value analysis aids in eliminating non-value adding function i. e. those function resulting in low performance at high costs from the product and processes. • On the technology front, extremely precise and accurate high-speed machines and systems like CAD, CAM, CIM, FMS etc have drastically reduced the processing time. • On the human front, incentive plans, job enrichment, fringe benefits etc are used to encourage value-adding inputs from people. 23
 • Inventory control, MRP, material handling systems etc. reduce the time, space, effort and money involved in making material available for its time and place utility. • Techniques like work-study, ergonomics, etc eliminate motions that are non-productive or make them easy to perform are included in the human factor. • Today, Lean Production System approach is a holistic one, which covers all areas of productivity improvement. 24
 • In order to sustain, a few other techniques like JIT, TPM, TQC, KAIZEN, Quality Circles etc can be applied simultaneously. Summary A. Technology Based - CAD, CAM, Integrated CAM, Robotics, Laser Beam Technology, Energy Technology, Group Technology, Computer Graphics, Simulation, Maintenance Management, Rebuilding Old Machinery, Energy Conservation. 25
 B. Employee Based - Financial Incentives, Group Incentives, Fringe Benefits, Promotions, Job Enrichment, Job Enlargement, Job Rotation, Worker Participation, MBO, Skill Enhancement, Learning Curve, Working Condition Improvement, Communication, Zero Defects, Punishment, Recognition, Quality Circles, Training, Education, Role Perception, Supervision Quality. 26
 C. Product Based - Value Engineering, Product Diversification, Product Simplification, R&D, Product Standardization, Reliability Improvement, Advertising & Promotion. D. Task Based - Method Engineering, Work Measurement, Job Design, Job Evaluation, Job Safety Design, Ergonomics, Production Scheduling, Computer Aided Data Processing. E. Material Based - Inventory Control, Material Requirement Planning, Materials Management, Quality Control, Material Handling and Recycling. 27
 ILO Approach to Productivity Improvement • The classic ILO approach is Task Based. • It breaks manufacturing time into basic work content, added work content, and ineffective time. • The main focus is on reducing inefficient time in the total work content. A. The Basic Work Content - The amount of work “contained” in a given product or process measured in man-hours or machine hours. 28
 - The basic work content is the irreducible minimum time theoretically required to produce one unit of output. B. Added Work Content (1) Work content added by defects in the design or specification of the product. It may be due to lack of standardization and/or incorrect quality standards. - This additional work content is the time taken over and above the time of the basic work content due to features inherent in the product which could be eliminated. 29
 (2) Work content added by inefficient methods of production or operation. - This is the time taken over and above the basic work content plus (1), due to inefficiencies inherent in the process or method of manufacture or operation. - This includes wrong machine used, processes operated in bad conditions, wrong tools used, bad layout, operator’s bad working methods etc. 30
 C. Ineffective time - All interruptions which cause the worker or machine or both to cease producing or carrying out the operations on which they are supposed to be engaged. - Irrespective of the cause, these must be regarded as ineffective time because no work towards completing the operation in hand is being done during the period of the interruption. 31
 (1) Ineffective time due to shortcomings on the part of the management. - Time during which man or machine or both are idle because management failed to plan, direct, coordinate or control efficiently. (2) Ineffective time within the control of the worker. - Time during which man or machine or both are idle for the reasons within the control of the worker himself. 32
 Focus on reducing added work content & inefficient time in the total work content • Following are the methods by which added work content & inefficient time can be reduced. →By reducing 1. Poor design and frequent design changes 2. Waste of materials 3. Incorrect quality standards 4. Poor layout and poor utilization of space 5. Inadequate material handling 33
 • • Frequent stoppage in production Ineffective method of work Poor planning of work Frequent breakdowns Absenteeism & late coming Poor workmanship Accidents and occupational hazards. 34
 Quality Circles • Quality Circles were the logical consequence of the various waste elimination programmes that were run in many Japanese corporations in early fifties. • It provided a platform for the workers to get together and use techniques for their quest for continuous self-development and organizational improvement. • In 1980, the first Quality Circle was launched in Hyderabad plant of Bharat Heavy Electricals Limited. 35
 Definition and Meaning • Quality Circle is a small group of employees in the same work area or doing a similar type of work who voluntarily meet regularly for about an hour every week to identify, analyze and resolve work related problems, leading to improvement in their total performance ad enrichment of their work life. • This definition is quite comprehensive and most commonly accepted. • Every part of the definition is significant. 36
 → Why small group of employees? - Experience indicates that the optimum number of a Q. C. is about eight to ten. - If a circle is formed with less than five members, one can imagine the strength of the group when absenteeism is high. - Interaction and participation becomes more pronounced when group members are more than say, six. 37
 → Why in the same work area or doing similar type of work? - This ensures Q. C. to be a homogeneous and cohesive group - The discussion that takes place remains interesting to everyone only if members are from the same background. - It also helps the members to understand the intricacies of the problem. - Also the application of QC tools that are recommended require the expertise in the field. 38
 → Why is participation voluntary? - ‘Voluntary’ in the Japanese context has a different interpretation as compared to what is normally understood in the Indian context. - To the Japanese , the very word ‘voluntary’ implies 100% participation. - Hence, when a company in Japan decides to implement Quality Circle, every body has to enroll as a member. - Japanese have refrained from using the word ‘compulsory’ as it indicates not just 100% participation but achievement of targets as well. 39
 • Quality circle requires some amount of creativity that is not under control, therefore, the word voluntary is used to indicate that achieving targets is not mandatory, but participation is compulsory. • In India the term ‘voluntary’ has been used to circumvent the possible opposition from the trade unions. → Why to meet regularly for an hour every week? • Meeting regularly is absolutely essential for the success of Q. C. 40
 • If the meetings are kept at longer intervals then cancellation of one or two meetings will further lengthen the interval leading to complete stoppage of work. → Why to analyze and resolve work related problems? • As employees know more about their own work area than any body else, they are in a better position to solve problems occurring there. 41
 Structure of Quality Circle Steering Committee/ Departmental Committee Top Management Coordinating centre TM Steering Committee Facilitator Leader/Deputy Leader Member Non Member 42
 Role of Each Element 1. Non-Members - Initially, all the employees in a particular work area may not volunteer in joining QC activity. - Some others may not be interested in activity but prefer not to get directly into it. - QC members must understand that solutions they find cannot be implemented without the cooperation of these non-members. - Members must encourage non-members to participate in activities so that they change their attitudes and form circle on their own. 43
 2. Members - Members must be restricted to grass root level persons. - If membership is kept open only to officers and executive, the very purpose of QC gets defeated. - Members actively participate in selecting problems of their concern, analyzing it, finding solution to it and finally making presentation to the management. 44
 3. Leader/Dy. Leader - In Japan, first line supervisors are nominated as leaders. - However, in India, it is advisable to make members choose their own leader. - Earlier there used to be only one person as leader. - But considering heavy absenteeism that prevails in our country, there can be one deputy leader who will take charge in absence of leader. 45
 The leader or the deputy leader’s endeavour is To maintain cohesiveness of the team. To plan agenda for meetings. To ensure participation from every member by assigning them work. - To encourage consensus decision making process. 4. Facilitator - Facilitator is the senior officer of the department where QC is working and is nominated by management. • - 46
 • The facilitator - Can facilitate more than one QC. - Is responsible for success of QC’s operating in his area. - Ensures necessary facilities are available to the team for operation. - Joins Steering Committee meetings and gives results of activities of QC. 47
 5. Steering Committee - The committee comprises of heads of major functions as members and chief executive as the chairman. - The committee makes top management’s support visible. • Steering committee - Meets regularly once in two months. - Takes overview of QC activity in entire organization. - Gives policy guidelines fr the propagation of movement 48
 6. Coordinating Agency - The job of coordinating agency is similar to facilitator but on a large scale. - It coordinates QC activities throughout the organization. - Steering committee decides the composition of coordinating agency. • Coordinating agency - Organizes a training programme for members when QC is formed. - Evolves norms to assess performance of different QCs. 49
 - Prepares budget for QC activity. - Arranges guest speaker or library facility for members. 7. Top Management - Top Management does not fall within the formal structure of QC. - Its main job is to • Convey its commitment to all employees • Extend necessary support by attending conventions and sanctioning funds. • Form quality council and establish a conducive atmosphere. 50
 Quality Control Tools • Quality circles use certain basic tools to identify, analyze, and resolve their problems, called QC tools. A. Stratification • Stratification refers to segregation of problem area into smaller units so that each can be taken more effectively. • What appears to be a single problem may actually consist of a set of problems, each with a different root cause. 51
 • For instance, the problem of ‘Low output during the day’ may have different set of causes during the first and second shift. • There is no way of knowing the correct way of stratifying the problem but when faced with a problem, one needs to use his skills and expertise to be able to do good stratification. • The underlying principle is that when you find a problem, break into sub problems and find out the root cause of each. • This procedure becomes faster and simpler. 52
 Examples of Stratification Operation Wise Skill, Experience, Years in job, Gender, individual, Union, Educational qualification. Machinery Type of machine, Machine number, order new, structure, functions, moulds, jigs etc. Material Wise Maker, lot, date of arrival, date of use, Type, constituents, storage period, storage place, production place. Method Wise Operation method, place of operation, Temperature, Humidity, Pressure, No. of revolutions, speed, sampling etc. Time Wise Day, day and night, shift (in case of shifts), days of the week, month, normal day and the day after holiday, immediately after commencement, right before end, hour, around machine adjustment. Product Wise Lot, vendor, New & old products, standards, special products. Etc. Inspection, calibration Inspector, Testing machine, Gauge, person in charge of calibration, place of calibration. 53
 B. Check Sheet or Tally Table • A data-recording tool where the frequencies of each type are marked against it. • The frequencies against each will indicate its relative importance and subsequently help in drawing pareto diagramme. Sr. No. Cause Tally Marks Frequency Remarks 1. Broken Pin //// // 7 - 2 Broken Link /// 3 - 3 Loose contact //// // 12 - 4 No Power // 2 Known Before 54
 C. Pareto Analysis • This technique was developed by Italian economist Pareto which showed that 20% population of a country controls 80% wealth and vice versa. • This is applicable in most cases and is called 80 -20 principle. • Along these lines, Pareto diagramme can be drawn by finding out which 20% causes create 80% problems. 55
 Pareto’s Analysis- A Case Study- Cause of decline in production in Rubber component manufacturing company. Code Item Causes Time (Min)/Case A Rubber Recovering 16 145 9. 1 B Repair Delays 3 255 85. 0 C Repairs 5 344 68. 8 D Adjustments 12 206 17. 2 E Preparations 48 232 4. 8 F Component Search 5 137 27. 4 G Component Replacement 9 110 12. 2 H Raw Material Delay 2 780 390 I Miscellaneous 17 303 17. 8 117 2512 21. 5 Total 56
 • It can be seen problem H consumes most of the time. • If we take care of this problem then there will be a dramatic increase in productivity as compared to taking other problems in the beginning. • Thus the important problems need to be tackled on top priority. 57
 D. Histogram • Histogram is also called frequency distribution chart and represents the condition of variance through the chart. • It is a visual presentation of the spread on distribution of data to monitor a process and determine its consistency in meeting customers’ requirements. • The population in the data is classified on the basis of their similarity into different groups or classes. 58
 • Each class or group is classified on the basis of their similarity into different groups or classes. • Each class or group is represented by a rectangle or a bar. • The class interval or causes of the problem or defects are placed on x-axis and frequencies or the number of defects is placed on the y-axis. • The height of each bar is proportional to the number of frequency of its class interval and each bar should be of same width. 59
 60
60
 Uses of Histogram • The shape of the diagramme reveals the mean value variance. • By frequency distribution chart the standard deviation and mean deviation can be calculated. • By comparing with rated value, the process efficiency and rate of defective goods could be calculated. • By visualizing variances, abnormalities come to light. 61
 E. Ishikawa or Fish Bone Diagramme (Cause and Effect Diagramme) • Investigative tool developed by Dr. Ishikawa of Japan. • This diagramme is arrangement of all possible causes, which give rise to the effect or problem in hand. • Prior to plotting this diagramme, it is necessary to list down all possible causes by brain storming, so that no important cause is missed. • They are segmented broadly into four ‘M’s viz Men, Machine, Method, and Material. 62
 Machines Men Sub cause Final Effect Sub cause Method Materials 63
 F. Control Charts • Control charts are used to investigate whether the manufacturing process is in stable condition or not and is used to maintain the manufacturing process in stable condition. • Central line (CL), upper control line (UCL), and lower control limit (LCL) are the main three lines which constitute a control chart. UCL CL LCL 64
 →X (bar) Charts • Central Line =Grand Mean • UCL= Grand Mean + A 2 x Mean Range • LCL= Grand Mean - A 2 x Mean Range →R (bar) Charts • Central Line= Mean Range • UCL= D 4 x Mean Range • LCL= D 3 x Mean Range 65
 A case of a Vending Machine • Shalini is a vending machine operator at a coffee shop. The machine at her shop gives 50 ml of coffee at a time. Lately Shalini has noticed that machine never fills the glass exact ml but it either under fills or over fills. She complained to the manufacturer who sent Sachin, the service engineer to her shop. After inspecting the machine, Sachin said “I think we must test this machine fr precision and accuracy. ” • “How do we do that? ” asked Shalini 66
 • “Let us take five samples of four readings each of this machine and then we can plot control chart and know answers to our questions. ” • Following is the chart that shows the readings recorded by Sachin and Shalini. Sample No. X 1 X 2 X 3 X 4 1 49 50 50 49 2 49 49 49 50 3 48 48 50 49 4 48 48 48 49 5 50 49 51 48 For sample size n=4 ; A 2= 0. 729, D 3= 2. 28 and D 4= 0 67
 • Looking at both the graphs, Sachin told Shalini, “ Your machine is perfectly all right. And whatever variations you are getting is the inherent variation of the machine. ” → Thus control charts help workers monitor the quality of their work, doing away with inspection. G. Scatter Diagrammes • It is a graphical technique for studying relationships between two variables (which occur in pairs) to figure out if there is a connection between the variables and how strong this relationship is. • The density and the direction of the cloud indicates how the two variables influence each other. 68
 • A positive relationship between two variables means that increasing values of one variable are associated with increasing values of the other. • A negative relationship means that increasing values of one variable are associated with decreasing values of the other. →A scatter diagramme is used after a cause and effect analysis to determine what will happen to the one variable if the other is changed. 69
 Benchmarking • Benchmarking is the systematic and continuous process of determining what the best performances and underlying skills of leading organizations are in their strive for excellence. • And based on above, stimulate the organization’s own strive for excellent performances at all organizational levels. • It is a strategy to stimulate changes and optimize performances. 70
 The Benchmark Process 1. What is to be benchmarked 8. Implementation & Monitoring 2. Identify the benchmark partners 3. Gather data 4. Analyze the data 7. Develop action plans 6. Formulate the functional goals 5. Determine the performance gap 71
 When do you use Benchmarking? • Benchmarking is mostly used to compare processes and performances against those of recognized leaders. • Based on this, the performance gap between the organization and the best competitor is evaluated. • Organizational processes usually used for benchmarking are: (a) Marketing, (b) Sales, (c) Purchasing, (d) Technology development, (e) Product development, and (f) Logistics 72
 Types of Benchmarking 1. Internal Benchmarking - Internal benchmarking involves comparison of internal activities and processes within own company. - Usually of interest to large organizations where it is determined as to how far other departments and divisions execute similar activities within their own organizations more efficiently and effectively. 73
 2. Competitive Benchmarking - A comparison is made with direct competitors. - Operations processes of these competitors are measured and compared against its own situation. - Based on what is done by the competitor and what is lacking within the own organization, the own processes can be adjusted to improve efficiency and produce a better and cheaper product. - For example, a software producer who wants to improve his competitive position can try to figure out what Microsoft has done to become the market leader. 74
 3. Process Benchmarking - Involves search for the best in class of a certain process, regardless if it is a competitor or not and in which industrial branch it is applicable. - For example, the logistical activities of a chemical company can be compared with an electronics company with an excellent logistical process. 4. Strategic Benchmarking - Used to obtain sweeping breakthroughs in the areas of productivity in order to strengthen its competitive position. - This type of benchmarking helps determining the relative competitive position of all business activities and suggests the best course to follow. 75
 • This can be done in several ways such as - Comparing your own strategy and financial performance against those of competitors. - Determining from the strengths and weaknesses of the competitors in which areas your organization can outdo these competitors, and - Which improvements are best contributed to its own core competencies. 76
 Steps to execute Benchmarking Process 1. Determine what should be benchmarked. - It is determined which functions, tasks, processes, or activities within the own organization will be subjected to benchmarking. - Based on the critical success factors, one or more of processes will be selected for benchmarking. - Appoint a team that will map these processes in detail. 77
 - The team will identify process stages and determine the process flow, the procedure for each process stage, relevance performance indicators, inputs and outputs of the process and customer requirement. 2. Identify the benchmark partners. - Important criterion for the selection of benchmark partners should be outstanding regarding the competitiveness of activities, availability of reliable information about the partners. 78
 - Identifying benchmark partners requires consultation of sources such as databases, professional magazines, newspapers, bank reports, annual report of competitors, seminars, consultancy bureaus, universities etc. - Also, interviews with customers, suppliers, employees and bankers. 3. Gather Data about the performances of partners. - Through interviews, surveys, consultation and technical magazines. 79
 - Process and working methods of partners are examined thoroughly. - Performance indicators are measured and qualitative and quantitative data is gathered. 4. Analyze the data. 5. Determine the gap between the performance level of organization and that of its benchmark partner. - Differences in working methods and causes of the differences in performance is documented. - The main question to be asked is “why is the efficiency and effectiveness of the own process lagging behind that of the best in class? ” 80
 6. Based on the results of the benchmark study, new functional goals are established to close the performance gap. 7. The goals are now transformed into concrete action plans. 8. Implement specific actions and monitor the progress. - Verify whether actions are executed as planned, whether the process is changing, and if the benchmark goals are being met. - If required, possible adjustments are made. 81
 9. Start again - Benchmarking is a process of continuous improvement. - There always better and improved methods. - Competition is not standing idle. - In due course of time, new best practices are developed. 82
 Example from Rank Xerox, Netherlands • “In the past, the order processing department of Rank Xerox had 20 employees, wherein the throughput time of an invoice was 5 to 8 days. After a benchmark study, the activities within the department were divided into four segments based on the invoice amount. Finally, the number of persons in the department was reduced an invoice was sent within 24 hours in respect of 95% orders. ” • The reason for the benchmark study was that customers were displeased about long delivery time. • A shorter delivery time also resulted in an accelerated invoicing, a smaller department, a higher customer satisfaction and improved liquidity. 83
 Creativity Based Techniques • Innovators have known since long that the process of generating ideas is not logical or analytical process; it is a creative process. • Some of the commonly used creativity techniques are: (1) Brainstorming - Brainstorming is defined as a means of getting large number of ideas from a group of people in a short time by following certain rules. 84
 • The definition focuses on three aspects: (a) Large number of ideas - Brainstorming is a tool to generate a large number of ideas. - There is no guarantee that the ideas will be practicable. - There is no guarantee that the ideas will be best. - The hypothesis underlying the efficacy of brainstorming is that the quantity leads to quality. 85
 - Often good ideas are under the bad ones in the brain and unless the bad ideas are permitted to exit, the good ones do not surface. (b) A group of people - Brainstorming is a group process. - The optimum size of a group is about twelve; but it can vary between six to twenty. - Ideally the group should be heterogeneous, with as much diversity in gender, age, qualifications and experience, as possible. - Such heterogeneity permits observation of problem from different view points, which is the crux of the brainstorming process. 86
 (c) In a short time - This refers to the rate of flow of ideas. - This rate can be as high as one hundred ideas in a period of ten minutes. - Once again, the emphasis is on quantity. → The success of Brainstorming - Following four basic guidelines can ensure the success of a brainstorming process. (a) Suspend judgment - Just listen and list the ideas. - Do not try to judge or evaluate any idea till you finish the session 87
 (b) Encourage free-wheeling of ideas - Permit wild ideas; encourage dreaming, and thinking around the problem. (c)Quantity - Go for quantity i. e. number of ideas. - Do not examine quality or feasibility of idea at this stage. (d) Cross fertilization of ideas - Encourage members of the brainstorming group to hitch hike on each other’s ideas. - Show no interest in identification of ownership of each idea. 88
 The Stages of Brainstorming • The process of brainstorming consists of six stages (1) Stating the problem - All the participants of brainstorming sessions must know some details of the problem. - Therefore, in the first stage, we need to state the problem and try to provide some information about it. (2) Re-stating the problem 89
 - Ask the participants to look at the problem in a different ways and identify as many facets of it as they can. - Participants restate the same problem depending on the way they look at it. - If the problem is looked at from many angles, it becomes easy to generate a large number of solutions. (3) Select a basic re-statement - After listing down all the re-statements, select one or two of these as a lead to brainstorming session. 90
 - This selection is done by the leader alone. - This stage must be closed with a clear definition of the objective of the brainstorming session i. e. expected outcome. - If this is not done, the session could easily turn into a ‘gossip’ session. (4) Warm up - In this stage participants do free-wheeling for the purpose of actual generation of ideas. - Some participants observe silence for a few minutes. 91
 - Silent meditation can be a great tool for use in this stage. (5) Idea generation - Generally participants sit in circle. - The leader displays the selected statement and invites ideas. - People are encouraged to speak out the moment they get an idea. - The leader notes down each and every idea, without evaluation or judgment. - The process goes on till the ideation dries up. 92
 (6) Wildest idea - In this final stage, the group takes up the wildest of the ideas and attempts to turn into something useful for further brainstorming. - After this, the session is ended. →Dos and Don'ts of Brainstorming Do’s Don'ts Suspend judgment Spend too long on initial discussion Allow wild and silly ideas Allow observers Have a warm up session Tape record the proceedings Encourage noise and laughter Accept interruptions Take more than one statement of the problem Drag a session that has dried up. 93
 (2) Nominal Group Technique - In the Nominal Group Technique, a group of qualified individuals come together to present their ideas and then vote for the most favoured one. - This idea is taken up as the decision of the group. - The group is referred to as ‘nominal’ since the group members do not directly interact with each other. - Every member works on the solution independently. 94
 Steps of Nominal Group Technique 1. A small group gathers around a table, receives instructions, and identifies the problem. 2. Participants silently write down ideas about problem solving. 3. Each participant presents ideas one at a time; leader writes them on the chart. 4. Group discusses, clarifies and finally evaluates each idea. 5. Participants privately rank ideas in order of their preference. 6. The highest ranking idea is taken as group decision. 95
 Advantages & Disadvantages • It allows formation of an informed opinion. • Ranking of ideas by the group members is facilitated by supplying information held by each member to all other members. • Fairly rapid process, permitting objective exchange of ideas. • Requires a trained facilitator to run the session. → As it is important to remove the element of personal bias and prejudices, it is advisable to record the ideas without mentioning the name of the person giving it. 96
 Lateral Thinking →“You are on the terrace of a ten storied building. ” Prashant was posing a riddle before his friends, “and suddenly you hear a fire alarm. How will you reach the ground floor? ” → “Very simple” exclaimed Shalini, “ I will rush down the staircase. Don’t tell me there is no staircase. ” → “I’ll use the elevator”, Sachin joined in, “a ten storied building is bound to have an elevator. It will be faster. ” 97
 → “I have a faster way” said Prashant, “I can jump down from the terrace” → “Talk sense” Sachin said, “You will not reach in one piece. ” • Sachin and Shalini’s reactions are quite expected because Prashant’s solution sounds illogical. • But it is certainly not impossible. • Our resistance to change makes us reluctant to accept something new or different. 98
 • When we have a couple of standard, tried and tested solutions in hand, we stop looking further. • We fall into the syndrome of ‘the good being the enemy of the better. ’ • Having something good, we cease our search for the better. • To be more innovative, we must learn to think in radically different ways, away from conventional patterns of thinking. 99
 Definition and Meaning • Lateral Thinking is defined as a thinking process in which we make deliberate attempts to generate new ideas by introducing a discontinuity in our thought process. • Lateral thinking implies considering a problem from fresh perspective, a point o view which is different from the norm, the obvious. • The change in perspective can be relaxing as well as productive. 100
 • Some examples are: (a) Visualizing the extreme opposite of the situation or reversing the objective. - Suppose you want to bring down your high inventory levels, try thinking “what can be done to increase inventory? ” - This might bring to light some inherent weaknesses in the system. - Even if you don’t strike the solution, you will at least know what Not to do. 101
 (b) Looking at the surroundings of the problem rather than the problem itself. - Suppose you have a machine that breaks down frequently. - Is it a machine designed for air-conditioned room but kept at room temperature. (c) Challenging the assumption - Believe that your information is wrong. - Try something that goes against the assumption. - It may turn out that some of the old ways can be improved or replaced. 102
 The Principles of Lateral Thinking (a) Background - The need for Lateral Thinking arises from the fact that dominance of an idea or concept suppresses other useful and efficient ideas stopping the progress. - Dominance blocks the way to explore continuously more and more useful and efficient ideas stopping the progress. 103
 (b) Escape - This principle suggests recognition of the dominant idea and deliberate search for alternate ways of doing things. - The search has to be for alternate ways and not for the best way. (c) Provocation - This assumes that it may be necessary to be wrong at some stage in order to reach the final right solution. - Therefore, we use one idea to provoke or generate another set of ideas, rather than checking its individual correctness. 104
 Difference Between Conventional Thinking and Lateral Thinking Conventional (Vertical) Thinking Lateral Thinking Conventionally we think to chose and prove something. Here we think to generate and explore ideas. It is in search of answers. It is in search of questions. Uses information in its meaning. Uses information for its effect. Seeks continuity i. e. expects one thing to follow another. Seeks discontinuity. Concentrates only on relevant facts eliminating irrelevant facts. Doesn’t consider anything as irrelevant. It is a close ended procedure aimed at result. It is an open ended process giving maximum results, but makes no promise. 105
 Whole Brain Thinking → “Reaching Somaiya Campus……. . Visiting SIMSR, the canteen…. …The first day of the class…. . new faces, new ways of learning……. . ” →“Hey, where are you, ” said Shalini, snapping her finger in front of Vaibhavi’s face. → Suddenly, coming back to reality, Vaibhavi shook her face and said smilingly, ‘just moved from my right brain to the left. ’ →What did she mean? → She was referring to the split-brain theory. 106
 The Split-Brain Theory • The theory proposed by neurosurgeon Rober Sperry says that our abilities, skills and personality traits are strongly influenced by our habit of using one side of the brain more than the other. • The two hemispheres of our brain have distinct thinking processes. • Visualization, emotions, intuition, and motor skills are housed in the right brain. 107
 • Logic and communication are functions of the left brain. • Our genes and the way we have been brought up or trained often determines which hemisphere of our brain we prefer to use and in turn that determines the way we function. • We could be right dominated or left and accordingly our interests or abilities would emerge. • Artists or sportspersons are right dominated while those excelling at maths or language would be left dominated. 108
 • Whatever our dominance or preference be, we do make automatic shifts as per the occasion. • When Vaibhavi was daydreaming, her right brain was at work. • And then she experienced a shift as she used her left brain to analyze what she had been doing. • Typically, we use our right brain while listening to music or while painting and the left brain while speaking or solving a puzzle. 109
 Examples of your Hemispherical Dominance → How would you go about solving a problem? • Would you follow an organized approach like defining the problem and breaking into parts, conducting research and recording possible solutions, eliminating the non-viable solutions and then selecting the best of the rest? • If yes, then you are probably a left dominant. • A right dominant person would try to see the picture as a whole, get a feel of what will work and place his trust in hunches or gut feeling. 110
 → How would you guide a person to a particular place if asked to give directions. • A left dominant person would be precise and say something like “take the second left and then the first right. ” • Right dominant go for visuals cues, say “Turn left when you come across this tall green building with a dome-shaped structure at the top. ” 111
 Why Whole Brain Thinking? • Ever tried giving a speech? • The best of the words and impeccable grammar wouldn’t be sufficient to deliver an effective rhetoric. • In terms of public speaking, we would say that speech needs to come from the heart to make an impact. • If we use the terms of split brain theory, we would say that in order to speak well, we must use both sides of the brain. 112
 • Left brain skill to form thoughts into words and the right brain ability to give the speech an emotional touch, thus making it more absorbing. • Learning to use both sides of brain would help unleash a little more of the enormous amount of brain power we have. • We would be able to take better control of situations if we consciously selected the taskappropriate hemisphere to meet each demand. • If we think in terms of management functions: planning, organizing, communicating etc these are all left brain skills. 113
 • Increasingly, managers are recognizing that problems cannot be solved by logic, discipline, and detailed analysis. • To arrive at better solutions, free-spirited innovation and comprehension of overall picture is equally important. • Hence, we must learn to draw from both the left side of the brain, home of logic and efficiency and the right side of brain, home of creativity, intuition and inspiration. 114
 Delphi Technique in Creativity • A method of pooling a large number of expert judgments through a series of increasingly refined questionnaires i. e. gathering the judgments of experts for use in decision making. • Used for complex, unstructured problems, to develop the strong pros and cons for alternative solutions. • Based on generation of suggestions and arguments and clustering on most favoured and least favoured alternatives. 115
 → The stages are: (1) Generation of individual opinions on the nature of problem and possible solutions. (2) Tabulate results and show them to the group, preserving anonymity. (3) The most and least favoured opinions must be restated, preserving anonymity. (4) The group members read the list of opinions and, individually, re-state their opinions. (5) Results are re-tabulated and shown to the group. 116
 • Track suggested solutions. • Vote on alternatives, their desirability. • Vote on arguments, their importance and validity. → Delphi is based on anonymity of the grop members. →Oriented towards avoiding any direct confrontation. → Decisions with Delphi express opinions rather than facts which require group members to be experts. → Delphi does not require physical presence. 117
 Total Quality management • Total Quality management is defined as an integrated approach in delighting customer – both internal and external- by meeting their expectations on continuous basis, through everyone involved with the organization, working on continuous improvement along with proper problem solving methodology. • The term ‘customer’ refers to all those to whom we supply a product or a service or information. 118
 • Thus, apart from the ultimate users, the retailers and stockists become the external customers to the company while the transporters become the suppliers to the company. • Departments within the company become internal customers to each other. • Thus, the Production department is a customer to the purchase department and supplier to the sales and dispatch department. 119
 Definition of Quality 1. Quality is fitness for use. - Definition put forth by Juran represents the customers’ point of view. - Customers are usually multiple, and they may put the product or service to such multiple uses, which the manufacturers may not have intended. - In any case, customer’s viewpoint is most important as it is he who uses the product. 120
 2. Quality is establishing standards and specifications. - If the customer’s voice in terms of ‘fitness for use’ is to be incorporated into the product or service, it can be done only by laying down standards or specifications for the product or service. - Various agencies such as BIS (Bureau of Indian Standards), United States Pharmacopeia (USP), Japanese Industrial Standards (JIS), International Standards Organization (ISO) establish a list of standards, specifications and tolerances to facilitate manufacture of products of good quality. 121
 3. Quality is conformance to standards - Standards are meaningless unless they are conformed to. - Statistical Process Control (SPC), Poka Yoke (Mistake Proofing), and many Q. C. tools, focus on conformance to standards. • Very peculiarly if 99. 9% conformance to standards is maintained in the product, the customer satisfaction does not rise proportionately. 122
 • When the conformance to standards reaches 100%, the customer satisfaction jumps to 100%. • Customer delight, is all about gaining customer satisfaction in excess of 100%. • Attempting customer delight before customer satisfaction is impossible. ► A significant view of Total Quality Management. • Meeting the agreed requirements of the customer, at the lower cost, first time and every time. 123
 • The standards and specifications provided by the customer constitute the agreed requirements of the customer. • First time every time means without rework or rejection. • TQM is not one time activity but has to be pursued by all the employees of the organization continuously. 124
 Deming’s 14 points of Management 1. Create constancy of purpose for the improvement of product and service. - Establishing constancy of purpose means • Innovation • Put resources into research and education • Continuously improve in product and service • Invest in the maintenance of equipment, furniture and fixtures. 125
 2. Adopt the new philosophy - Don’t ask your customers to pay for your defects and delays. 3. Cease dependency on Mass Inspection - Quality comes not from inspection but from improvement of the process. - If products are of high quality then there should not be any need for inspection. - Inspection of finished product would mean just a rework. - If the problem can be eliminated at first stage then it is possible that the final product will be defect free. 126
 4. End the practice of awarding business on price tag alone. - Price has no meaning without a measure of the quality being purchased. 5. Improve constantly and forever the system of production and service. - Improvement is not a one-time process. - To ensure whether a firm is improving or not ask the following questions • Is the firm doing better than a year ago? • Is marketing more effective? 127
 • Whether customer satisfaction has increased? • Whether pride and performance of empolyees has improved? 6. Institute Training and Retraining - Employees should be trained different set of skills for different jobs. 7. Institute Leadership - Leadership is the job of management. - Leadership has to help people do their jobs better and also to take responsibility for their success and failure. 128
 8. Drive out fear - People are afraid of • Losing their raises and promotions. • New assignments • Superior’s threats • Admitting mistakes, etc - Therefore, workers should feel secure so that they will come up with innovative ideas, suggestions and improvements over existing systems. 129
 9. Breakdown barriers between staff areas - It is management job to help the staff areas work together to promote teamwork because people work in systems which management has created. 10. Eliminate the slogans, exhortations and targets for the workforce - Due to slogans, employees feel offended instead of being inspired. - A goal without a method for reaching it is useless. 130
 11. Eliminate numerical quotas - It turns out to be numbers rather than quality. 12. Remove barriers to Pride of Workmanship - Management should listen and watch workers voicing their frustrations at being unable to perform their jobs the way they should like to. 13. Institute a vigorous programme of Education and Retraining - It is not enough to have good people in the organization. - They must be continually acquiring the new knowledge and new skills. 131
 - Education and retraining – an investment in people- are required for long term planning. 14. Take action to accomplish the transformation - Every employee of the company, including the manager should acquire a precise idea of how to improve quality continuously. - The initiative must come from the management. 132
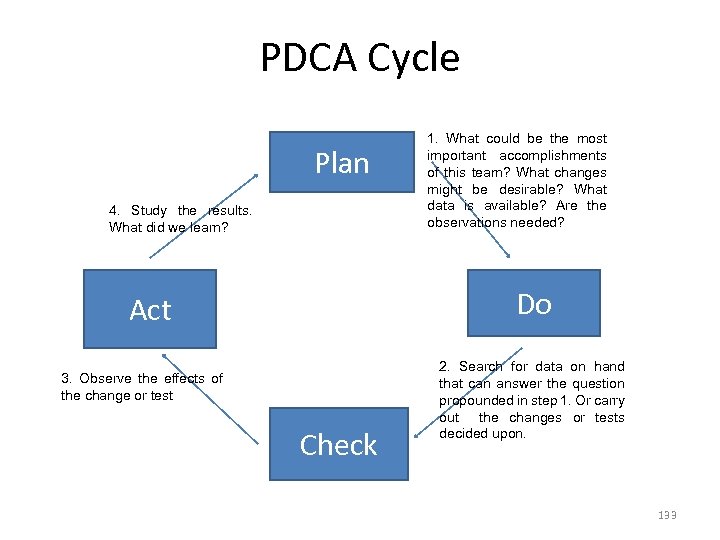 PDCA Cycle Plan 4. Study the results. What did we learn? 1. What could be the most important accomplishments of this team? What changes might be desirable? What data is available? Are the observations needed? Do Act 3. Observe the effects of the change or test Check 2. Search for data on hand that can answer the question propounded in step 1. Or carry out the changes or tests decided upon. 133
 • Step 1. - Study the process, decide what changes might improve it. - Organize appropriate teams. - The team to comprise of people from engineering, purchase, production etc. - Find what data are necessary. - Do the data already exists or is it necessary to carry out a change and observe it? 134
 • Step 2. - Carry out tests or make the change, preferably on a small scale. • Step 3. - Observe the effects • Step 4. - Understand the outcome of the test. - Repeat the test if necessary, preferably in a different environment. 135
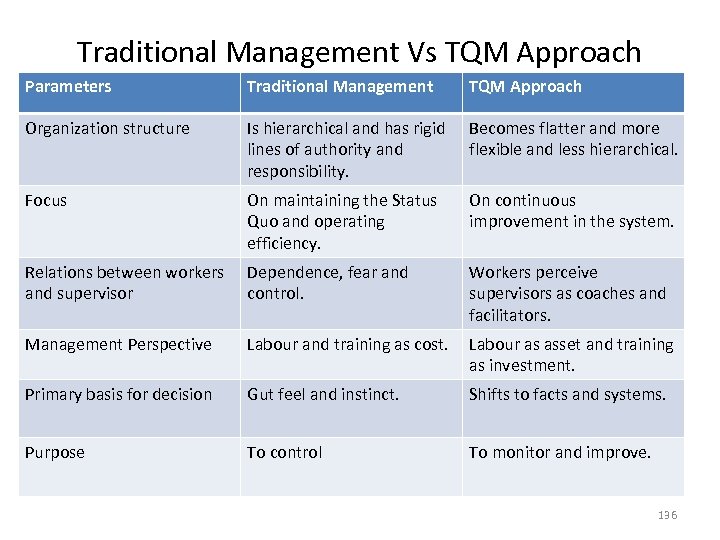 Traditional Management Vs TQM Approach Parameters Traditional Management TQM Approach Organization structure Is hierarchical and has rigid lines of authority and responsibility. Becomes flatter and more flexible and less hierarchical. Focus On maintaining the Status Quo and operating efficiency. On continuous improvement in the system. Relations between workers and supervisor Dependence, fear and control. Workers perceive supervisors as coaches and facilitators. Management Perspective Labour and training as cost. Labour as asset and training as investment. Primary basis for decision Gut feel and instinct. Shifts to facts and systems. Purpose To control To monitor and improve. 136
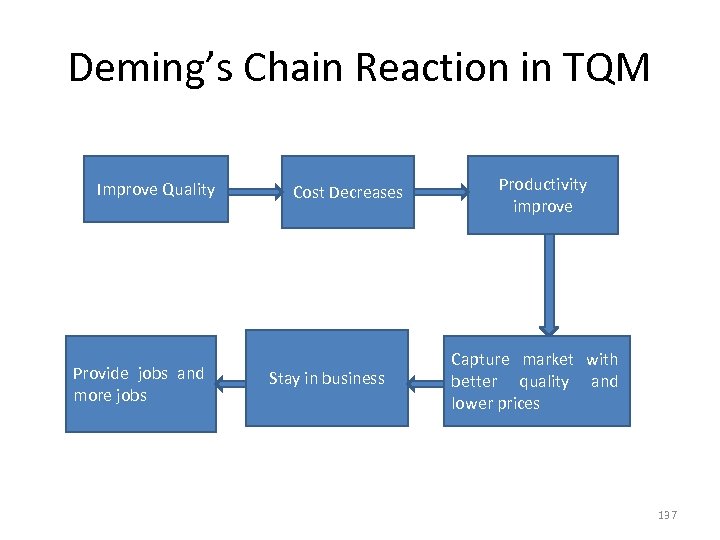 Deming’s Chain Reaction in TQM Improve Quality Provide jobs and more jobs Cost Decreases Stay in business Productivity improve Capture market with better quality and lower prices 137
 Quality Trilogy in TQM-Juran • Juran defines quality as fitness fr use in terms of design, conformance, availability, safety, and field use. • Juran introduced the managerial dimensions of planning, organzing, and controlling and focused on the responsibility of management to achieve quality and need for setting goals. • Juran was less concerned with detailed techniques of quality control and much more centered on the idea of management responsibility. 138
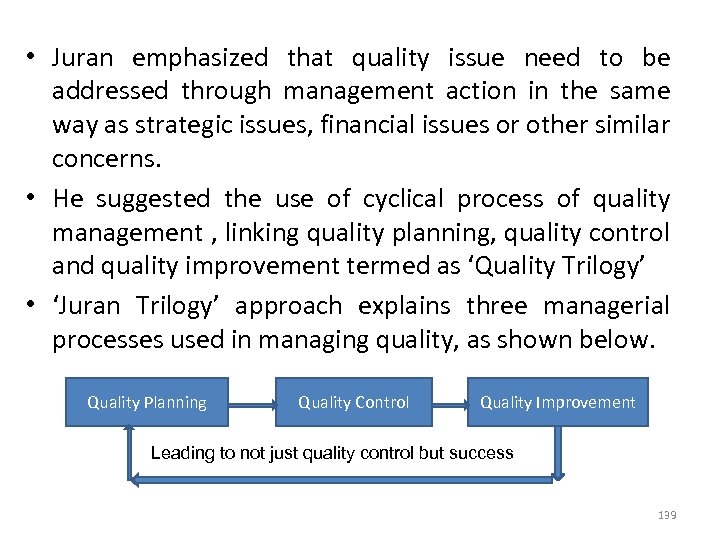 • Juran emphasized that quality issue need to be addressed through management action in the same way as strategic issues, financial issues or other similar concerns. • He suggested the use of cyclical process of quality management , linking quality planning, quality control and quality improvement termed as ‘Quality Trilogy’ • ‘Juran Trilogy’ approach explains three managerial processes used in managing quality, as shown below. Quality Planning Quality Control Quality Improvement Leading to not just quality control but success 139
 ►Quality Planning • Objective: To achieve a process capable of meeting quality goals. - Identify customer needs (internal and external) - Identify customer needs - Develop features that satisfy customer needs - Establish quality goods - Process capability. ►Quality control • Objective: To achieve conduct of operations according to quality plans. 140
 - Choose units of measurement - Establish how to measure - Establish standards of performance - Measure actual performance - Interpret difference (Standard v/s actual) - Take actions on the difference ► Quality improvement • Objective: To achieve conduct of operations at levels of quality distinctly superior to planned performance. 141
 - Prove the need for improvement Build awareness of opportunities to improve Organize for diagnosis Provide remedies Prove remedies are effective 142
 Value Analysis and Value Engineering • Value Analysis is a technique that allows to increase the value of a product or a service systematically, eliminating all the functions that do not add any value or benefit to the product. • A product or process exists to fulfill a need. • This need or set of needs is termed as a function, that the product or process satisfies. • For instance, knife exists to fulfill the need of cutting and hence to cut is the function of knife. 143
 What is meant by term Value? • Value is a function of ‘Desired Performance’ and ‘Cost’. • Expressed as Desired Performance (P) ÷ Overall Costs (C) • Desired performance is expressed by the term worth which is defined as the lowest cost to achieve the Use (work) function and Aesthetic (sell) function. 144
 How do define VA & VE • Very often the two terms Value Analysis and Value Engineering are used synonymously. • However, difference between them will be clear from the way they originated. How VA originated? • During the Second World War, U. S. government reserved certain materials from armament industry. • Therefore, General Electric Company found itself in fix as many of their regularly used materials suddenly became unavailable due to reservation. 145
 • A purchase executive of the company, Lawrence D. Miles made many substitutions in place of original materials. • Surprisingly, the results showed that substituted materials did not affect the quality but brought costs down. • Later Larry developed a step by step approach for this exercise and named the technique as Value Analysis. Thus it is a step by step approach to identify the functions of a product, process, system or service; to establish a monetary value for that function and then provide the desired function at an overall minimum cost without affecting any of the existing parameters like Quality, Maintainability, Productivity, Safety and other Performance Characteristics. 146
 • In the year 1954, U. S. Navy Bureau of Ships adopted same technique in their effort at ‘cost avoidance’ during the design stage and saved million of dollars. • They named this technique as Value Engineering is where the value of all components used in construction of a product from design to final delivery stage are completely analyzed and pursued. • Thus, Value Engineering indicates application at design stage whereas Value Analysis is the application on the product that is into manufacturing. 147
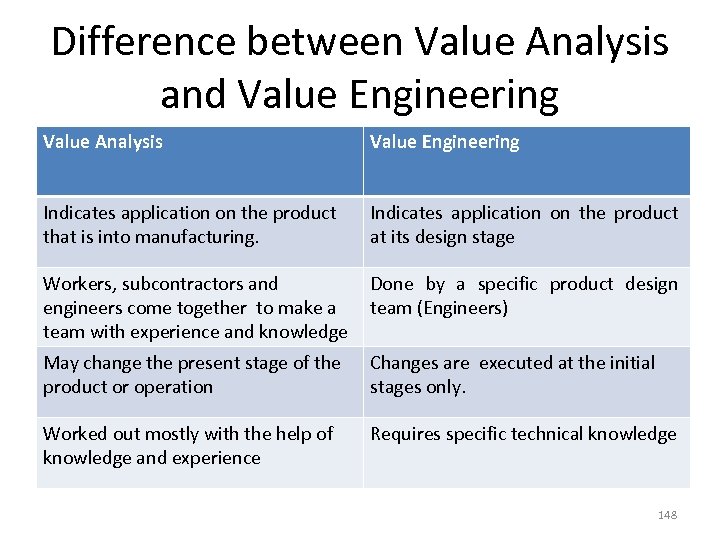 Difference between Value Analysis and Value Engineering Value Analysis Value Engineering Indicates application on the product that is into manufacturing. Indicates application on the product at its design stage Workers, subcontractors and engineers come together to make a team with experience and knowledge Done by a specific product design team (Engineers) May change the present stage of the product or operation Changes are executed at the initial stages only. Worked out mostly with the help of knowledge and experience Requires specific technical knowledge 148
 What is the meaning of overall costs? For a manufacturer/ producer • Overall cost is summation of all elements of the costs required to produce or service such as labour, material, overhead etc. For a consumer • Overall cost is the monetary sum (price) for which the product or service is purchased in the market. 149
 The Value of the a function V= P/C can be increased by four methods. (1) Decrease the cost while ensuring the same level of performance. • Reduce thickness of wooden drums in case of packing of telephone cables. • Earlier CDs and DVDs were sold at above Rs 100/Moser Baer introduced the same at almost half the price. (2) Enhance the performance at the same cost • Providing a supplement of Mumbai Mirror along with the copy of The Times of India at no extra cost. 150
 (3) Decrease the cost and increase the performance • Intel’s Pentium chip is cheaper and has much more processing power than all its earlier chips. (4) Increase both performance and cost ensuring that performance increases more than the increase in cost. • American cola giant increased quantity of soft drink from 250 ml to 300 ml (20% more) but increased price just by 10% In all the above cases ‘cost’ is viewed at from customer’s point of view. 151
 Value Analysis Tests ►Each product or component is subjected to the following tests: • Does its use contribute value? • Is its cost proportional to its usefulness? • Does it need all its features? • Is there anything better for the intended use? • Can a usable part be made by lower cost method? • Can a standard product be found which will be usable? • Is it made on proper tooling, considering quantities used? • Do materials, reasonable labour, overhead, and profit total its cost? • Will another dependable supplier provide it for less? • Is anyone buying it for less? 152
 Functions-Use and Aesthetics A. Use function - Prashant wants to go for a trek to a place 15 kms from Karjat. He wants to purchase shoes that will protect his feet from stones and thorns etc. Therefore he opts for ‘Hunter shoes’. - To protect feet is called as the Use Function of the shoes. B. Aesthetic function - Parag is preparing for prize distribution ceremony of his college. Dressed in blazer he will be putting on black leather shoes with good appearance. - To give good appearance is called as the Aesthetic Function of shoes. Use and Aesthetic functions are always present in all the products. Depending on the user and the need, one function assumes predominance over other. 153
 Primary Function & Secondary Function • AR Dairies is a Mumbai based milk and dairy products company. They used to supply milk (cow and buffalo) in 500 ml glass bottles. Lately they have introduced Masala Milk in 200 ml bottles, which became an instant success. While Masala Milk is supplied throughout the day, other type of milk is supplied only in the morning. While going through the audit reports, Shalini found that there is a transit loss of 2% due to breakage of bottles. To overcome that Shalini introduced polythene bags in place of 500 ml bottles. However Masala Milk continued to be sold in glass bottles. • Why did Shalini not introduce polythene bags for Masala Milk? 154
 • The Primary Function of bottle is ‘to hold the liquid’ and Secondary Function is ‘to facilitate drinking’. • In this case, shape of the bottle facilitates drinking; however when primary function is achieved by some other means i. e. polyethylene bag then secondary function ceases to exist. • As a consumer drinks Masala Milk on the spot, secondary function of facilitation of drinking is very important whereas cow milk or buffalo milk is never drunk without heating it. • Therefore Shalini could sacrifice secondary function in case of cow & buffalo milk but not in case of Masala Milk. 155
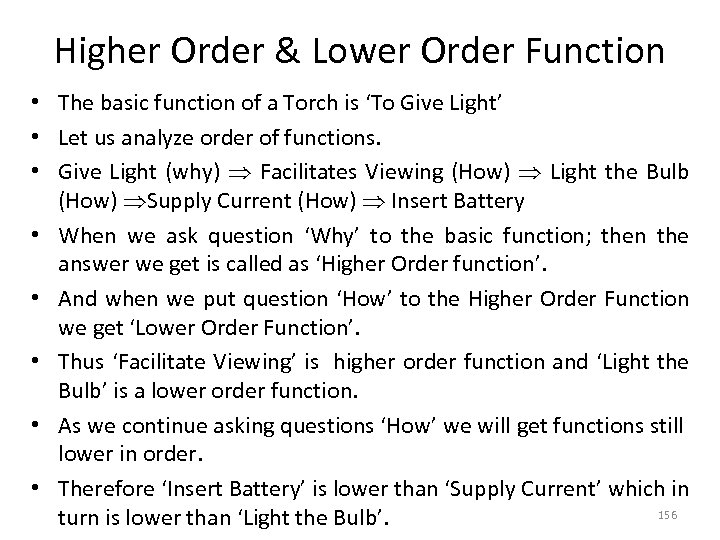 Higher Order & Lower Order Function • The basic function of a Torch is ‘To Give Light’ • Let us analyze order of functions. • Give Light (why) Facilitates Viewing (How) Light the Bulb (How) Supply Current (How) Insert Battery • When we ask question ‘Why’ to the basic function; then the answer we get is called as ‘Higher Order function’. • And when we put question ‘How’ to the Higher Order Function we get ‘Lower Order Function’. • Thus ‘Facilitate Viewing’ is higher order function and ‘Light the Bulb’ is a lower order function. • As we continue asking questions ‘How’ we will get functions still lower in order. • Therefore ‘Insert Battery’ is lower than ‘Supply Current’ which in 156 turn is lower than ‘Light the Bulb’.
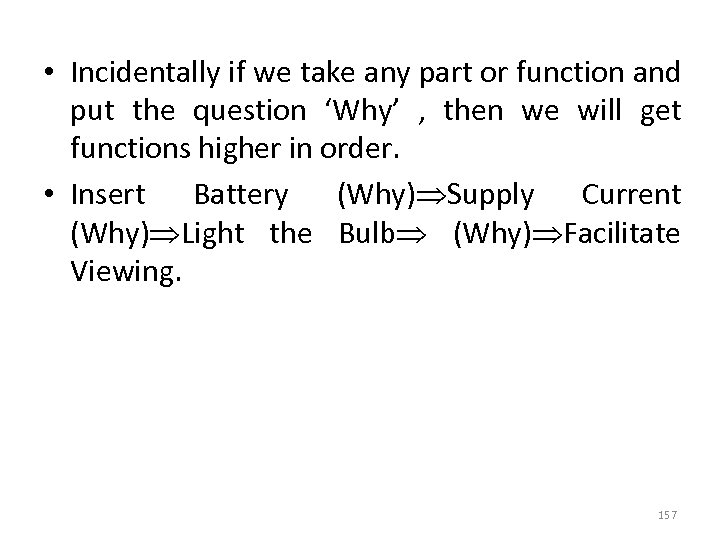 • Incidentally if we take any part or function and put the question ‘Why’ , then we will get functions higher in order. • Insert Battery (Why) Supply Current (Why) Light the Bulb (Why) Facilitate Viewing. 157
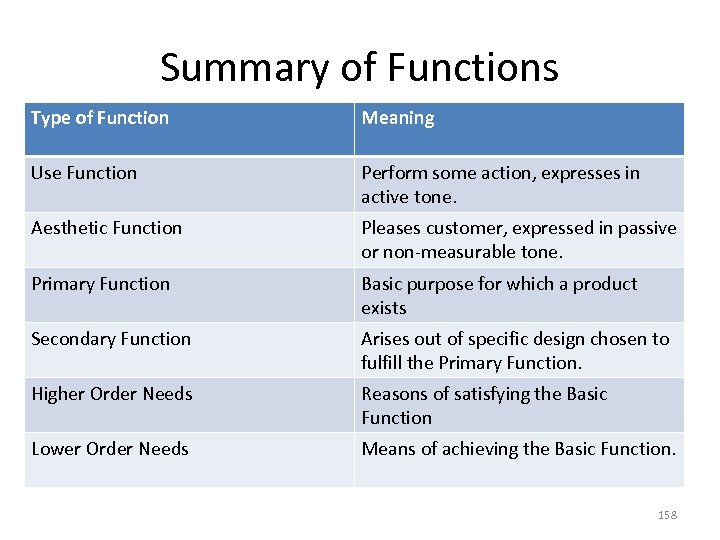 Summary of Functions Type of Function Meaning Use Function Perform some action, expresses in active tone. Aesthetic Function Pleases customer, expressed in passive or non-measurable tone. Primary Function Basic purpose for which a product exists Secondary Function Arises out of specific design chosen to fulfill the Primary Function. Higher Order Needs Reasons of satisfying the Basic Function Lower Order Needs Means of achieving the Basic Function. 158
 A product can have more than one primary function • For example, LPG cylinder apart from holding the LPG must also withstand high pressure and must prevent leakage of gas. Therefore any cylinder design must address all these factors. Many times some of the secondary functions are unnecessary or even undesirable. • For example, Lamp used for producing image in OHP also produces heat that calls for fan. The fan is quite unnecessary but with present level of technology we have not been able to produce light without heat. • Therefore, a customer has to pay for fan even though it does not add any direct value to him. 159
 Function Analysis System Technique • Helps in a thorough understanding of the scope and intricacies of the problem under study. • Provides a determinate logic for testing the functions. • Assists in identifying the basic, required secondary and unwanted functions, and establishes their interlinking in a logical sequence. • Highlights the missing links or functions which might have been overlooked. • Demonstrates that the problem has been thoroughly analyzed by the team and helps in persuading the decision makers to accept the VE team recommendations 160
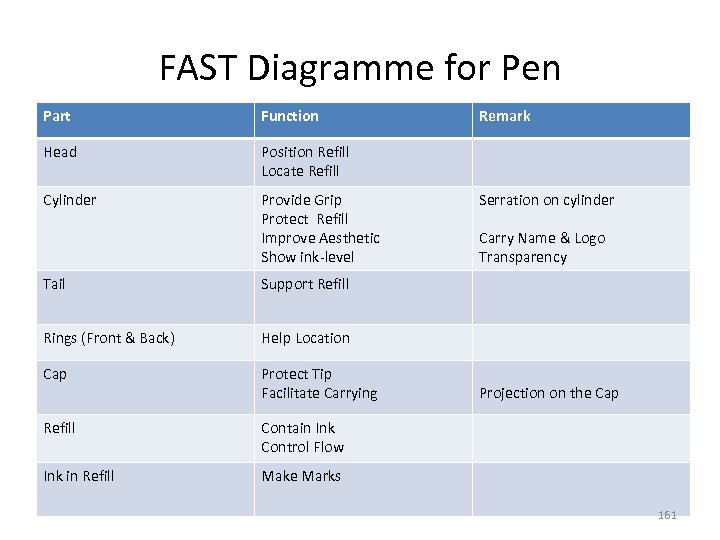 FAST Diagramme for Pen Part Function Head Position Refill Locate Refill Cylinder Provide Grip Protect Refill Improve Aesthetic Show ink-level Tail Protect Tip Facilitate Carrying Refill Contain Ink Control Flow Ink in Refill Carry Name & Logo Transparency Help Location Cap Serration on cylinder Support Refill Rings (Front & Back) Remark Make Marks Projection on the Cap 161
 The alternatives can be (1) Eliminate head and make it part of Cylinder (2) Eliminate Tail and make it part of Cylinder (3) Eliminate Rings Financials & Operational Report (1) Design change suggested (2) Reason for change (3) Additional expenditure required for new die, advertising expenses etc. (4) Savings (cost of rings, elimination of one process etc. ) 162
 Principles of Value Analysis • Do not use a part that does not contribute to the value of the product. • Do not use a part whose cost is not proportional to its function/ usefulness. • Do not provide any features to the component or finished product that are not absolutely required. • Accept change if part of required quality is made by a process costing less than the alternative process. • Use standardized parts wherever possible. • Use proper manufacturing methods taking into account the quantities. • Use the material best suited for the purpose. • Purchase the part instead of in-house manufacturing if suitable supplier can provide the part of good quality at a reasonable price. 163
 When to Apply Value Analysis? • Products are losing their market share and there is a decline in sales. • Products are priced higher than competition in a price sensitive market or product cost is > sales price of competition. • New designs to be undertaken. • Rising manufacturing costs. 164
 Reasons for Unnecessary Costs • Lack of relevant information leads to wrong decisions which increase costs. • Wrong beliefs in accepting opinions. • Lack of ideas. 165
 Strategic Steps In Value Analysis • Determine function and cost of each element in finished product. • Consider alternatives that fulfill functions. • Select best alternative which includes standardized materials and standardized dimensions. • Strategic choice of make products or subcontract. • Modify design to reduce costs. 166
 Value Analysis Procedure Identify items to be analyzed. Differentiate whether item or process. Identify internal and external customers. Identify basic functions. Identify secondary functions which support basic. To prioritize determine value or importance to customer of each function. • Break item/process into constituent components by using flow chart. • Associate components with functions. • Look for components which can be modified or eliminated. • • • 167
 Options in Value Analyses/Value Engineering • • Modify Integrate Substitute Simplify 168
 When to Use Value Analysis/Value Engineering • Aim is to evaluate real value of Product/process • Focus is on saving costs • Aim is on increasing value of process/product. 169
 Benefits of Value Engineering • Cost reduction /elimination techniques. • Balances costs and performance • Prevents overdesign of product (Customer Function Deployment) • Increases profits and reduces costs. • Increases customer satisfaction 170
 Examples of Value Analysis • Modify-Motor car engines have been modified to run on LPG/CNG • Integrate-Air conditioner and heater integrated into one unit. • Substitute-In-house wiring has been changed from copper to aluminum or coke bottles changed from Glass to Plastic. • Simplify-Application software simplified by being made modular. Earlier all modules were bundled or an equipment made modular which simplifies transportation and maintenance 171
 THANK YOU 172


