c80b46b606fe216f98cc2513652214f4.ppt
- Количество слайдов: 104


Problem-Solving/Rt. I: Implementing an Intervention Data Collection System with Integrity NASP Annual Convention New Orleans, LA George M. Batsche Professor and Co-Director Institute for School Reform Florida Problem-Solving Rt. I Statewide Project Jose’ M. Castillo PS/Rt. I Project Evaluator Rt. I Coach - Pasco County School District University of South Florida

The Vision • 95% of students at “proficient” level • Students possess social and emotional behaviors that support “active” learning • A “unified” system of educational services – One “ED” • Student Support Services perceived as a necessary component for successful schooling

Components of the Organizational Delivery System • Academic and Behavior Instruction • Learning Supports • Leadership
 providing high-quality instruction/intervention")
Response to Intervention • Rt. I is the practice of (1) providing high-quality instruction/intervention matched to student needs and (2) using learning rate over time and level of performance to (3) make important educational decisions. (Batsche, et al. , 2005) • Problem-solving is the process that is used to develop effective instruction/interventions.

Stages of Implementing Problem-Solving/Rt. I • Consensus – Belief is shared – Vision is agreed upon – Implementation requirements understood • Infrastructure Development – – – Problem-Solving Process Data System Policies/Procedures Training Tier I and II intervention systems • E. g. , K-3 Academic Support Plan – Technology support – Decision-making criteria established • Implementation

The Process of Systems Change • Until, and unless, Consensus (understanding the need and trusting in the support) is reached no support will exist to establish the Infrastructure. Until, and unless, the Infrastructure is in place Implementation will not take place. • A fatal flaw is to attempt Implementation without Consensus and Infrastructure • Leadership must come both from the Principal and from the educators in the building.

Consensus Development: Methods • Knowledge • Data

Consensus Development: Knowledge • Rationale for PS/Rt. I – Impact on students – Reduces disproportionality – Equity in Educaiton • Research – NASDSE Book • Law and Regulations

Building Consensus • Beliefs • Understanding the “Need” • Skills and/or Support

Essential Beliefs • • • Student performance is influenced most by the quality of the interventions we deliver and how well we deliver them- not preconceived notions about child characteristics Decisions are best made with data Our expectations for student performance should be dependent on a student’s response to intervention, not on the basis of a “score” that “predicts” what they are “capable” of doing.

How Do We Know If This is a General Education Initiative? • Priority of superintendent and school board – District Leadership Team – Strategic Plan • Focus is on effectiveness of Tier 1 for disaggregated groups – Unit of Analysis is the BUILDING

How Do We Know If This is a General Education Initiative? • Principal Led – Regular data analysis – Data Days – Team focuses in improving impact of core instruction • Prevention and Early Intervention – Screening and early intervention with Kindergarten students

Contextual Issues Affecting The Problem. Solving Process in General and Special Education • IDEA Re-Authorization – – – – • • • Focus on academic outcomes General education as baseline metric Labeling as a “last resort” Increasing general education options Pooling building-based resources Flexible funding patterns Rt. I Introduced as option for LD eligibility ESEA Legislation-No Child Left Behind National Emphasis on Reading Evidence-based Interventions

Is It All About Reading? Maybe At First! • 52% of IDEA $$ go to LD Programs • 70% +/- of special education “activities” (e. g. , evaluations, staffings, IEPs) related to LD cases • 94% of students in LD because of reading/language arts • 46% of IDEA $$ go to improve reading • Changes in LD Rules will affect the vast majority of special education “activities”
 move")
Why Problem-Solving ? BIG IDEAS • • • AYP and Disaggregated Data (NCLB) move focus of attention to student progress, not student labels Building principals and superintendents want to know if students are achieving benchmarks, regardless of the students “type” Accurate “placements” do not guarantee that students will be exposed to interventions that maximize their rate of progress Effective interventions result from good problem-solving, rather than good “testing” Progress monitoring is done best with “authentic” assessment that is sensitive to small changes in student academic and social behavior
 • Interventions must be “evidence based” (IDEA/NCLB) • Response to Intervention(Rt.")
Big Ideas (con’d) • Interventions must be “evidence based” (IDEA/NCLB) • Response to Intervention(Rt. I) is the best measure of problem “severity” • Program eligibility (initial and continued) decisions are best made based on Rt. I • Staff training and support (e. g. , coaching) improve intervention skills • “Tiered” implementation improves service efficiency

New Regulations: LD • • • The child does not achieve adequately for the child’s age or to meet State-approved grade-level standards in one or more of the following areas, when provided with learning experiences and instruction appropriate for the child’s age or State-approved grade–level standards: • • • The child does not make sufficient progress to meet age or State-approved grade-level standards in one or more of the areas identified in paragraph (a)(1) of this section when using a process based on the child’s response to scientific, research-based intervention;

New Regulations: LD • Data that demonstrate that prior to, or as a part of, the referral process, the child was provided appropriate instruction in regular education settings, delivered by qualified personnel; and • (2) Data-based documentation of repeated assessments of achievement at reasonable intervals, reflecting formal assessment of student progress during instruction, which was provided to the child’s parents.

New Regulations: LD • • • If the child has participated in a process that assesses the child’s response to scientific, research-based intervention-– (i) The instructional strategies used and the student-centered data collected; and • • • (ii) The documentation that the child’s parents were notified about-(A) The State’s policies regarding the amount and nature of student performance data that would be collected and the general education services that would be provided; (B) Strategies for increasing the child’s rate of Learning AND the relationship between student behavior and academic performance.

What Does the USDOE Say? • “The Department does not believe that an assessment of psychological or cognitive processing should be required in determining whether a child has an SLD. There is no current evidence that such assessments are necessary or sufficient for identifying SLD. Further, in many cases, these assessments have not been used to make appropriate intervention decisions. ” (IDEIA, 2004, p. 46651)

Criteria for Special Education Eligibility • Significant gap exists between student and benchmark/peer performance • The Response to Intervention is insufficient to predict attaining benchmark • Student is not a functionally independent learner • Complete comprehensive evaluation

Implications • Tier 1 Decision Making – Ensure that the “core curriculum” is effective – What does “effective” mean? • 80% of students achieving benchmarks • Disaggregated data – Race, SES, LEP – Who determines “effective? ” • Principal, Teacher, Data “Person”

Implications • Poor/lack of instruction must be ruled out • Curricular access blocked by any of the following must be addressed – Attendance – Health – Mobility • Sufficient exposure to and focus on the curriculum must occur • Frequent, repeated assessment must be conducted

Consensus Development: Data • Are you happy with your data? • Building/Grade Level Student Outcomes – Disaggregated – AYP


Infrastructure: Critical Issues • Policies and Procedures – – • • The Model Steps in the Model Decision Rules and Impact on Intervention Development Expectation for Tier Functions/Integration Data Collection and Interpretation Intervention Development Intervention Integrity and Documentation

Infrastructure: Policies and Procedures • Clearly delineate the components of the model – Triangle – 4 -Step Model • Identify steps/skills required for each component • Decision Rules

Problem Solving Process Define the Problem Defining Problem/Directly Measuring Behavior Problem Analysis Evaluate Validating Problem Ident Variables that Contribute to Problem Develop Plan Response to Intervention (Rt. I) Implement Plan Implement As Intended Progress Monitor Modify as Necessary

1. 2. 3. 4. Steps in the Problem-Solving Process PROBLEM IDENTIFICATION • Identify replacement behavior • Data- current level of performance • Data- benchmark level(s) • Data- peer performance • Data- GAP analysis PROBLEM ANALYSIS • Develop hypotheses( brainstorming) • Develop predictions/assessment INTERVENTION DEVELOPMENT • Develop interventions in those areas for which data are available and hypotheses verified • Proximal/Distal • Implementation support Response to Intervention (Rt. I) • Frequently collected data • Type of Response- good, questionable, poor

Problem-Solving/Rt. I Resource Management • Public Education Resource Deployment – Support staff cannot resource more than 20% of the students – Service vs Effectiveness--BIG ISSUE Academic Behavior 1 -5% 5 -10% Students 80 -90%

Intervention Framework • Intensive Interventions Academic – A few • Supplemental Interventions – Some • Core/Universal Interventions – All Behavior 1 -5% 5 -10% Students 80 -90%

How Does it Fit Together? Standard Treatment Protocol Step 2 Step 1 Addl. Diagnostic Assessment All Students at a grade level Intensive Behavior Academics Bench. Mark Assessment Instruction Individual Diagnostic Supplemental ODRs Monthly Bx Screening Step 3 Results Monitoring Individualized Intensive 1 -5% 5 -10% Standard Protocol Small Group Differentiated By Skill weekly 2 times/month Core Annual Testing Step 4 80 -90% None Continue With Core Instruction Grades Classroom Assessments Yearly Assessments

Tier Functions/Integration • How the Tiers work • Time aggregation • Tier integration

How the Tiers Work • Goal: Student is successful with Tier 1 level of supportacademic or behavioral • Greater the tier, greater support and “severity” • Increase level of support (Tier level) until you identify an intervention that results in a positive response to intervention • Continue until student strengthens response significantly • Systematically reduce support (Lower Tier Level) • Determine the relationship between sustained growth and sustained support.
 instruction present at all three levels •")
Integrating the Tiers • Tier 1 (Core) instruction present at all three levels • Purpose of Tier 2 is to improve success in Tier 1 • Purpose of Tier 3 is to improve success in Tier 2 • Is there a single “intervention” plan made up of different Tier services?

Integrating the Tiers • 5 th grade student reading at the 2 nd grade level – Tier 3 • Direct Instruction, Targeted, Narrow Focus (e. g. , phonemic awareness, phonics, some fluency) – Tier 2 • Fluency, vocabulary, comprehension, pre-teach for Tier 1 – Tier 1 • Focus on comprehension, participation, scripted decoding • Use core materials for content • Progress monitor both instructional level and grade placement level skills

Cascade of Interventions • Entire staff understands “triangle” and the available interventions at each Tier. • Supplemental and intensive interventions are in addition to core instruction. • A student intervention plan is a single document that is integrated across the tiers. • Different tiers ensure that outcomes in Tier 1 are improved • Tier 1 progress monitoring data are used for effectiveness determination for all Tiers

Three Tiered Model of School Supports: Anclote Elementary-Pasco County Behavioral Systems Academic Systems Tier 3: Comprehensive and Intensive Interventions Individual Students or Small Group (2 -3) Reading: Scholastic Program, 1 -5% Tier 3: Intensive Interventions Individual Counseling FBA/BIP Teach, Reinforce, and Prevent (TRP) Assessment-based Intense, durable procedures 1 -5% Reading, Mastery, ALL, Soar to Success, Leap Track, Fundations Tier 2: Strategic Interventions Students that don’t respond to the core curriculum Reading: Soar to Success, Leap Frog, CRISS strategies, CCC Lab Math: Extended Day Writing: Small Group, CRISS strategies, and “Just Write Narrative” by K. Robinson Tier 1: Core Curriculum All students Reading: Houghton Mifflin Math: Harcourt Writing: Six Traits Of Writing Learning Focus Strategies 5 -10% Tier 2: Targeted Group Interventions Some students (at-risk) Small Group Counseling Parent Training (Behavior & Academic) Bullying Prevention Program FBA/BIP Classroom Management Techniques, Professional Development Small Group Parent Training , Data 5 -10% Students 80 -90% Tier 1: Universal Interventions All settings, all students Committee, Preventive, proactive strategies School Wide Rules/ Expectations Positive Reinforcement System (Tickets & 200 Club) School Wide Consequence System School Wide Social Skills Program, Data (Discipline, Surveys, etc. ) Professional Development (behavior) Classroom Management Techniques, Parent Training

Decision Rules • Response to Intervention Rules • Linking Rt. I to Intervention Decisions

Decision Rules: What is a “Good” Response to Intervention? • Positive Response – Gap is closing – Can extrapolate point at which target student will “come in range” of peers--even if this is long range • Questionable Response – Rate at which gap is widening slows considerably, but gap is still widening – Gap stops widening but closure does not occur • Poor Response – Gap continues to widen with no change in rate.

Decision Rules: Linking Rt. I to Intervention Decisions • • Positive, Questionable, Poor Response Intervention Decision Based on Rt. I (General Guidelines) – Positive • Continue intervention until student reaches benchmark (at least). • Fade intervention to determine if student has acquired functional independence. – Questionable • Increase intensity of current intervention for a short period of time and assess impact. If rate improves, continue. If rate does not improve, return to problem solving. – Poor • Return to problem solving for new intervention

Data Collection and Interpretation: Issues and Models • • Where to data come from Which data are used across tiers High school applications Data analysis and display

Data Coach • Gathers and Organizes Tier 1 and Tier 2 Data • Supports staff for small group and individual data • Provides coaching for data interpretation • Facilitates regular data meetings for building and grade levels

Skills Required • Collaborative problem solving – Interpersonal – Problem solving process • Data-based decision making – – Collection Management Display & analysis Interpretation • Action planning – Assessment & intervention – Support

Skill Assessment Examples • Measure skills – Problem-solving process – Data-based decision making • Examples – Problem ID - Tier I focus – Hypothesis evaluation – Hypothesis production & validation


Data For Each Tier - Where Do They Come From? • Tier 1: Universal Screening, accountability assessments, grades, classroom assessments, referral patterns, discipline referrals, common assessments • Tier 2: Universal Screening - Group Level Diagnostics (maybe), systematic progress monitoring, large-scale assessment data and classroom assessment, common assessments • Tier 3: Universal Screenings, Individual Diagnostics, intensive and systematic progress monitoring, formative assessment, other informal assessments

High School Data • Skill or Content Assessment • Skill – Use existing reading/math skill assessments • Content – Use “Common Assessments

Common Assessments • Based on State-Approved, Content Area Standards • Syllabus expected to reflect those standards • Common assessment given every 3 rd week • Data aggregated and disaggregated

Common Assessments: Interpretation • Mean level of performance of all students – Disaggregated by section – Disaggregated by demographics – Are 80% of students attaining 70% accuracy? If not, implications for core instruction--Problem Solving – Is syllabus implementation on track? • Compare individual student performance to group data.

Intervention Development • Tiers 1 and 2 • Critical Components • Evidence-based

Data Infrastructure: Using Existing Data to Predict Intervention Needs • Previous referral history predicts future referral history • How do we interpret teacher referrals? • Previous intervention history predicts future intervention history • How do we use this information to establish an infrastructure for change?
 for past 2 -3")
Data-Driven Infrastructure: Establishing a Building Baseline • Code referrals (reasons) for past 2 -3 years – Identifies problems teachers feel they do not have the skills/support to handle – Referral pattern reflects skill pattern of the staff, the resources currently in place and the “history” of what constitutes a referral in that building – Identifies likely referral types for next 2 years – Identifies focus of Professional Development Activities AND potential Tier II and III interventions – Present data to staff. Reinforces “Need” concept

Data-Driven Infrastructure: Establishing a Building Baseline • Assess current “Supplemental Interventions” – Identify all students receiving supplemental interventions – For those interventions, identify • Type and Focus (academic, direct instruction, etc) • Duration (minutes/week) • Provider – Aggregate • Identifies instructional support types in building • This constitutes Tier II and III intervention needs

Implications for High Schools • Focus is on BOTH skill and content. • Primary problems: – Students who cannot read well enough to get the content. – Students who do not have the skills to study and maintain content OR do not have sufficient time and organizational skills. • High school difficulties should be identified and predicted in middle school. • High school interventions should be a continuation of middle school interventions--not separate.

Data Cannot Be a Barrier • Data should be: – Collected efficiently – Easy to manage – Displayed graphically – Easily interpretable

Benchmark Data Made Easy


OPM Made Easy


H

H

www. swis. org

www. swis. org

Intervention Development • Criteria for “Appropriate” and “Effective” Interventions: – Evidence-based • • Type of Problem Population Setting Levels of Support • Focused on most important needs • Group interventions have priority • Interventions MUST be linked to Tier 1 focus, materials, performance criteria
 – HOW much more time")
Interventions: Tier 2 • First resource is TIME (AET) – HOW much more time is needed? • Second resource is curriculum – WHAT does the student need? • Third resource is personnel – WHO or WHERE will it be provided?

Tier 2: Getting TIME • “Free” time--does not require additional personnel – – • • Staggering instruction Differentiating instruction Cross grade instruction Skill-based instruction Standard Protocol Grouping Reduced range of “standard” curriculum After-School Home-Based

Tier 2: Curriculum • Standard protocol approach • Focus on essential skills • Most likely, more EXPOSURE and more FOCUS of core instruction • Linked directly to core instruction materials and benchmarks • Criterion for effectiveness is 70% of students receiving Tier 2 will reach benchmarks

Tier 2: Personnel • • • EVERYONE in the building is a potential resource Re-conceptualize who does what Personnel deployed AFTER needs are identified WHERE matters less and less REMEMBER, student performance matters more than labels, locations and staff needs. • A school cannot deliver intensive services to more than 7% of the population

Evidence-Based • Nationally Evidenced – Select to increase probability of success • Locally Validated – Local outcome data used to evaluate degree to which interventions “worked” – Local outcome data trumps national “evidence. ”

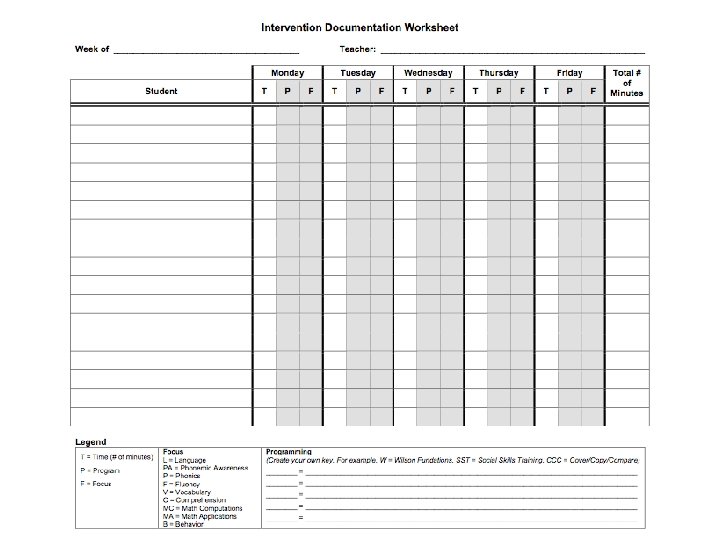
Intervention Support and Documentation • Intervention Integrity • Intervention Support • Intervention Documentation

Intervention Integrity • Enhanced through two practices – Intervention Support System – Intervention lmplementation Documentation

Intervention Support • Intervention plans should be developed based on student need and skills of staff • All intervention plans should have intervention support • Principals should ensure that intervention plans have intervention support • Teachers should not be expected to implement plans for which there is no support

Critical Components of Intervention Support • Support for Intervention Integrity • Documentation of Intervention Implementation • Intervention and Eligibility decisions and outcomes cannot be supported in an Rt. I model without these two critical components

Intervention Support • Pre-meeting – Review data – Review steps to intervention – Determine logistics • First 2 weeks – – 2 -3 meetings/week Review data Review steps to intervention Revise, if necessary

Intervention Support • Second Two Weeks – Meet twice each week • Following weeks – – Meet at least weekly Review data Review steps Discuss Revisions • Approaching benchmark – Review data – Schedule for intervention fading – Review data

Program Evaluation

Evaluation of PS/Rt. I Implementation Should • Respect the complexity of schools as social systems • Be organized and systematic • Be used to inform implementers – Formative data collection necessary • Include multiple methods and informants

FL PS/Rt. I Evaluation Model • IPO model used • Variables included – – – – Levels Inputs Processes Outcomes Contextual factors External factors Goals & objectives
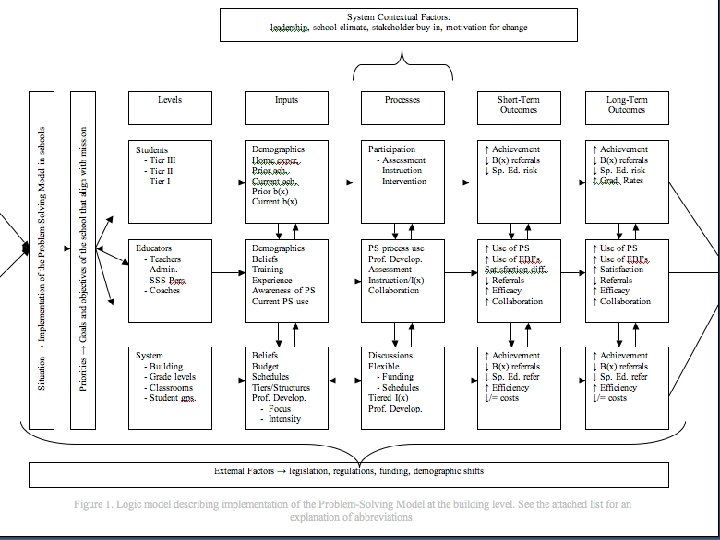

Levels • Students – Receiving Tiers I, II, & III • Educators – – Teachers Administrators Coaches Student and instructional support personnel • System – – District Building Grade levels Classrooms
 • Students – Demographics – Previous learning experiences &")
Inputs (What We Don’t Control) • Students – Demographics – Previous learning experiences & achievement • Educators – – Roles Experience Previous PS/Rt. I training Previous beliefs about services • System – Previous consensus regarding PS/Rt. I – Previous PS/Rt. I infrastructure • • Assessments Interventions Procedures Technology
 • Students – Assessment participation (e. g. , DIBELS screening)")
Processes (What We Do) • Students – Assessment participation (e. g. , DIBELS screening) – Instruction/intervention participation • Educators – Frequency and duration of participation in PS/Rt. I Project training – Content of Project training in which they participated • System – Frequency & duration of professional development offered by the Project – Content of professional development offered – Stakeholders participating in professional development activities – Communication between Project and districts/buildings

Implementation Integrity Checklists • Implementation integrity measures developed • Measure – Steps of problem solving – Focus on Tiers I, II, & III • Data come from: – Permanent products (e. g. , meeting notes, reports) – Problem Solving Team meetings
 • Educators – Consensus regarding PS/Rt. I •")
Outcomes (What We Hope to Impact) • Educators – Consensus regarding PS/Rt. I • Beliefs • Satisfaction – PS/Rt. I Skills – PS/Rt. I Practices


Outcomes cont. • System – PS/Rt. I Infrastructure • • • Assessments Interventions Procedures Technology Costs – PS/Rt. I Implementation


Outcomes cont. • Students – Academic achievement – Behavioral outcomes • Systemic – – Discipline referrals Referrals for problem solving Referrals for SPED evaluations SPED placements

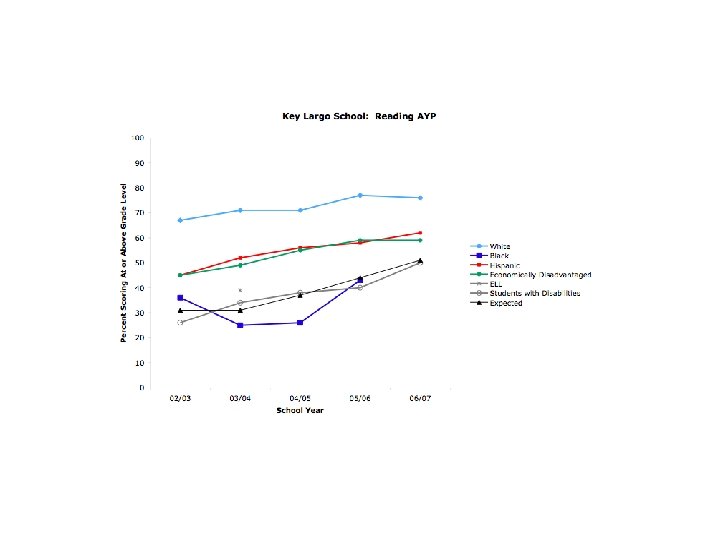
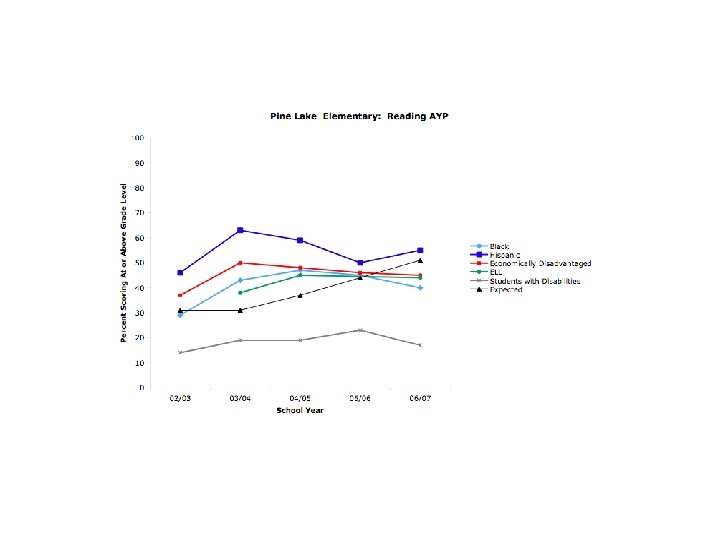
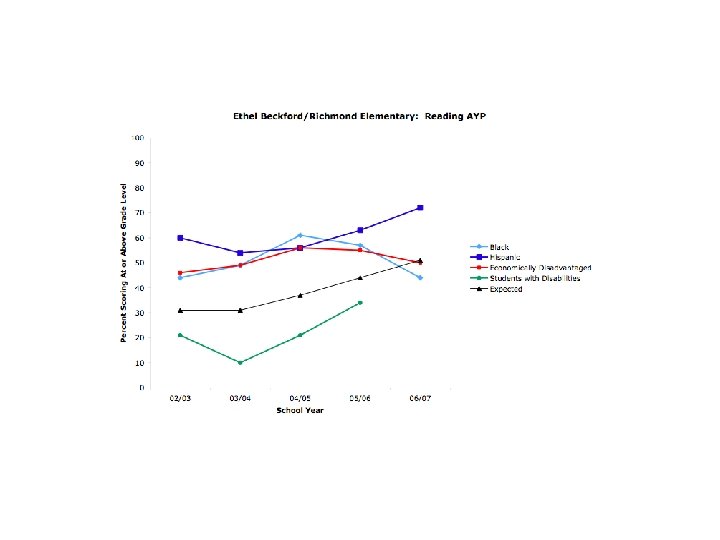
Reading Instruction - Tier I Grade Level

Systemic Outcomes - Office Discipline Referrals

Other Variables to Keep in Mind • Contextual factors – Leadership – School climate – Stakeholder buy-in • External factors – Legislation – Regulations – Policy

School Goals & Objectives • Content Area Targets – Reading – Math – Behavior • Majority focusing on reading • Some selected math and/or behavior as well • Grade levels targeted varied – Some chose K or K-1 – Some chose K-5
c80b46b606fe216f98cc2513652214f4.ppt