Coca-Cola.pptx
- Количество слайдов: 11


PRINCIPLES OF SALES Coca-Cola JEAN COULOMB THEODORE LE QUINIOU MAXIME EBELIN ALINA TKACHENKO ALINA MILOVANOVA

Introduction “Coca-Cola is one of the most recognized brands around the world. Their global expansion and market capitalization has been studied by businesses the world over. Coke has been able to purchase numerous smaller soft drink companies in all areas of the soft drink market and with over 3, 500 different products they own over half of all soft drinks sold. ”

Coke among other soft drinks Soft drink market share Coke 8% 9% Pepsi 26% Diet Coke 8% Moutain Dew 9% Dr. Pepper 15% 10% 15% Diet Pepsi Sprite Other

q 2008 Worldwide Unit Case Volume Geographic Mix 15% 17% Eurasia & Africa Europe 17% Pacific 24% North America 27% Latin America
 29 22 18")
Volume by region Worldwide Unit Case Volume Geographic Mix 2011 (%) 29 22 18 Latin North America/South America Pacific 16 15 Eurasia & Africa Europe
 50 45 40 35 30")
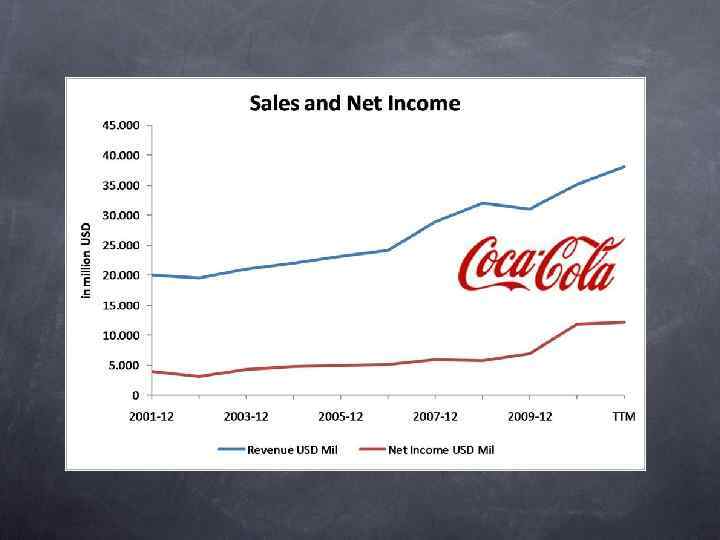
Coke Turnover Evolution of the Coke turnover ($ billions) 50 45 40 35 30 25 20 15 10 5 0 2000200120022003200420052006200720082009201020112012

USA 35000 30000 25000 20000 15000 Sales 10000 Total Net Income 5000 20 01 20 02 20 03 20 04 20 05 20 06 20 07 20 08 20 09 20 10 0
 Sales from 2008 to 2012 70 Percentage 60 50 40")
Return on sales (%) Sales from 2008 to 2012 70 Percentage 60 50 40 Gross profit margin 30 Operating profit margin 20 Net profit margin 10 0 Dec Dec Dec 31, 2008 31, 2009 31, 2010 31, 2011 31, 2012
")
Return on investment 60 50 40 30 20 10 0 Return on equity (ROE) D 01 2 ec 31 , 2 01 1 31 , 2 ec D ec 31 , 2 00 9 D D ec 31 , 2 ec D 01 0 Return on Assets(ROA) 00 8 Percentage Investment from 2008 to 2012
Coca-Cola.pptx