
Principles of Pharmacoeconomics Kem P. Krueger, Pharm. D.


principles_of_pharmacoeconomics.ppt
- Размер: 772 Кб
- Количество слайдов: 36
Описание презентации Principles of Pharmacoeconomics Kem P. Krueger, Pharm. D. по слайдам
Principles of Pharmacoeconomics Kem P. Krueger, Pharm. D. , Ph. D. Kimberly Braxton Lloyd, Pharm. D. Auburn University School of Pharmacy
Cost Determination Lecture
Objectives Compare and contrast direct, indirect, and intangible costs Describe the relationship between marginal and average costs Describe the five steps involved in determining the cost of therapy or service
Objectives Given a specific perspective, identify all relevant costs that should be included in an analysis Identify at least five sources of cost data Discuss the differences between costs and charges Explain why discounting is necessary and perform the discounting calculation
Cost Data. Measurement of resource use
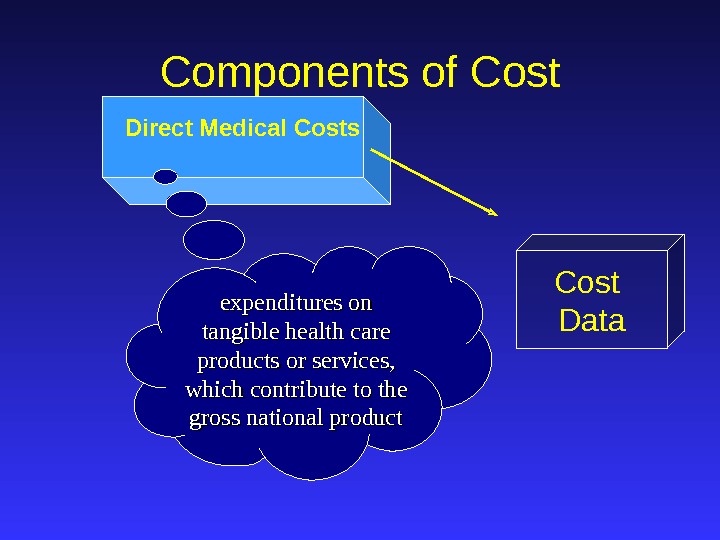
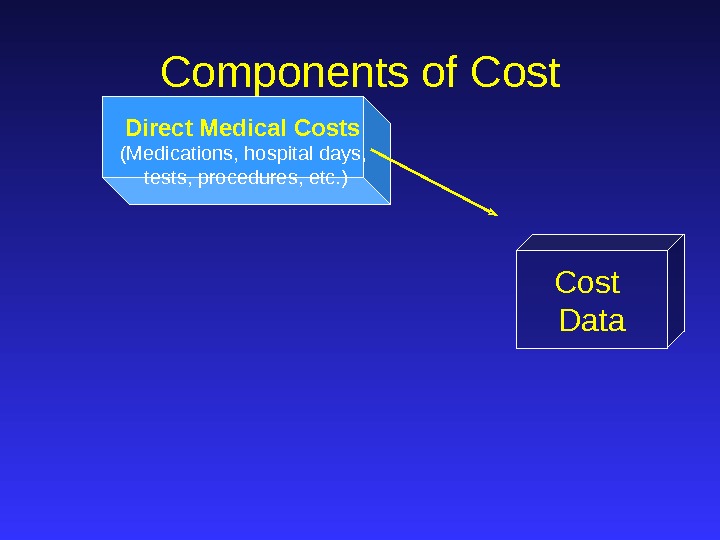
Direct Medical Costs Cost Data. Components of Cost expenditures on tangible health care products or services, which contribute to the gross national product
Direct Medical Costs (Medications, hospital days, tests, procedures, etc. ) Cost Data. Components of Cost
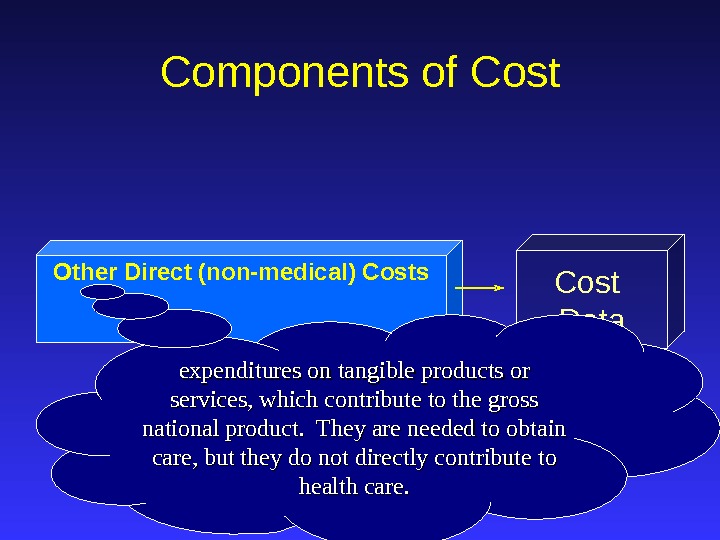
Other Direct (non-medical) Costs Cost Data. Components of Cost expenditures on tangible products or services, which contribute to the gross national product. They are needed to obtain care, but they do not directly contribute to health care.
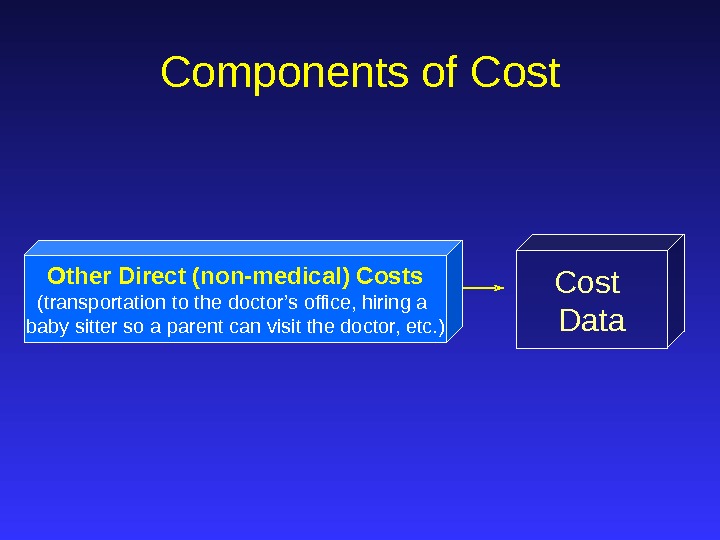
Cost Data. Components of Cost Other Direct (non-medical) Costs (transportation to the doctor’s office, hiring a baby sitter so a parent can visit the doctor, etc. )
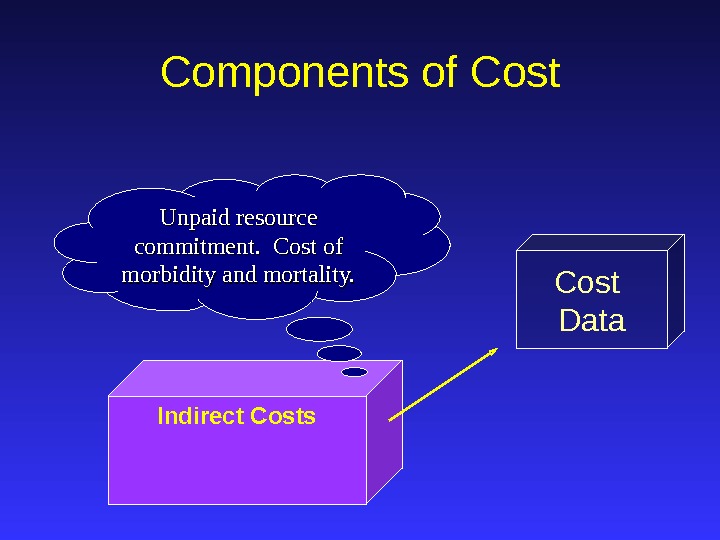
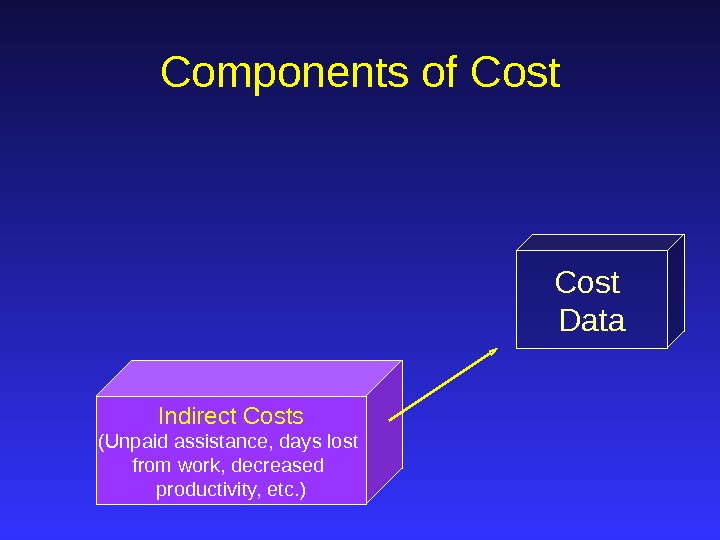
Cost Data. Components of Cost Indirect Costs Unpaid resource commitment. Cost of morbidity and mortality.
Cost Data. Components of Cost Indirect Costs (Unpaid assistance, days lost from work, decreased productivity, etc. )
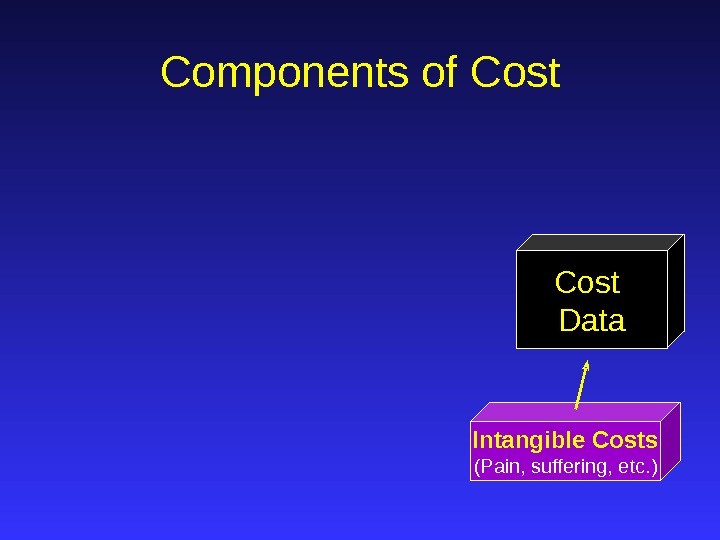
Intangible Costs (Pain, suffering, etc. ) Cost Data. Components of Cost
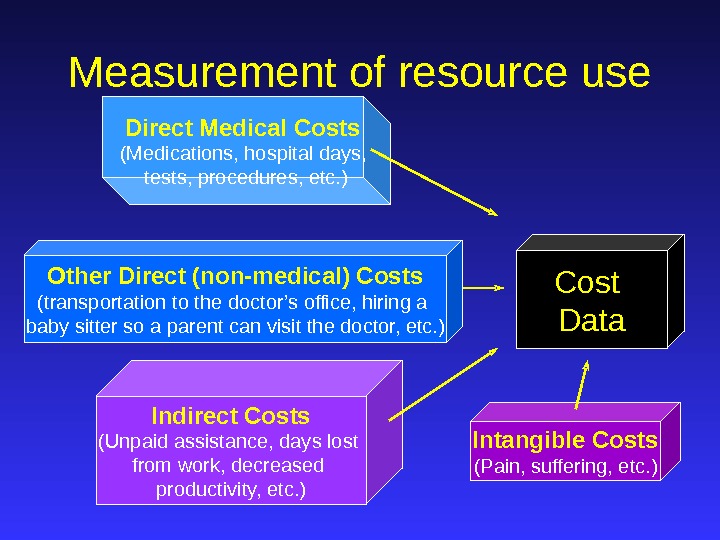
Direct Medical Costs (Medications, hospital days, tests, procedures, etc. ) Intangible Costs (Pain, suffering, etc. ) Cost Data. Measurement of resource use Indirect Costs (Unpaid assistance, days lost from work, decreased productivity, etc. )Other Direct (non-medical) Costs (transportation to the doctor’s office, hiring a baby sitter so a parent can visit the doctor, etc. )
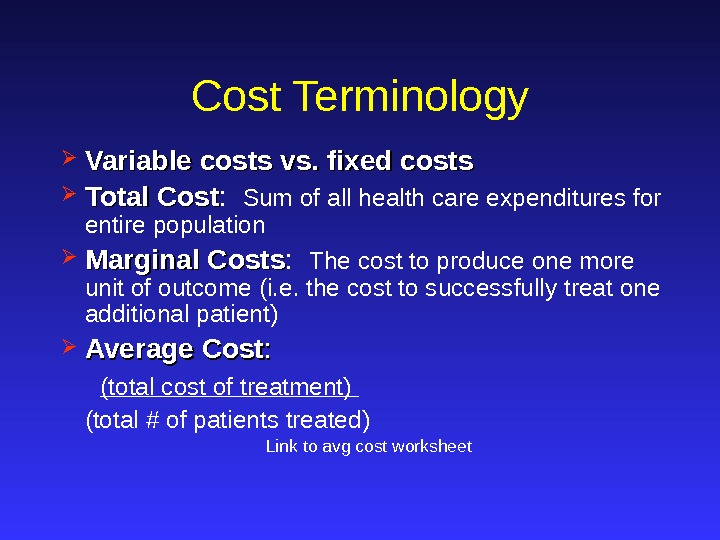
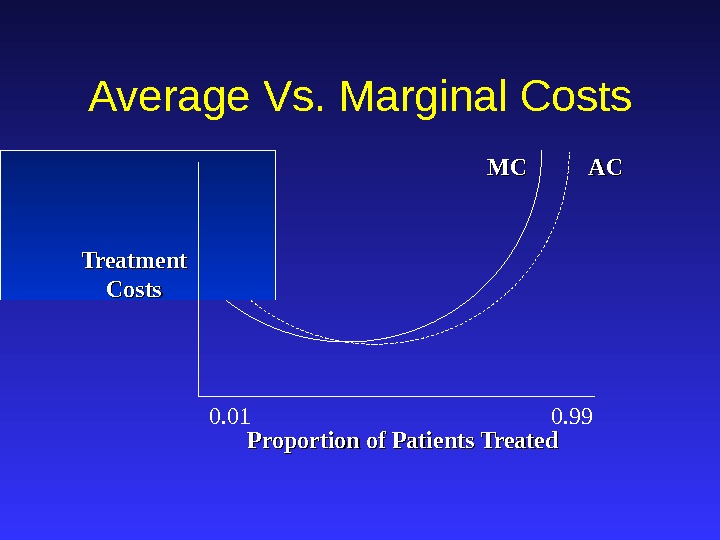
Cost Terminology Variable costs vs. fixed costs Total Cost : Sum of all health care expenditures for entire population Marginal Costs : The cost to produce one more unit of outcome (i. e. the cost to successfully treat one additional patient) Average Cost : : (total cost of treatment) (total # of patients treated) Link to avg cost worksheet
ACAC MCMC Treatment Costs. Average Vs. Marginal Costs Proportion of Patients Treated 0. 01 0.
Specifying the Inputs Develop comprehensive list of ALL relevant inputs (i. e. resources consumed) to produce a given output or consequence The list will be determined by the perspective of the analysis Common to all forms of economic evaluation
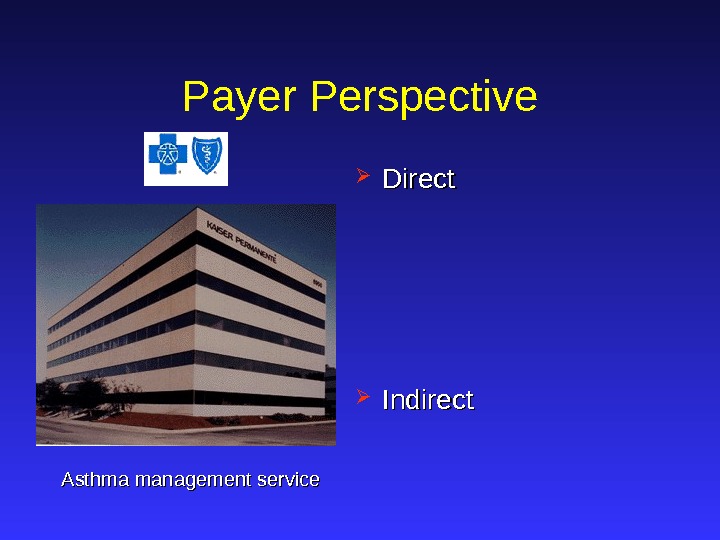
Payer Perspective Direct Indirect Asthma management service
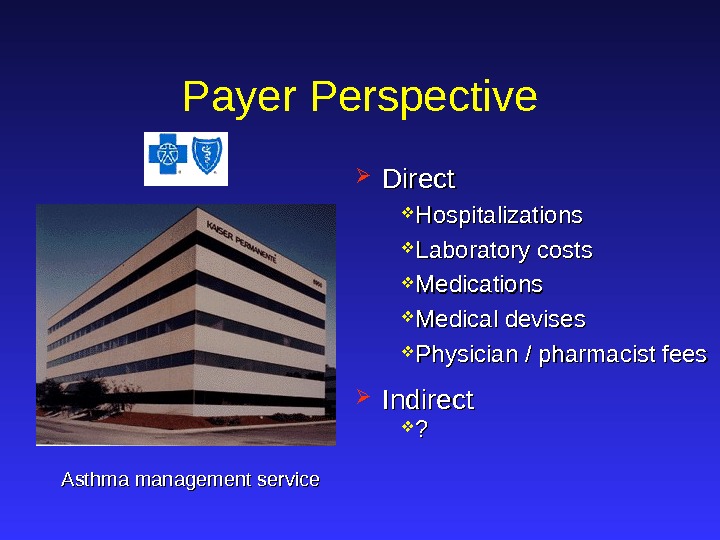
Hospitalizations Laboratory costs Medications Medical devises Physician / pharmacist fees. Payer Perspective Direct Indirect Asthma management service ? ?
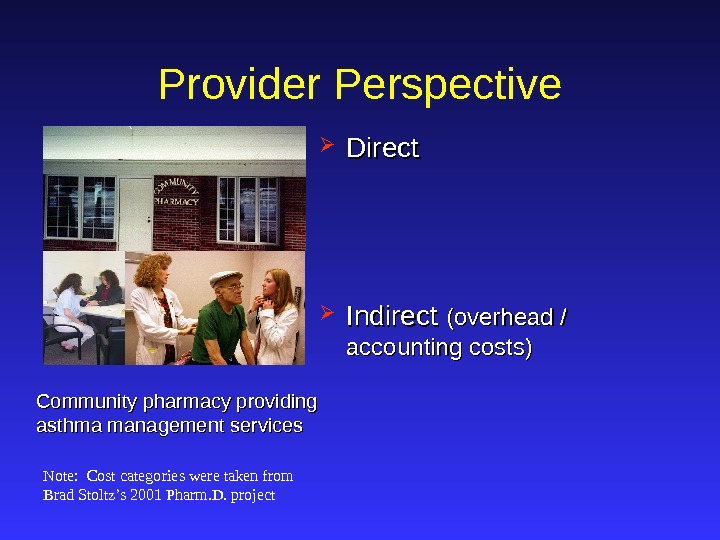
Direct Indirect (overhead / accounting costs)Provider Perspective Community pharmacy providing asthma management services Note: Cost categories were taken from Brad Stoltz’s 2001 Pharm. D. project
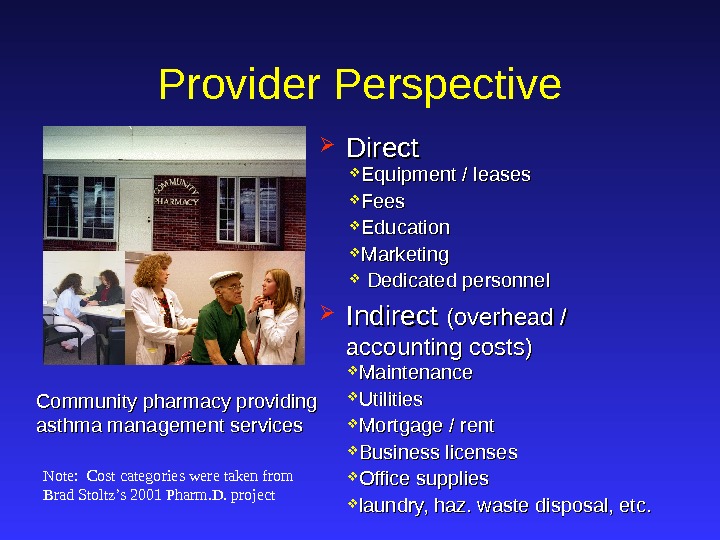
Direct Indirect (overhead / accounting costs) Maintenance Utilities Mortgage / rent Business licenses Office supplies laundry, haz. waste disposal, etc. Equipment / leases Fees Education Marketing Dedicated personnel. Provider Perspective Community pharmacy providing asthma management services Note: Cost categories were taken from Brad Stoltz’s 2001 Pharm. D. project
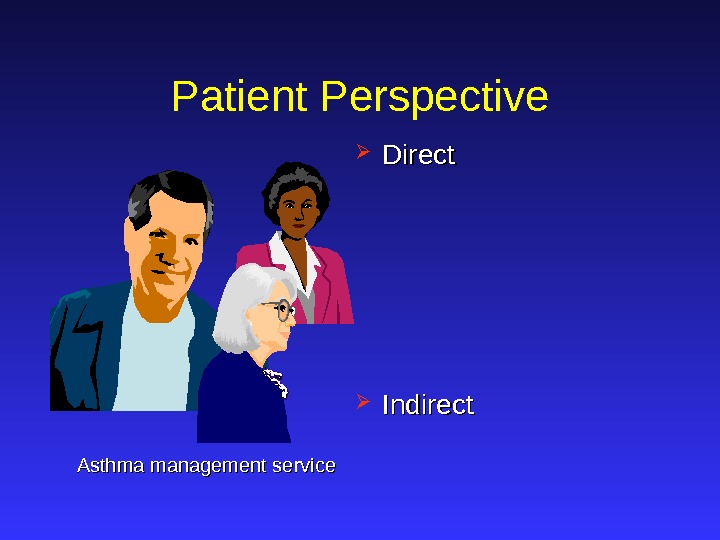
Patient Perspective Direct Indirect Asthma management service
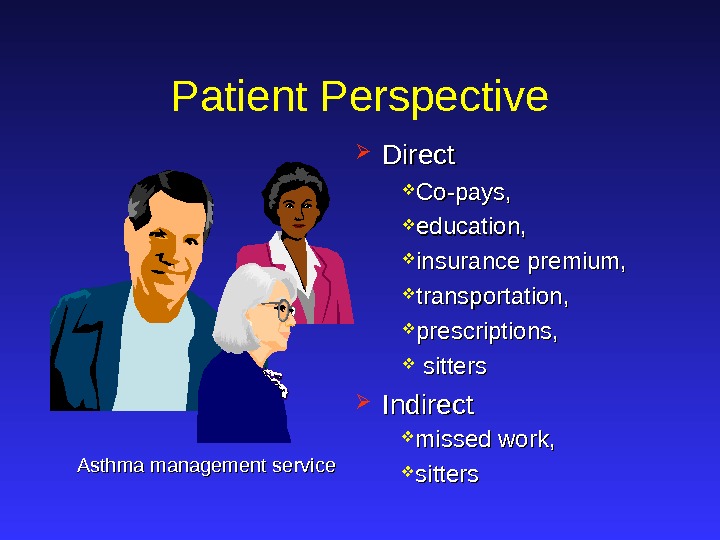
Co-pays, education, insurance premium, transportation, prescriptions, sitters missed work, sitters. Patient Perspective Direct Indirect Asthma management service
Societal Perspective Direct Indirect Asthma management service
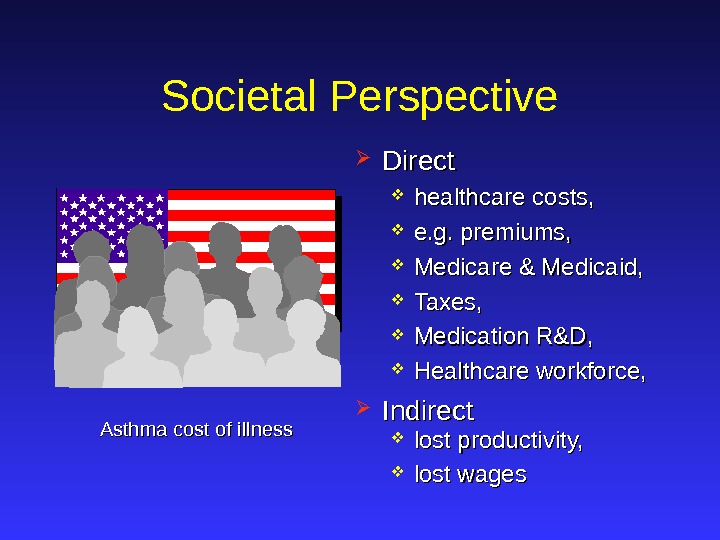
healthcare costs, e. g. premiums, Medicare & Medicaid, Taxes, Medication R&D, Healthcare workforce, lost productivity, lost wages. Societal Perspective Direct Indirect Asthma cost of illness
Counting Units Determine the unit of use for a given resource (e. g. , hospital day, single lab test, 30 -day supply of medication) Determine how many units will be consumed over the study period
Assigning Dollar Values Opportunity costs Vs. market price Personnel time / costs Medication costs Physician and other services Hospital / emergency department costs Based upon cost accounting system
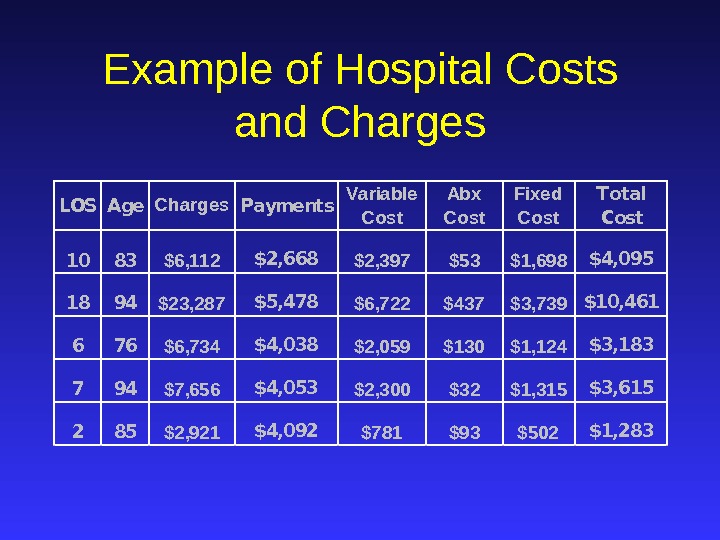
Example of Hospital Costs and Charges. LOSAge. Charges. Payments Variable Cost Abx Cost Fixed Cost Total Cost 1083$6, 112$2, 668$2, 397$53$1, 698$4, 095 1894$23, 287$5, 478$6, 722$437$3, 739$10, 461 676$6, 734$4, 038$2, 059$130$1, 124$3, 183 794$7, 656$4, 053$2, 300$32$1, 315$3, 615 285$2, 921$4, 092$781$93$502$1,
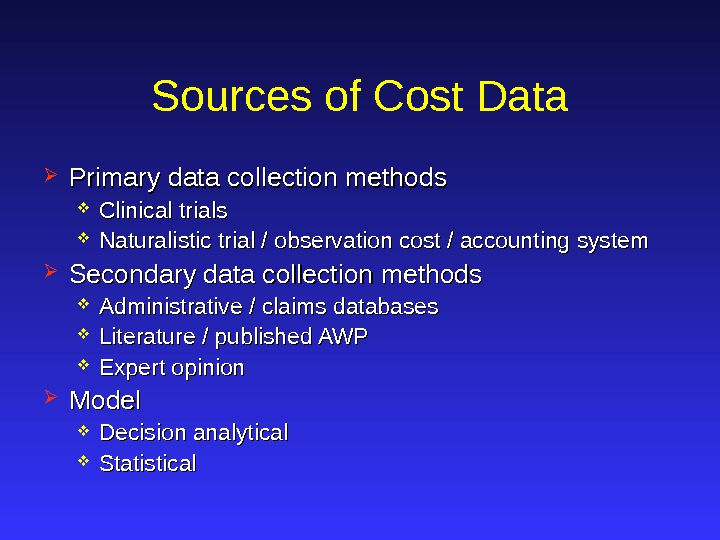
Sources of Cost Data Primary data collection methods Clinical trials Naturalistic trial / observation cost / accounting system Secondary data collection methods Administrative / claims databases Literature / published AWP Expert opinion Model Decision analytical Statistical
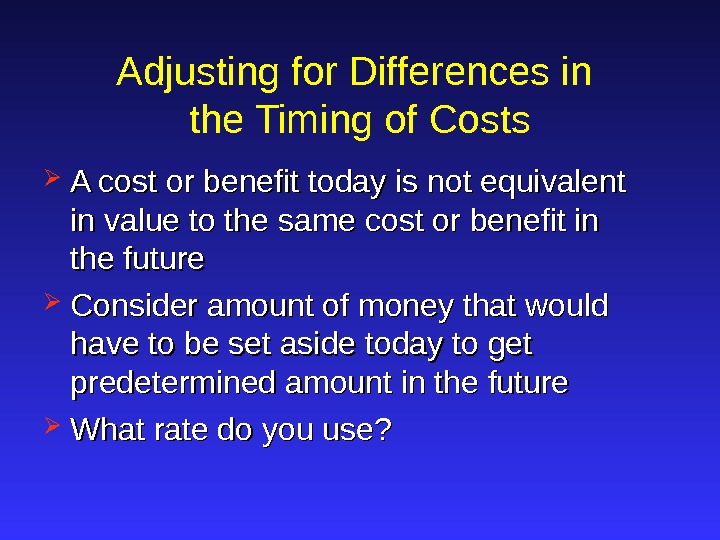
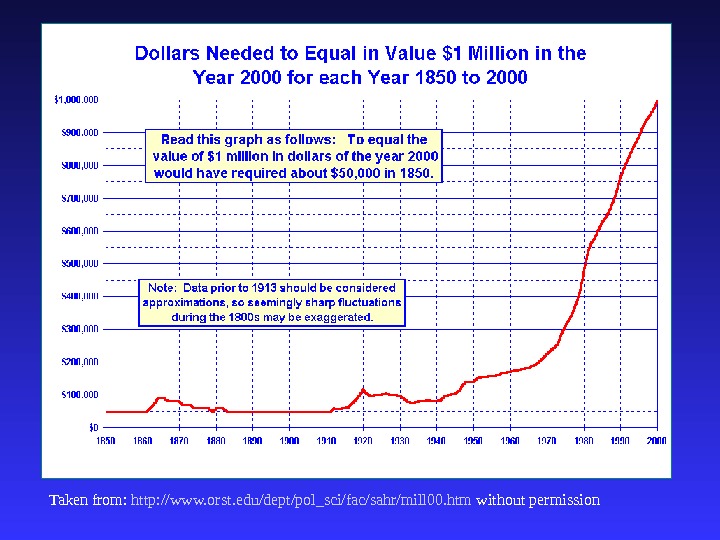
Adjusting for Differences in the Timing of Costs A cost or benefit today is not equivalent in value to the same cost or benefit in the future Consider amount of money that would have to be set aside today to get predetermined amount in the future What rate do you use?
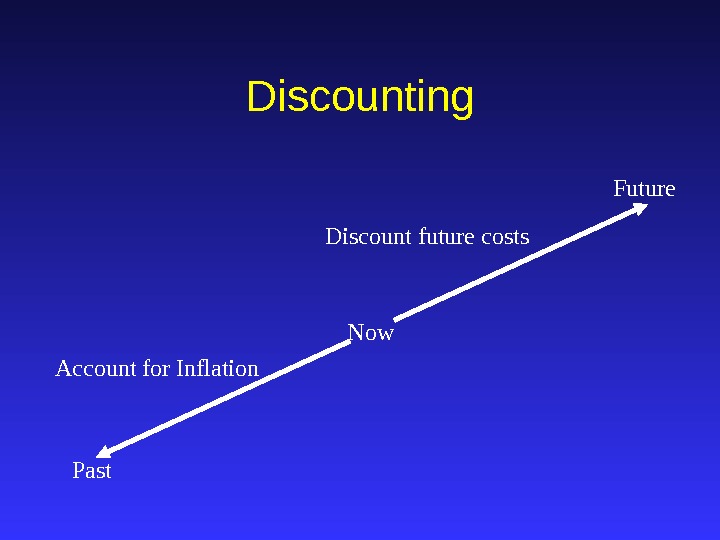
Discounting Now Past Future Account for Inflation Discount future costs
Taken from: http: //www. orst. edu/dept/pol_sci/fac/sahr/mill 00. htm without permission
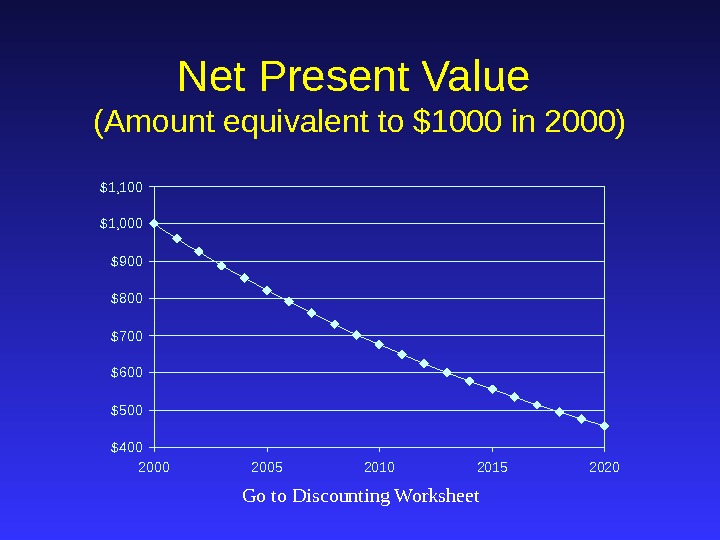
Net Present Value (Amount equivalent to $1000 in 2000) $400$500$600$700$800$900$1, 000$1, 100 2005 2010 2015 2020 Go to Discounting Worksheet
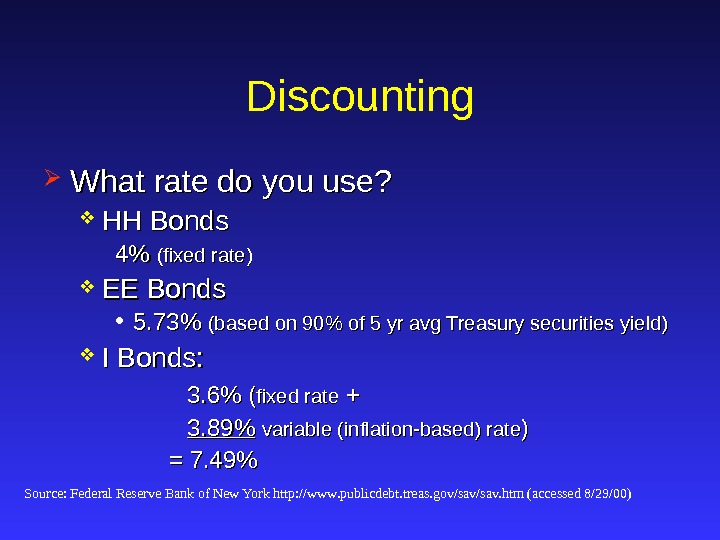
Discounting What rate do you use? HH Bonds 4% 4% (fixed rate) EE Bonds • 5. 73% (based on 90% of 5 yr avg Treasury securities yield) I Bonds: 3. 6% ( fixed rate + + 3. 89% variable (inflation-based) rate )) = 7. 49% Source: Federal Reserve Bank of New York http: //www. publicdebt. treas. gov/sav. htm (accessed 8/29/00)
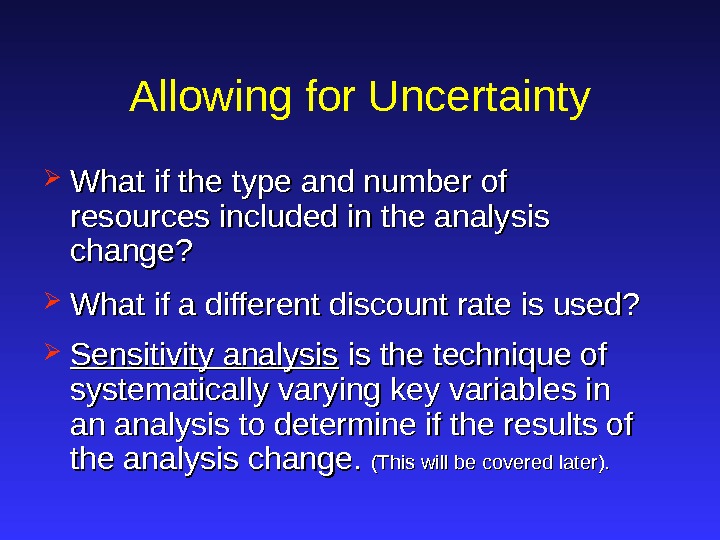
Allowing for Uncertainty What if the type and number of resources included in the analysis change? What if a different discount rate is used? Sensitivity analysis is the technique of systematically varying key variables in an analysis to determine if the results of the analysis change. (This will be covered later).
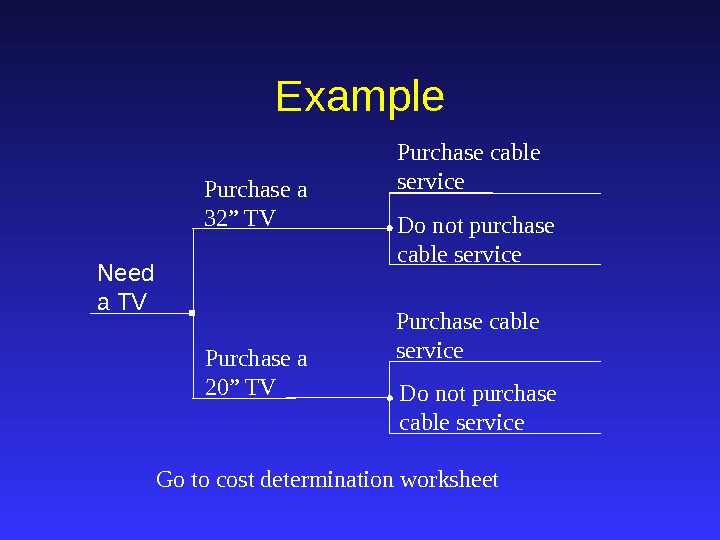
Purchase cable service Do not purchase cable service. Example Need a TV Purchase a 32” TV Purchase a 20” TV Purchase cable service Do not purchase cable service Go to cost determination worksheet
Questions