

b3df372d77b12be49c09e0e271e8b87a.ppt
- Количество слайдов: 70


 Price QD $30 0 25 2 20 3 15 3 10 4 5 5
 Price QD $30 1 25 1 20 2 15 3 10 5 5 6
 Price QD $30 2 25 3 20 5 15 6 10 7 5 7
 Price QD $30 1 25 3 20 4 15 6 10 7 5 8
 Price $30 Venus 0 Martina 1 Serena 2 Lindsay 1 Total 4
 Price $30 $25 Venus 0 2 Martina 1 1 Serena 2 3 Lindsay 1 3 Total 4 9
 Price $30 $25 $20 Venus 0 2 3 Martina 1 1 2 Serena 2 3 5 Lindsay 1 3 4 Total 4 9 14
 Price $30 $25 $20 $15 Venus 0 2 3 3 Martina 1 1 2 3 Serena 2 3 5 6 Lindsay 1 3 4 6 Total 4 9 14 18

 $30 4 $25 9 $20 14 $15 18 $10 23 $ 5") Price QD(1) $30 4 $25 9 $20 14 $15 18 $10 23 $ 5 26 QD(2) 5 11 18 28 38 50
Price QD(1) $30 4 $25 9 $20 14 $15 18 $10 23 $ 5 26 QD(2) 5 11 18 28 38 50
 $30 4 $25 9 $20 14 $15 18 $10 23 $ 5") Price QD(1) $30 4 $25 9 $20 14 $15 18 $10 23 $ 5 26 QD(2) 5 11 18 28 38 50
Price QD(1) $30 4 $25 9 $20 14 $15 18 $10 23 $ 5 26 QD(2) 5 11 18 28 38 50
 $30 4 $25 9 $20 14 $15 18 $10 23 $ 5") Price QD(1) $30 4 $25 9 $20 14 $15 18 $10 23 $ 5 26 QD(2) 5 11 18 28 38 50
Price QD(1) $30 4 $25 9 $20 14 $15 18 $10 23 $ 5 26 QD(2) 5 11 18 28 38 50


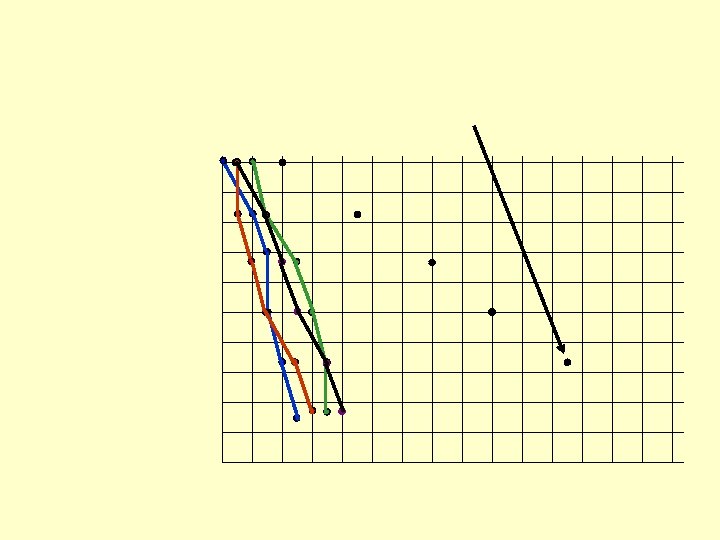
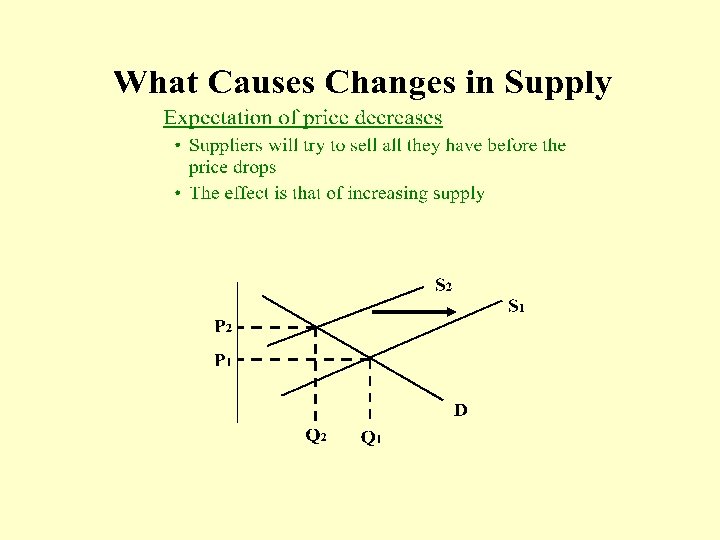
 A change in quantity supplied
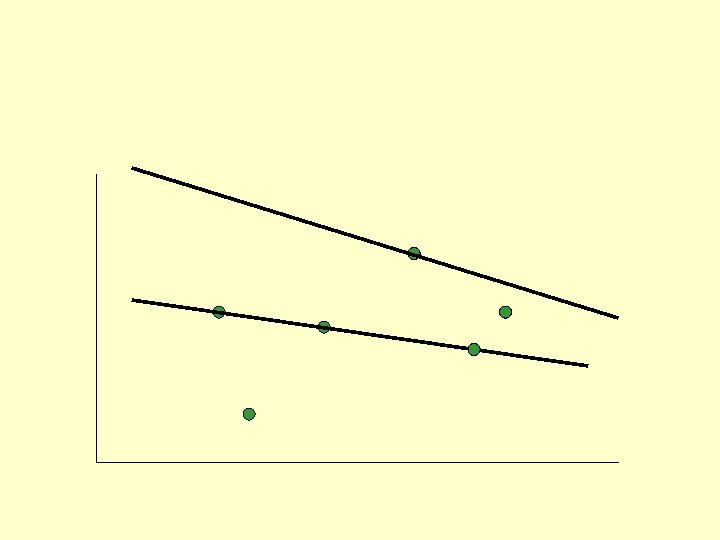
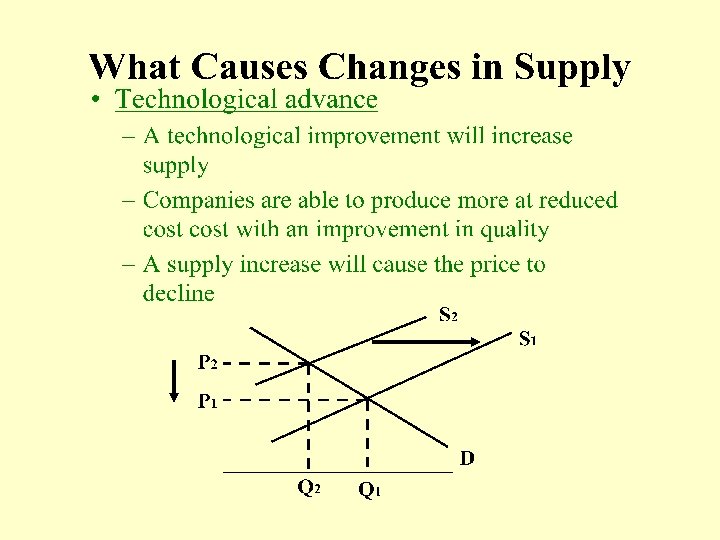
 An increase in supply
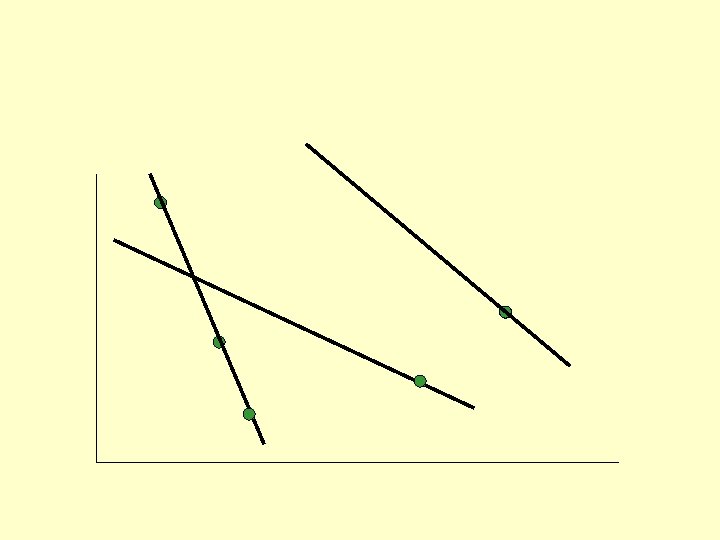
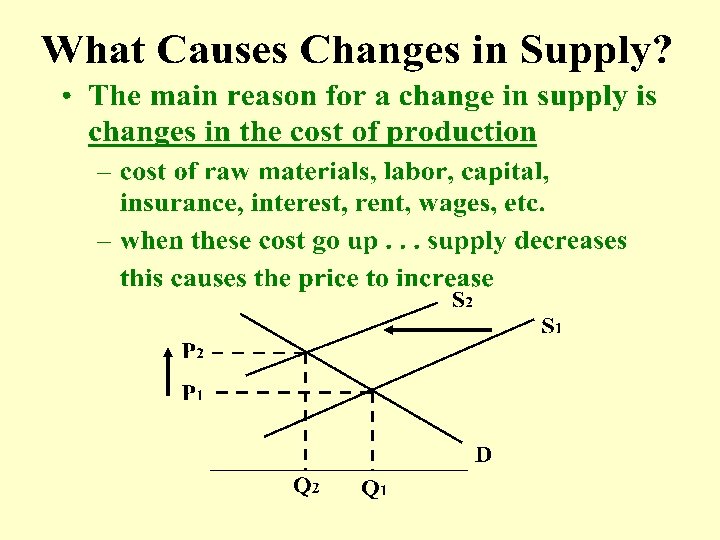
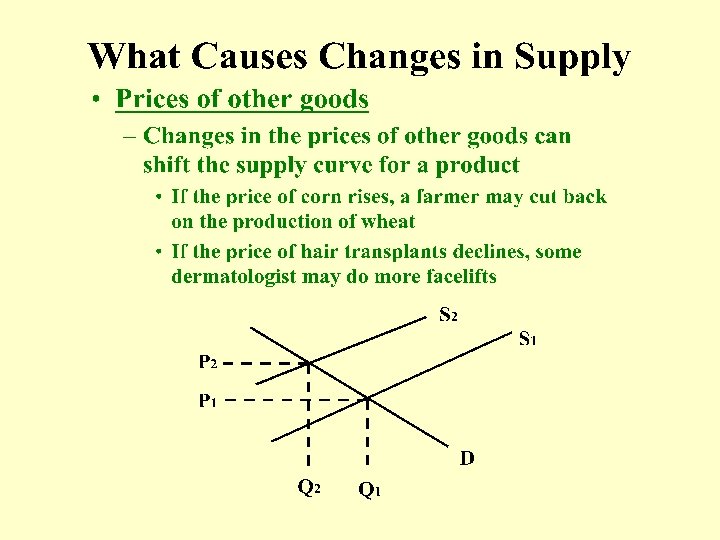
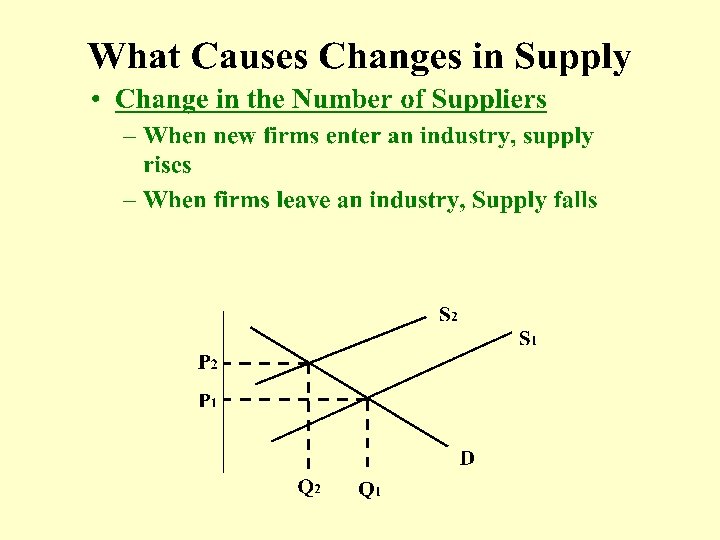
 A change in supply
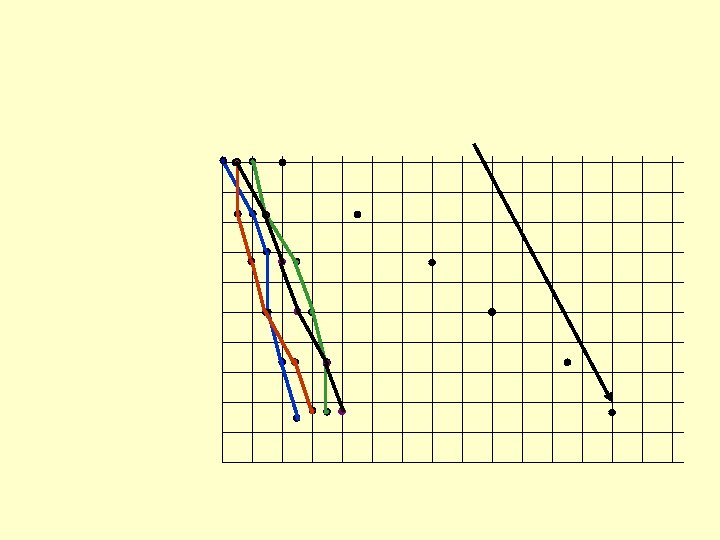
 A change in quantity supplied
 An increase in supply
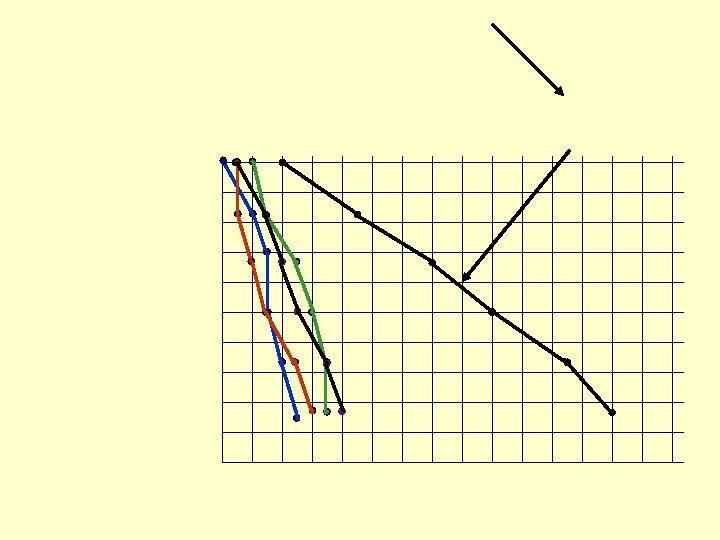
 A change in quantity supplied
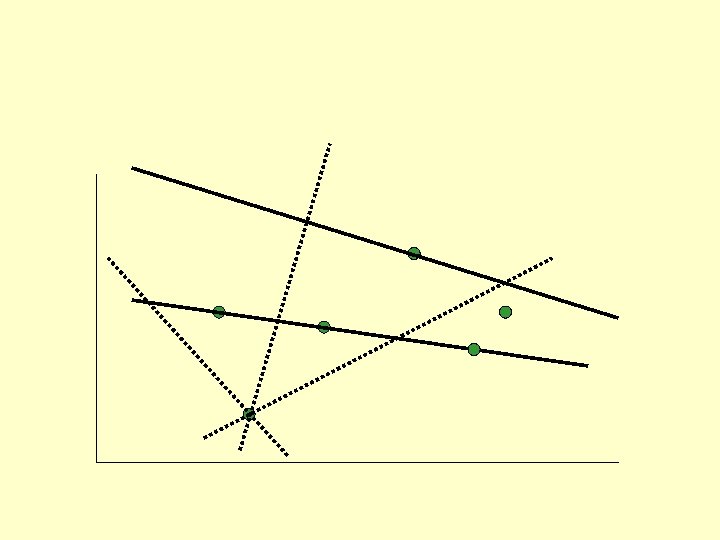
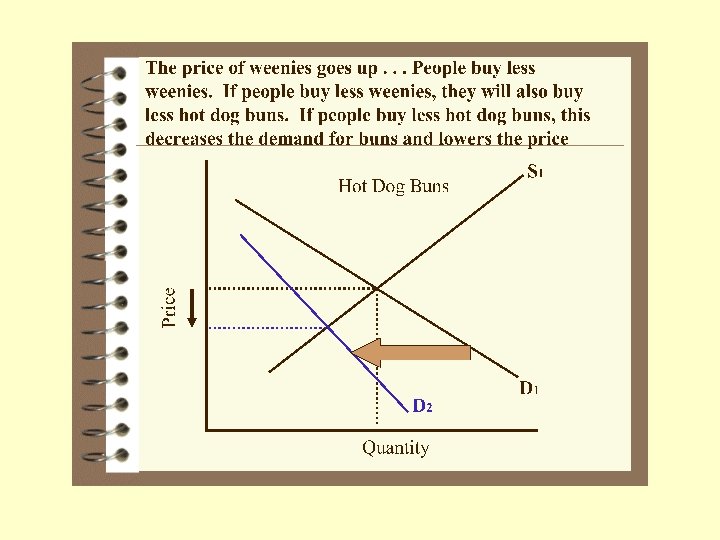
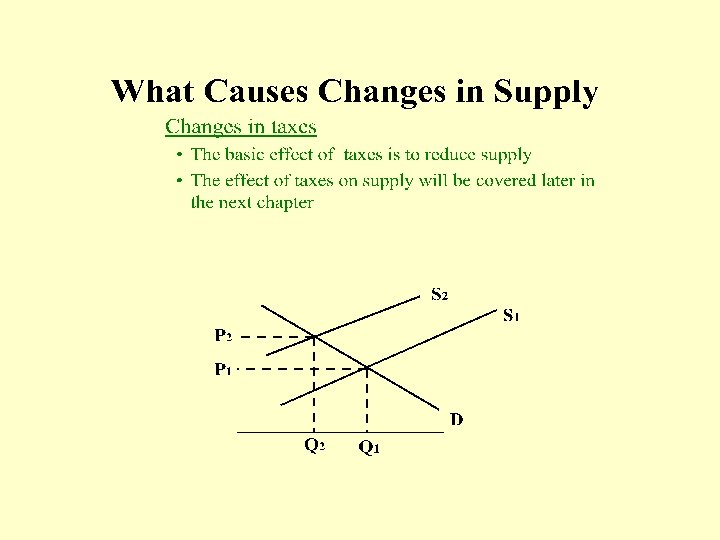
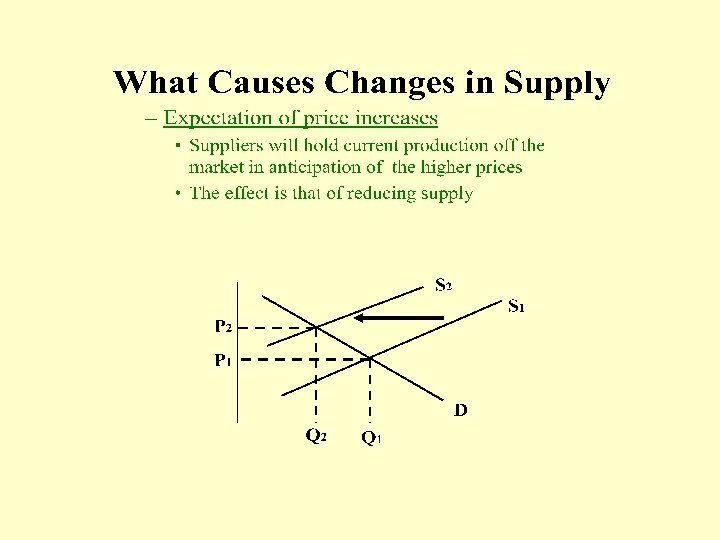
 A decrease in supply
 A change in supply
 $10 1 $ 9 2 $ 8 4") Hypothetical Demand Schedule Price Quantity Demanded(QD) $10 1 $ 9 2 $ 8 4 $ 7 7 $ 6 12
Hypothetical Demand Schedule Price Quantity Demanded(QD) $10 1 $ 9 2 $ 8 4 $ 7 7 $ 6 12
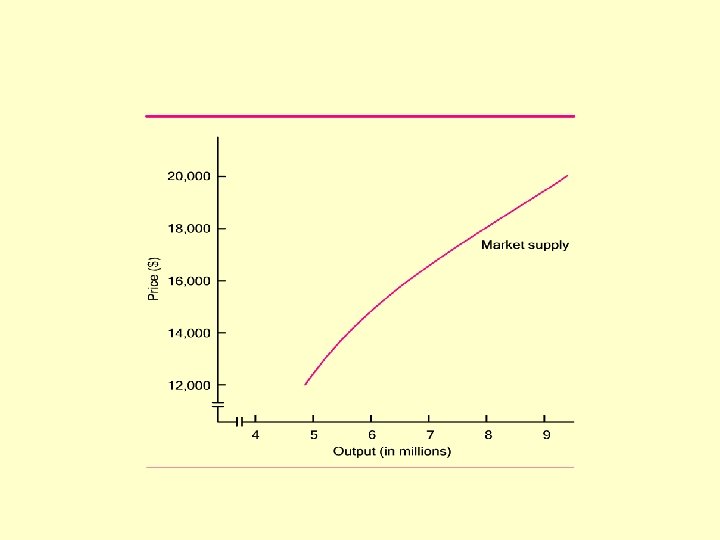
 $10 14 $ 9 12 $ 8") Hypothetical Supply Schedule Price Quantity Supplied (QS) $10 14 $ 9 12 $ 8 9 $ 7 5 $ 6 1
Hypothetical Supply Schedule Price Quantity Supplied (QS) $10 14 $ 9 12 $ 8 9 $ 7 5 $ 6 1
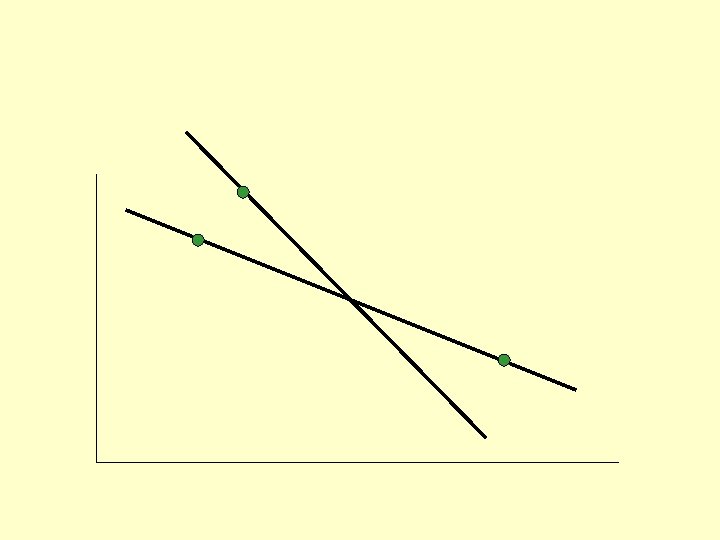
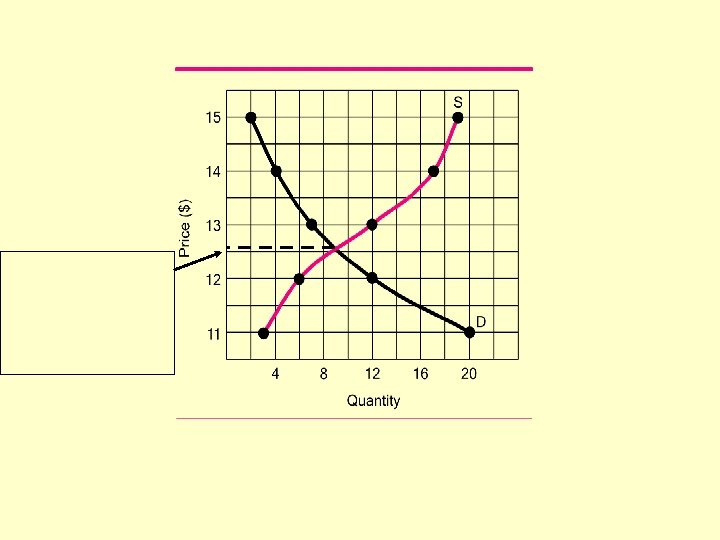
 Hypothetical Demand Supply Schedules Price QD QS $10 1 14 $ 9 2 12 $ 8 4 9 $ 7 7 5 $ 6 12 1 The equilibrium point is where the demand supply curves cross
 Hypothetical Demand Supply Schedules Price QD QS $10 1 14 $ 9 2 12 $ 8 4 9 $ 7 7 5 $ 6 12 1 Equilibrium price is about $7. 20 Equilibrium quantity is 6
 Above equilibrium price there are surpluses Price always tends toward equilibrium. If price is above equilibrium, sellers will lower prices until the price declines to the equilibrium price Price
 Below equilibrium price there are shortages Price always tends toward equilibrium. If price is below equilibrium, buyers will bid prices up until the price rises to the equilibrium price Price


 Equilibrium quantity demanded is closer to 7 than 12. The midpoint between 12 and 7 is 9. 5. Therefore, we know the equilibrium quantity demanded must be something less than 9. 5 Equilibrium quantity supplied is closer to 12 than 6. The midpoint between 12 and 6 is 9. Therefore, we know the equilibrium quantity supplied is something more than 9. 0 The equilibrium quantity has to be between 9. 0 and 9. 5. Anything between 9. 1 and 9. 4 would be acceptable. I would split the difference and say 9. 2 or 9. 3
 Remember, the equilibrium quantity has to be between 9. 0 and 9. 5. Anything between 9. 1 and 9. 4 would be acceptable. I would split the difference and say 9. 2 or 9. 3 In this instance, this technique proved useful.
