
Презентация world energy market 2 final


- Размер: 1.2 Mегабайта
- Количество слайдов: 27
Описание презентации Презентация world energy market 2 final по слайдам
World Energy Market Optional Discipline Valentin K. Pospelov Financial University under the Russian Government Moscow
Subject 2 World Energy Market Situation Main Points : 1. Definition of World Energy Market. 2. Volume, Structure, Growth and Development Trends. 3. Current State of Energy Markets.
Subject 2 World Energy Market Situation Main Points : 1. Definition of World Energy Market.
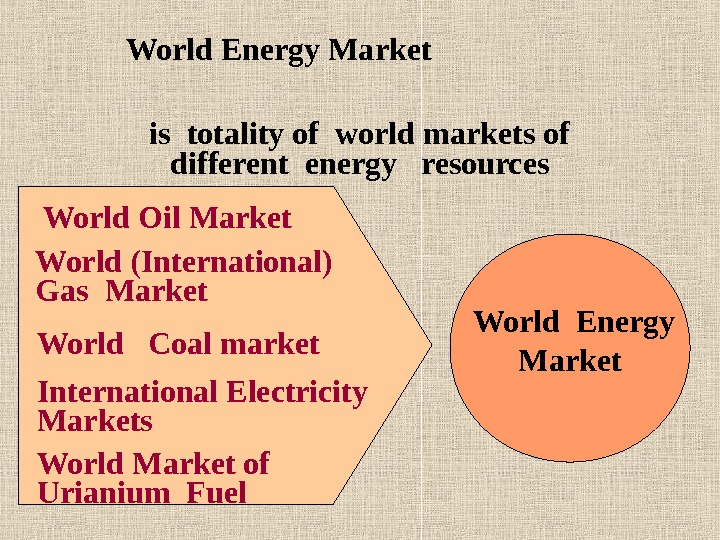
is totality of world markets of different energy resources. World Energy Market World Oil Market World ( International) Gas Market World Coal market International Electricity Markets World Market of Urianium Fuel World Energy Market
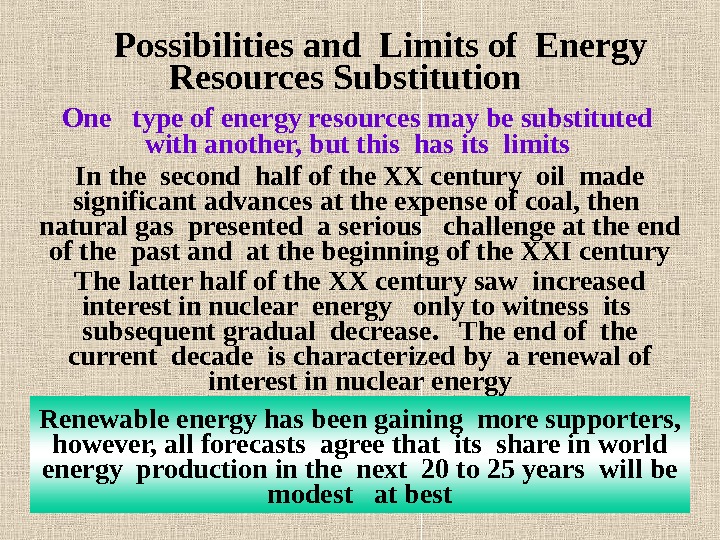
Possibilities and Limits of Energy Resources Substitution One type of energy resources may be substituted with another, but this has its limits In the second half of the XX century oil made significant advances at the expense of coal, then natural gas presented a serious challenge at the end of the past and at the beginning of the XXI century The latter half of the XX century saw increased interest in nuclear energy only to witness its subsequent gradual decrease. The end of the current decade is characterized by a renewal of interest in nuclear energy Renewable energy has been gaining more supporters, however, all forecasts agree that its share in world energy production in the next 20 to 25 years will be modest at best
Subject 2 World Energy Market Situation Main Points : 2. Volume, Structure, Growth and Development Trends.
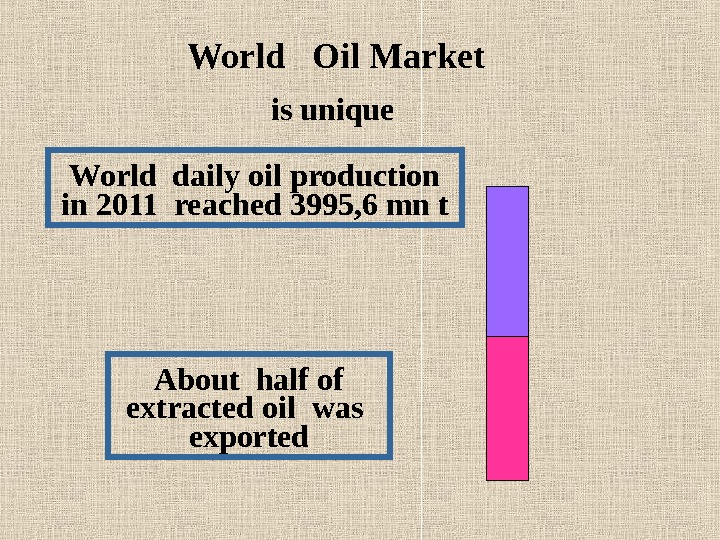
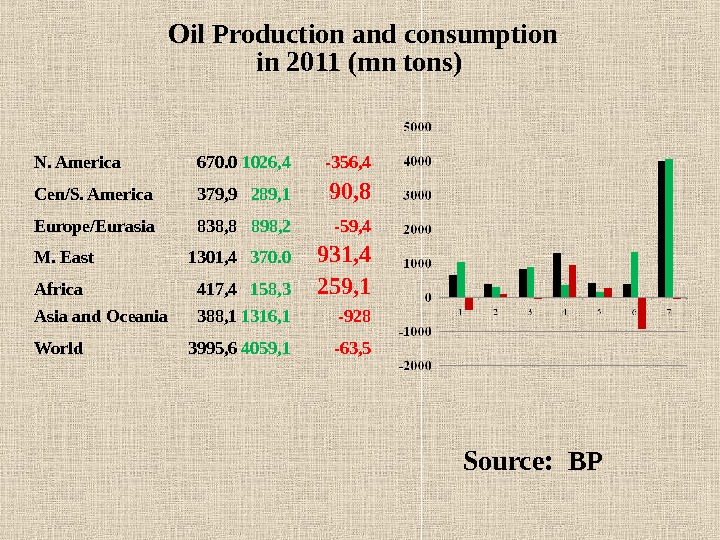
World Oil Market is unique World daily oil production in 2011 reached 3995, 6 mn t About half of extracted oil was exported
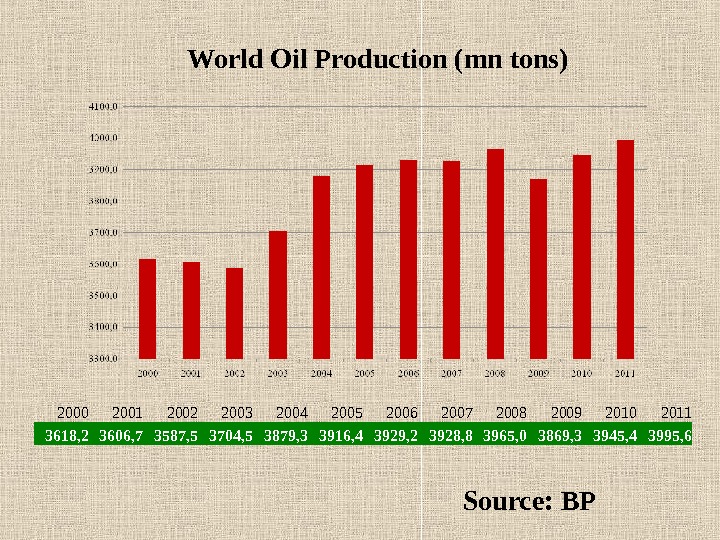
World Oil Production ( mn tons ) Source: BP 2000 2001 2002 2003 2004 2005 2006 2007 2008 2009 2010 2011 3618, 2 3606, 7 3587, 5 3704, 5 3879, 3 3916, 4 3929, 2 3928, 8 3965, 0 3869, 3 3945, 4 3995,
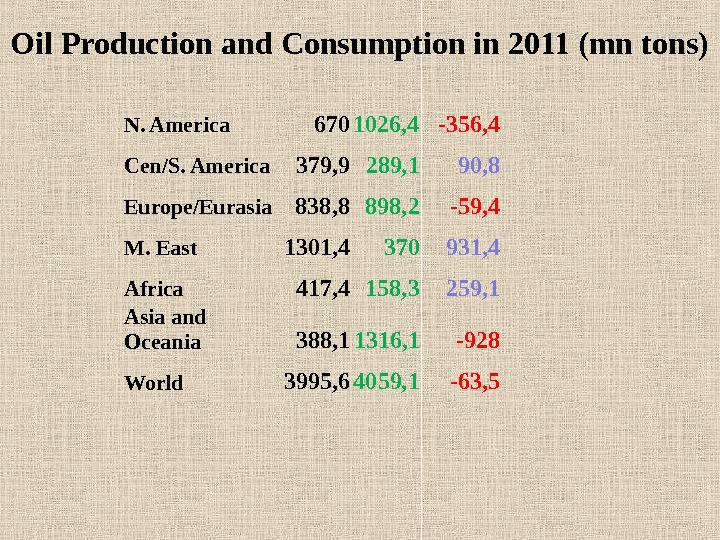
Oil Production and Consumption in 2011 (mn tons) N. America 670 1026, 4 -356, 4 Cen/S. America 379, 9 289, 1 90, 8 Europe/Eurasia 838, 8 898, 2 -59, 4 M. East 1301, 4 370 931, 4 Africa 417, 4 158, 3 259, 1 Asia and Oceania 388, 1 1316, 1 -928 World 3995, 6 4059, 1 -63,
N. America 670. 0 1026, 4 -356, 4 Cen/S. America 379, 9 289, 1 90, 8 Europe/Eurasia 838, 8 898, 2 -59, 4 M. East 1301, 4 370. 0 931, 4 Africa 417, 4 158, 3 259, 1 Asia and Oceania 388, 1 1316, 1 -928 World 3995, 6 4059, 1 -63, 5 Oil Production and consumption in 2011 (mn tons) Source: BP
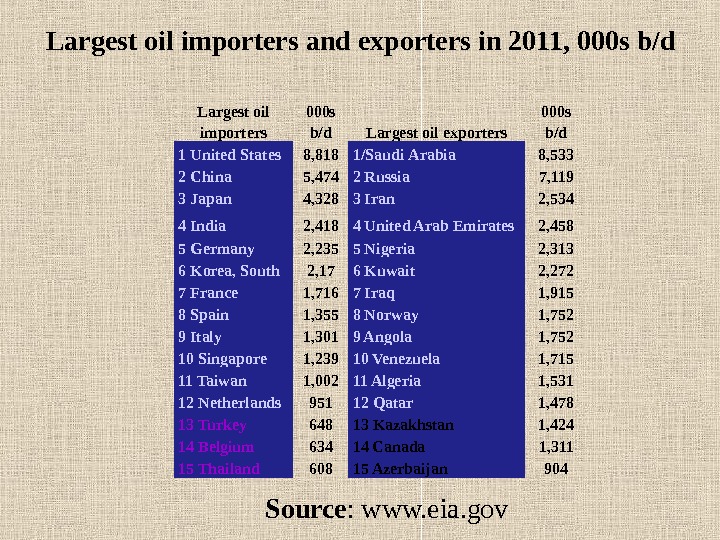
Largest oil importers and exporters in 2011, 000 s b/d Source : www. eia. gov. Largest oil importers 000 s b/d Largest oil exporters 000 s b/d 1 United States 8, 818 1/ Saudi Arabia 8, 533 2 China 5, 474 2 Russia 7, 119 3 Japan 4, 328 3 Iran 2, 534 4 India 2, 418 4 United Arab Emirates 2, 458 5 Germany 2, 235 5 Nigeria 2, 313 6 Korea, South 2, 17 6 Kuwait 2, 272 7 France 1, 716 7 Iraq 1, 915 8 Spain 1, 355 8 Norway 1, 752 9 Italy 1, 301 9 Angola 1, 752 10 Singapore 1, 239 10 Venezuela 1, 715 11 Taiwan 1, 002 11 Algeria 1, 531 12 Netherlands 951 12 Qatar 1, 478 13 Turkey 648 13 Kazakhstan 1, 424 14 Belgium 634 14 Canada 1, 311 15 Thailand 608 15 Azerbaijan
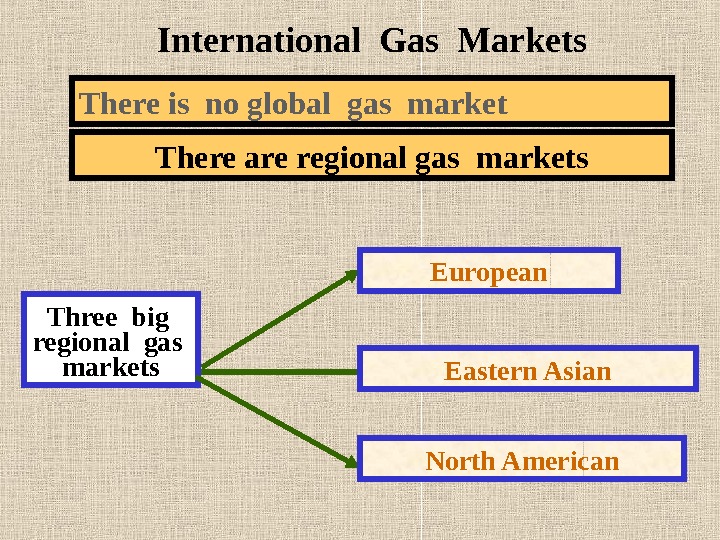
International Gas Markets There is no global gas market There are regional gas markets Three big regional gas markets European Eastern Asian North American
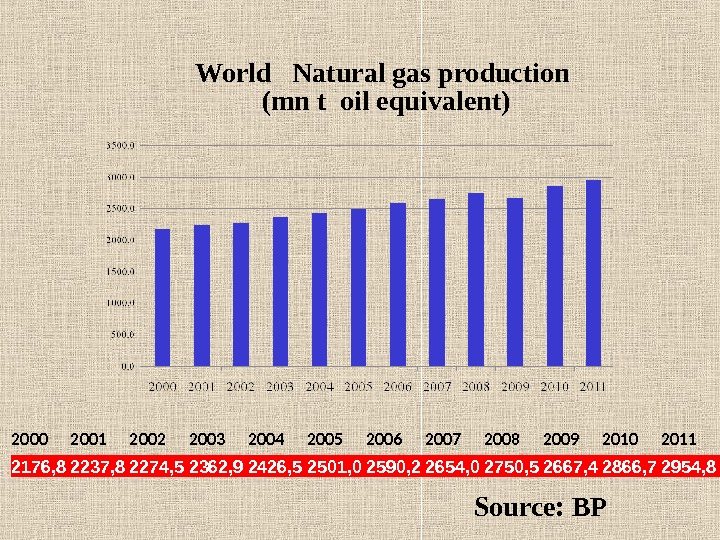
World Natural gas production (mn t oil equivalent) 2176, 8 2237, 8 2274, 5 2362, 9 2426, 5 2501, 0 2590, 2 2654, 0 2750, 5 2667, 4 2866, 7 2954, 8 Source: BP
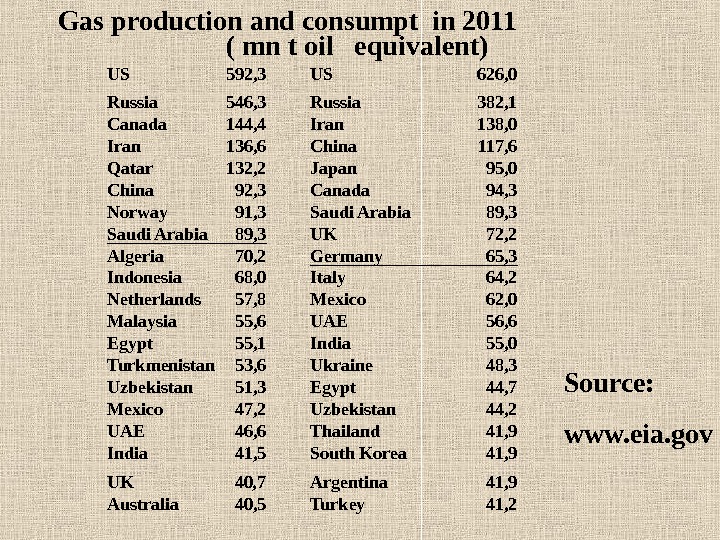
Gas production and consumpt in 2011 ( mn t oil equivalent) Source: www. eia. gov. US 592, 3 US 626, 0 Russia 546, 3 Russia 382, 1 Canada 144, 4 Iran 138, 0 Iran 136, 6 China 117, 6 Qatar 132, 2 Japan 95, 0 China 92, 3 Canada 94, 3 Norway 91, 3 Saudi Arabia 89, 3 UK 72, 2 Algeria 70, 2 Germany 65, 3 Indonesia 68, 0 Italy 64, 2 Netherlands 57, 8 Mexico 62, 0 Malaysia 55, 6 UAE 56, 6 Egypt 55, 1 India 55, 0 Turkmenistan 53, 6 Ukraine 48, 3 Uzbekistan 51, 3 Egypt 44, 7 Mexico 47, 2 Uzbekistan 44, 2 UAE 46, 6 Thailand 41, 9 India 41, 5 South Korea 41, 9 UK 40, 7 Argentina 41, 9 Australia 40, 5 Turkey 41,
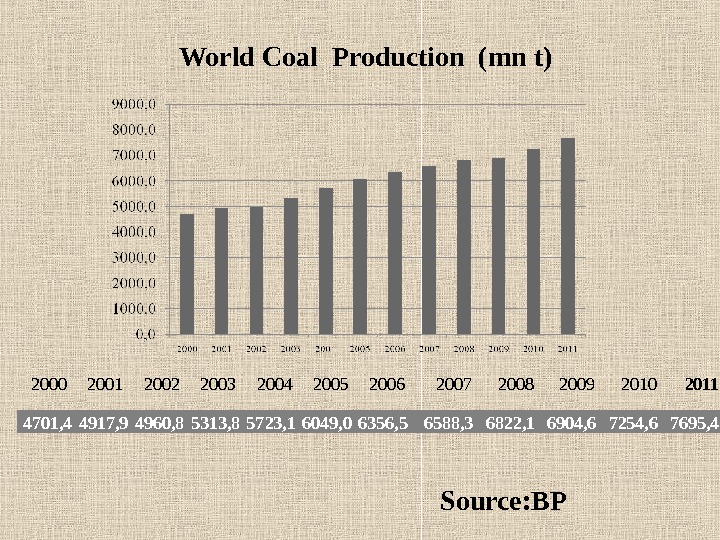
World Coal Production (mn t) 4701, 4 4917, 9 4960, 8 5313, 8 5723, 1 6049, 0 6356, 5 6588, 3 6822, 1 6904, 6 7254, 6 7695, 42000 2001 2002 2003 2004 2005 2006 2007 2008 2009 2010 2011 Source: BP
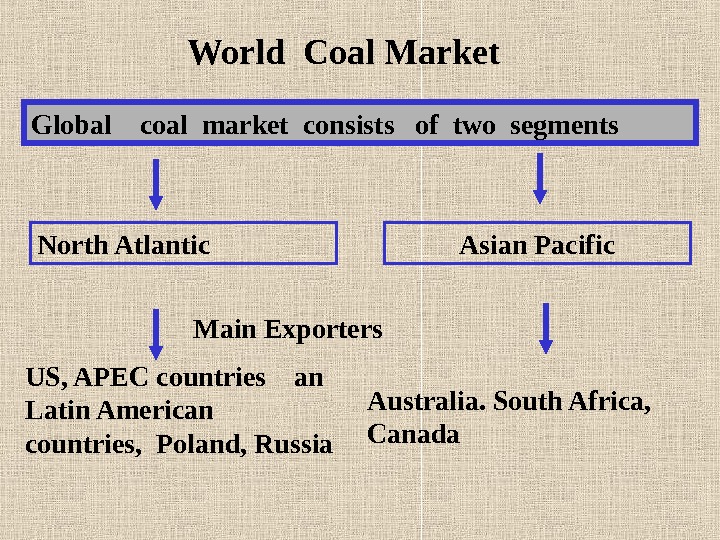
World Coal Market Global coal market consists of two segments North Atlantic Asian Pacific Main Exporters US, APEC countries an Latin American countries , Poland, Russia Australia. South Africa, Canada
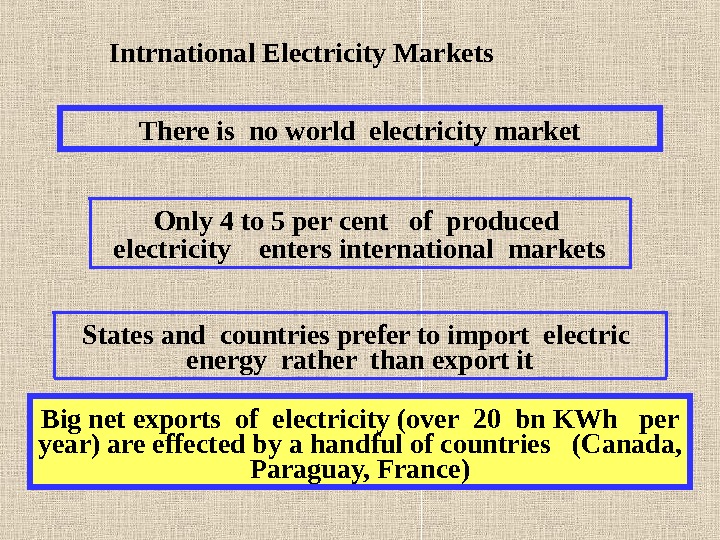
Intrnational Electricity Markets There is no world electricity market Only 4 to 5 per cent of produced electricity enters international markets States and countries prefer to import electric energy rather than export it Big net exports of electricity (over 20 bn KWh per year) are effected by a handful of countries ( Canada, Paraguay, France)
Subject 2 World Energy Market Situation Main Points : 3. Current State of Energy Markets.
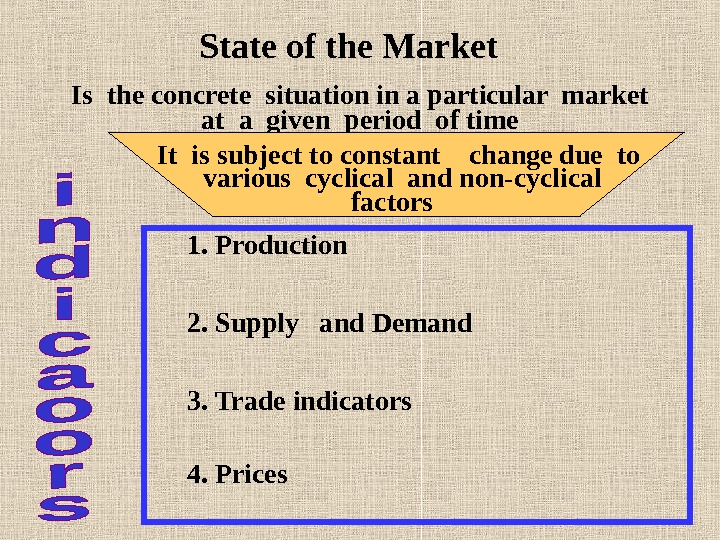
State of the Market Is the concrete situation in a particular market at a given period of time 1. Production 2. Supply and Demand 3. Trade indicators 4. Prices. It is subject to constant change due to various cyclical and non-cyclical factors
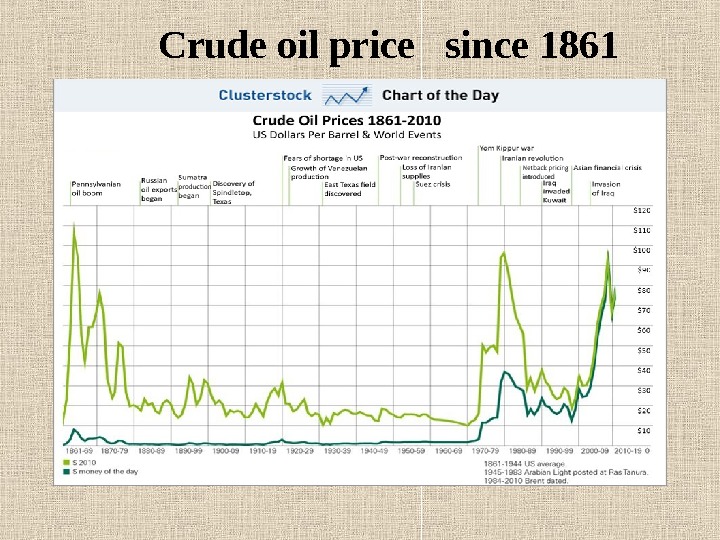
Crude oil price since
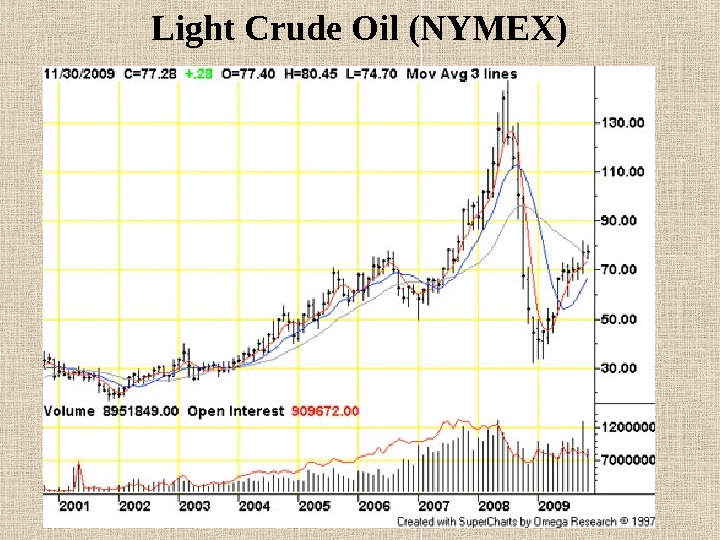
Light Crude Oil (CL, NYMEX) Monthly Price Chart ]
Light Crude Oil (NYMEX)
How oil trade is organised Oil and oil products are mainly trade on oil exchanges
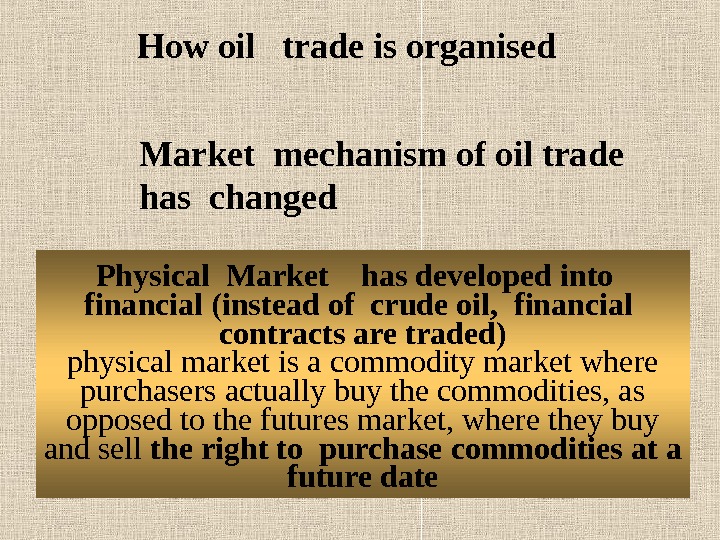
Physical Market has developed into financial (instead of crude oil, financial contracts are traded) physical market is a commodity market where purchasers actually buy the commodities, as opposed to the futures market, where they buy and sell the right to purchase commodities at a future date. How oil trade is organised Market mechanism of oil trade has changed
Crude oil is one of the world’s most widely-used commodities and one of the most actively traded commodities worldwide A key geo-political benchmark, the price of oil is among the most quoted statistics in business headlines today That’s why hedgers, traders and risk managers around the world rely on the ICE Brent, ICE WTI, ICE ASCI and ICE Gasoil futures markets https: //www. theice. com/crud e. jhtml
Home Assignment Find data on the Web relating to the oil price developments in 2010 -2013 and make a graph
Thank you for attention!