
Презентация summerschool practical


- Размер: 19.6 Mегабайта
- Количество слайдов: 205
Описание презентации Презентация summerschool practical по слайдам
Interdisciplinary Summerschool Network Analysis of European Urban Landscapes St Petersburg, Russia July, 1 -6, 2015 Beate Volker University of Amsterdam
Who am I? Study of Social; Theoretical and Empirical Psychology, Heidelberg Ph. D Utrecht University/ICS (1995): Should auld Acquaintances be forgot? – Personal Networks before and after the political turn in the former GDR 1996/1997: Chair Empirical Sociology, Aken/Germany 1998 -2006: Postdoc/KNAW fellow UU, later associate professor Vidi project 2007: Chair: Sociological determinants of pro-social behaviour (UU) 2012: Chair: Sociology of Social Capital (UU) 2015: Chair: Sociology, Social Inequality and labor market (Uv. A)
Research interests/ ongoing projects • Influences of contextual (institutional, neighborhood etc) conditions on creation of networks, social capital and community • Failure of community: social cleavages, limits of functioning • Consequences of community: health, Peerby • three papers I work on at this moment: • Contextualizing ‘broken windows’ • Changes of resources and networks through one’s life • Peerby: online networks and exchanges in neighhborhods
Two questions: 1) From time to time we discuss personal matters with other people. How many people do you have in your personal network, who are important for this? – With whom did you discuss personal matters during the last 6 months? 2) Estimate the size of your total network. That is, all people who you know and who know you.
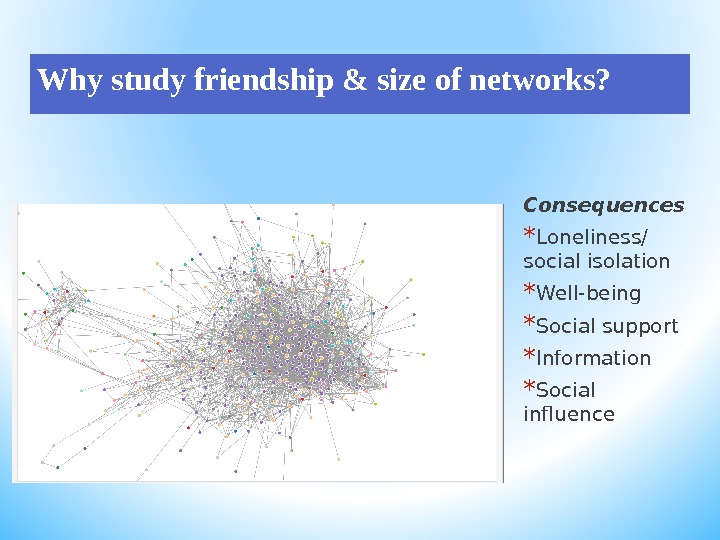
Why study friendship & size of networks? Consequences * Loneliness/ social isolation * Well-being * Social support * Information * Social influence
“ To speak of social life is to speak of the association between people – their associating in work and in play, in love and in war, to trade or to worship, to help or to hinder. It is in the social relations men establish that their interests find expression and their desires become realized. ” Peter M. Blau Exchange and Power in Social Life ,
Topics and issues — morning — 1. How to measure people ’s network? 2. How large are personal networks? 3. What explains individual variation? 4. Size and connectivity 5. Practical assignment
Topics and issues, — afternoon — 1. Theories about urban life and community – on the emergence of social and physical disorder: collective efficacy broken windows 2. Does the internet change our social relationships?
Topics and issues, morning session 1. How to measure people ’s network? 2. How large are personal networks? 3. What explains individual variation? 4. Practical assignment
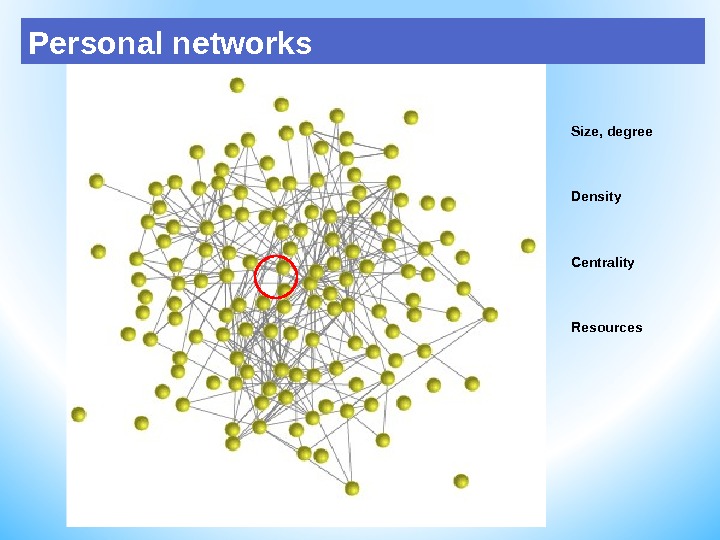
CPersonal networks Size, degree Density Centrality Resources
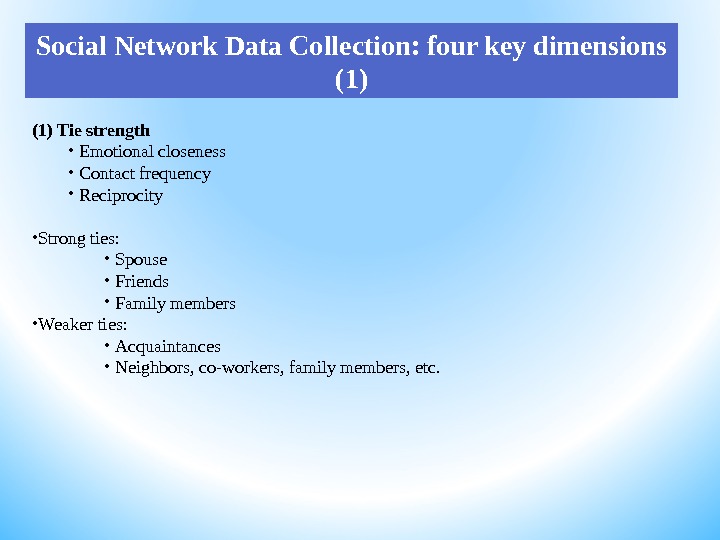
Social Network Data Collection: four key dimensions (1) Tie strength • Emotional closeness • Contact frequency • Reciprocity • Strong ties: • Spouse • Friends • Family members • Weaker ties: • Acquaintances • Neighbors, co-workers, family members, etc.
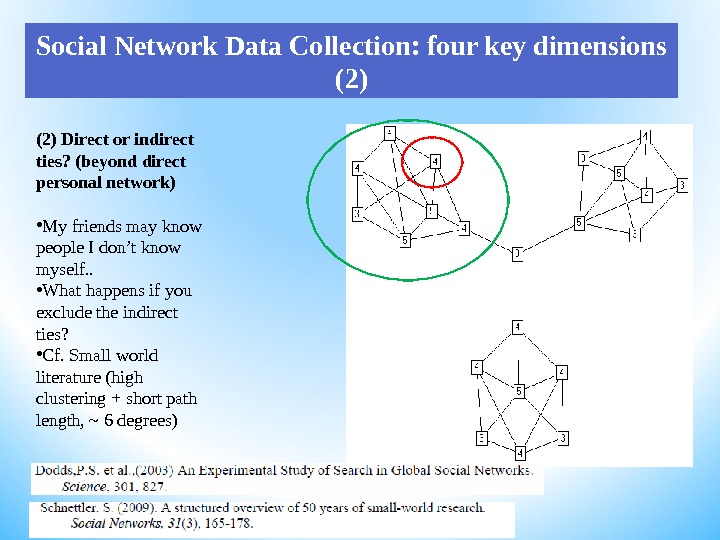
(2) Direct or indirect ties? (beyond direct personal network) • My friends may know people I don ’t know myself. . • What happens if you exclude the indirect ties? • Cf. Small world literature (high clustering + short path length, ~ 6 degrees)Social Network Data Collection: four key dimensions (2)
Intermezzo Small world experiment
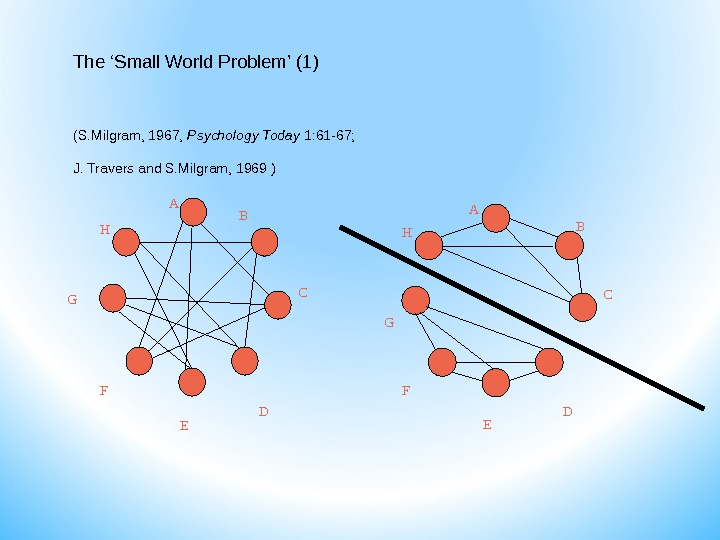
H B C G F E DA H B C F E DG AThe ‘ Small World Problem ’ (1) (S. Milgram, 1967, Psychology Today 1: 61 -67; J. Travers and S. Milgram, 1969 )
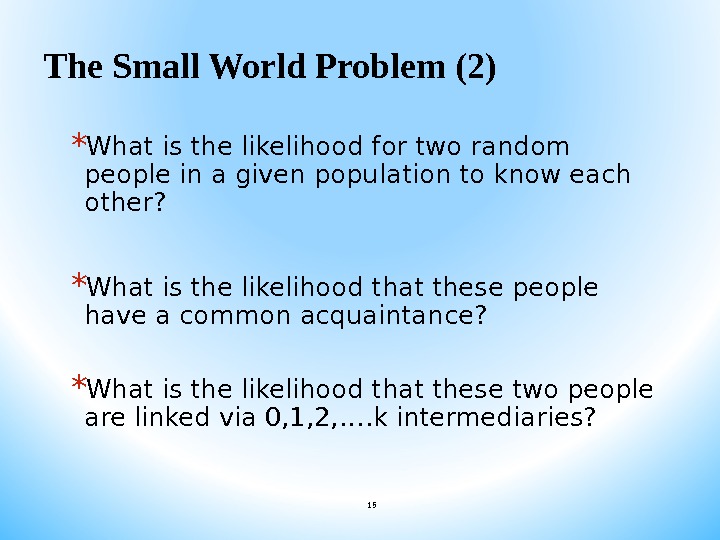
The Small World Problem (2) * What is the likelihood for two random people in a given population to know each other? * What is the likelihood that these people have a common acquaintance? * What is the likelihood that these two people are linked via 0, 1, 2, …. k intermediar ies?
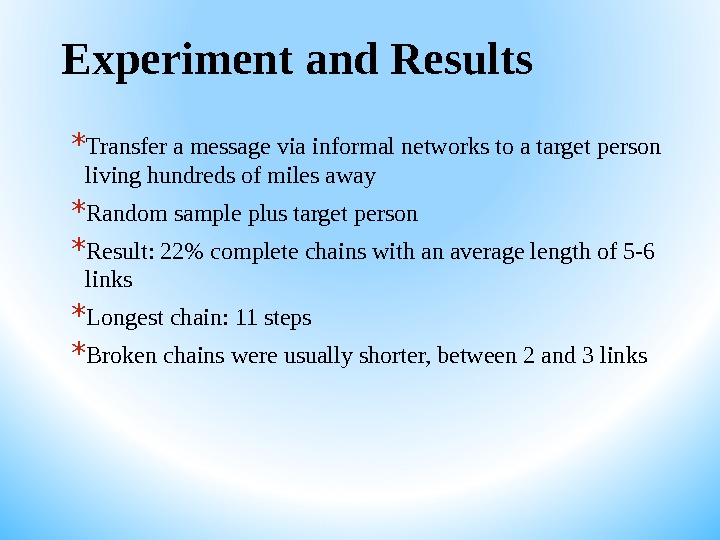
Experiment and Results * Transfer a message via informal networks to a target person living hundreds of miles away * Random sample plus target person * Result: 22% complete chains with an average length of 5 -6 links * Longest chain: 11 steps * Broken chains were usually shorter, between 2 and 3 links
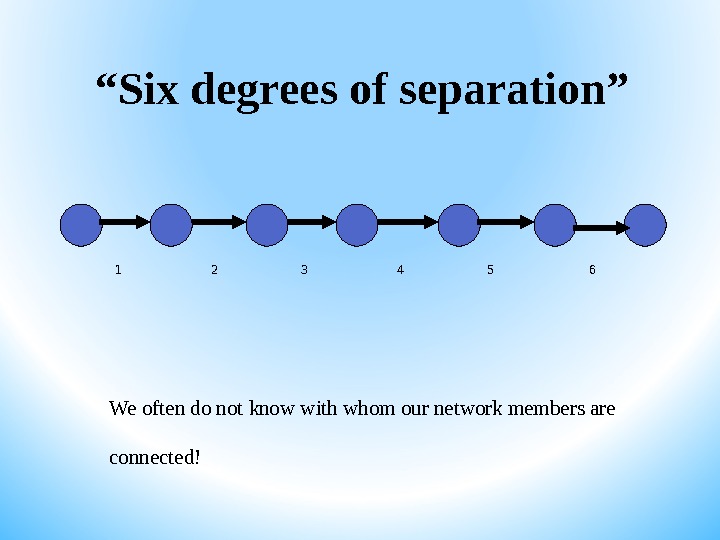
“ Six degrees of separation ” We often do not know with whom our network members are connected!
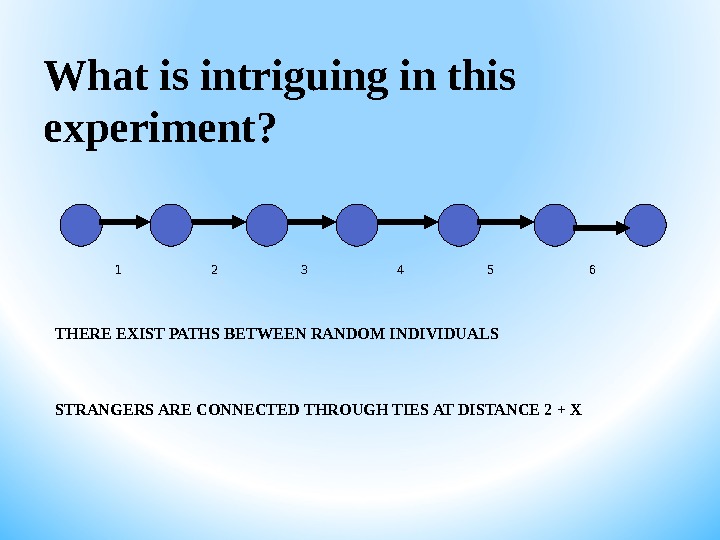
What is intriguing in this experiment? THERE EXIST PATHS BETWEEN RANDOM INDIVIDUALS STRANGERS ARE CONNECTED THROUGH TIES AT DISTANCE 2 + X
Many replications… — See Schnettler 2009 for an overview — Famous replication: Dodds e. a. (2003) small world study by email and between continents. Results are similar like Milgram! — Potential: study inequality and cohesion. Who is better connected? And why?
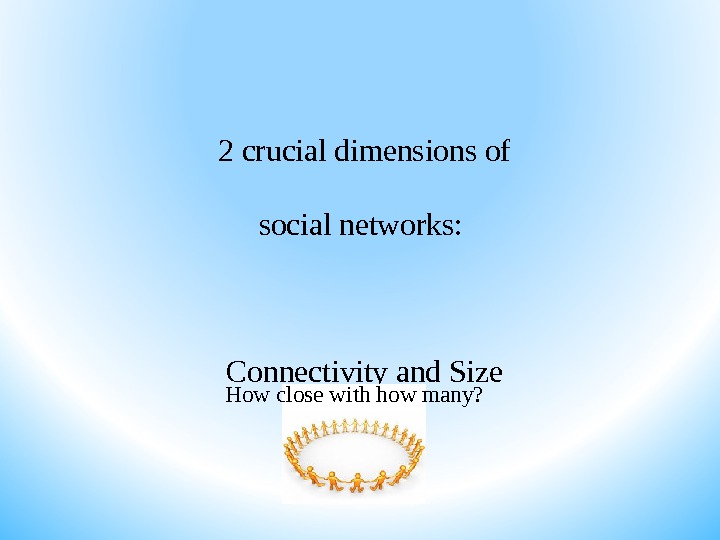
2 crucial dimensions of social networks: Connectivity and Size How close with how many?
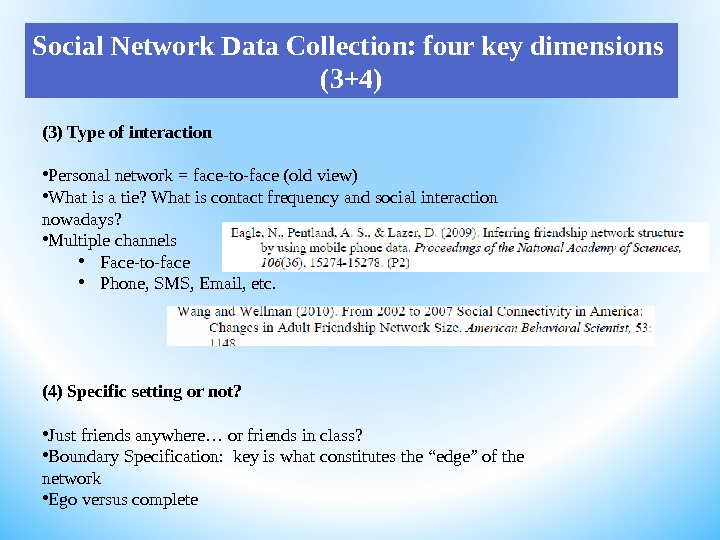
(3) Type of interaction • Personal network = face-to-face (old view) • What is a tie? What is contact frequency and social interaction nowadays? • Multiple channels • Face-to-face • Phone, SMS, Email, etc. (4) Specific setting or not? • Just friends anywhere… or friends in class? • Boundary Specification: key is what constitutes the “edge” of the network • Ego versus complete. Social Network Data Collection: four key dimensions (3+4)
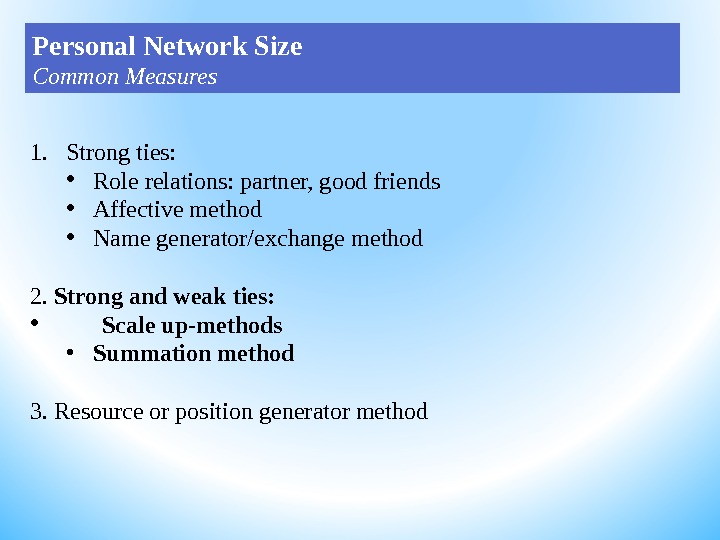
1. Stronger ties: • Role relations: partner, good friends • Affective method • Name generator/exchange method 2. Strong and weak ties: • Scale up-methods • Summation method 3. Resource or position generator method: social capital Personal Network Size Common Measures
1. Stronger ties: • Role relations: partner, good friends • Affective method • Name generator/exchange method. Personal Network Size Common Measures
Role relation * Who is your neighbor, brother, friend? * Advantage: warranty that information is collected from roles that are important for the research * Disadvantage: rather fixed and inflexible, neglects acquaintances, casual contacts etc.
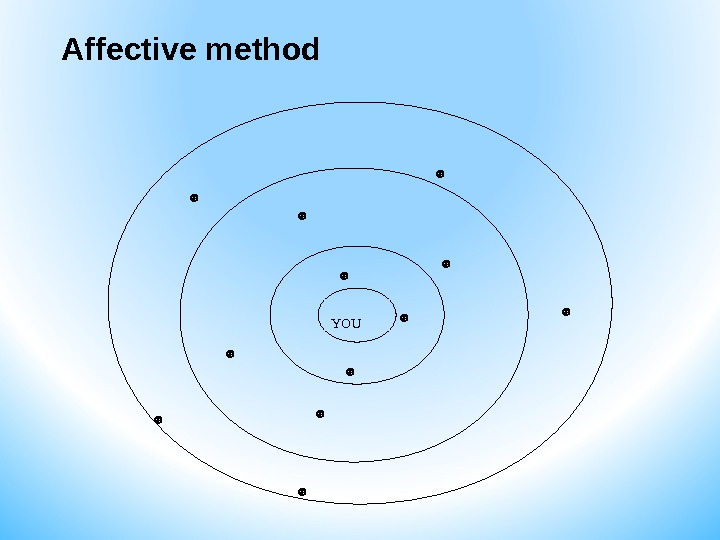
Affective method YOU ☻ ☻ ☻☻ ☻☻ ☻ ☻ ☻☻
Affective method * Advantage: * Easy to understand * Disadvantage: * Focus on just one dimension of relationships, i. e. closeness * People cannot differentiate between many circles of closeness, so the focus comes to lie on strong relationships
Name Generator method * two steps: 1. identifying alters and 2. interpreting the names provided (see e. g. Fischer, 1982, Marsden, 1986, Burt, 1984) * elicits data on alters, the relationship between ego and alter as well between alters * also referred to as ‘ exchange method ’ * note: association between network size and number of different name generators
Exchange method/name generators Delineation not on the basis of one tie characteristic but on joint activities or exchange of commodities between ego and alter. Inquiry of tie characteristics belongs to a second step Advantage: rather flexible and can be adapted to any research problem; allows inquiry into weaker ties Disadvantage: flexibility leads to large variation in applications, it is difficult to compare results among surveys
Example Name Generator (GSS): “ From time to time, most people discuss important matters with other people. Looking back over the last six months — who are the people with whom you discussed matters important to you? Just tell me their first names or initials. ” Why this question? • Only time for one question • Normative pressure and influence likely travels through strong ties • Similar to ‘ best friend ’ or other strong tie generators but not confounded by culture and individual characteristics. Ego Network: Procedure Name Generator GSS
First part. Ego Network: Procedure Name Generator
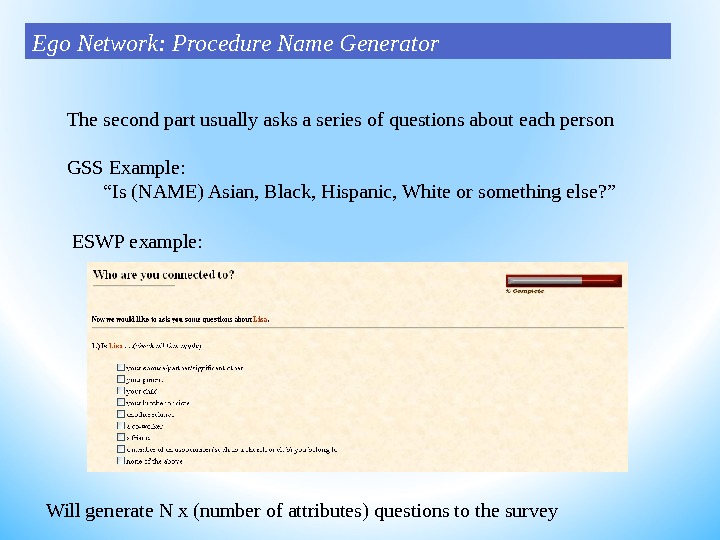
The second part usually asks a series of questions about each person GSS Example: “ Is (NAME) Asian, Black, Hispanic, White or something else? ” ESWP example: Will generate N x (number of attributes) questions to the survey Ego Network: Procedure Name Generator
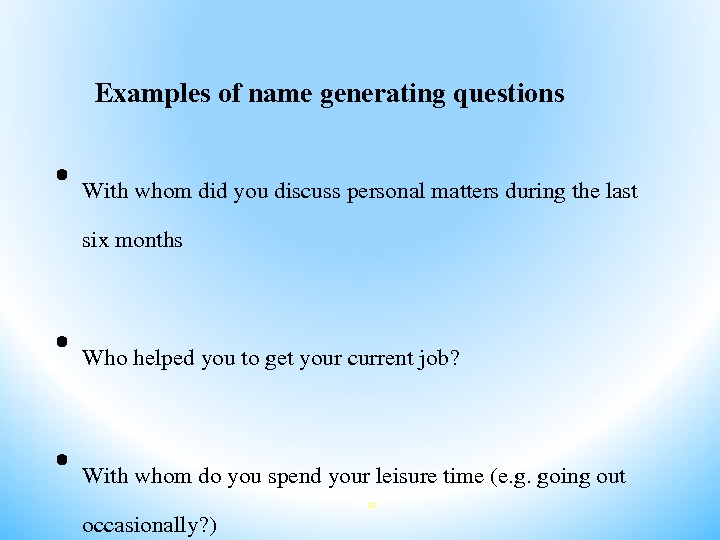
32 Examplesofnamegeneratingquestions • Withwhomdidyoudiscusspersonalmattersduringthelast sixmonths • Whohelpedyoutogetyourcurrentjob? • Withwhomdoyouspendyourleisuretime(e. g. goingout occasionally? ) • Whodoyouaskforadviceifyouhaveaproblemindoing yourjob ?
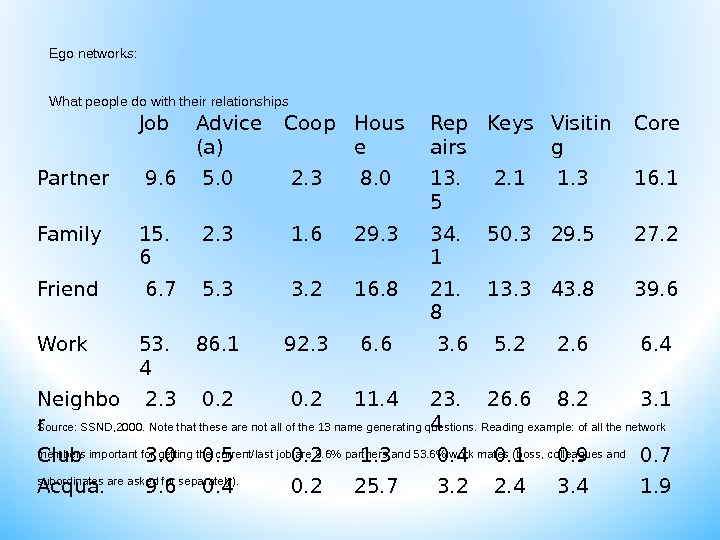
Job Advice (a) Coop Hous e Rep airs Keys Visitin g Core Partner 9. 6 5. 0 2. 3 8. 0 13. 5 2. 1 1. 3 16. 1 Family 15. 6 2. 3 1. 6 29. 3 34. 1 50. 3 29. 5 27. 2 Friend 6. 7 5. 3 3. 2 16. 8 21. 8 13. 3 43. 8 39. 6 Work 53. 4 86. 1 92. 3 6. 6 3. 6 5. 2 2. 6 6. 4 Neighbo r 2. 3 0. 2 11. 4 23. 4 26. 6 8. 2 3. 1 Club 3. 0 0. 5 0. 2 1. 3 0. 4 0. 1 0. 9 0. 7 Acqua. 9. 6 0. 4 0. 2 25. 7 3. 2 2. 4 3. 4 1. 9 Source: SSND, 2000. Note that these are not all of the 13 name generating questions. Reading example: of all the network members important for getting the current/last job are 9. 6% partners and 53. 6% work mates (boss, colleagues and subordinates are asked for separately). Ego networks: What people do with their relationships
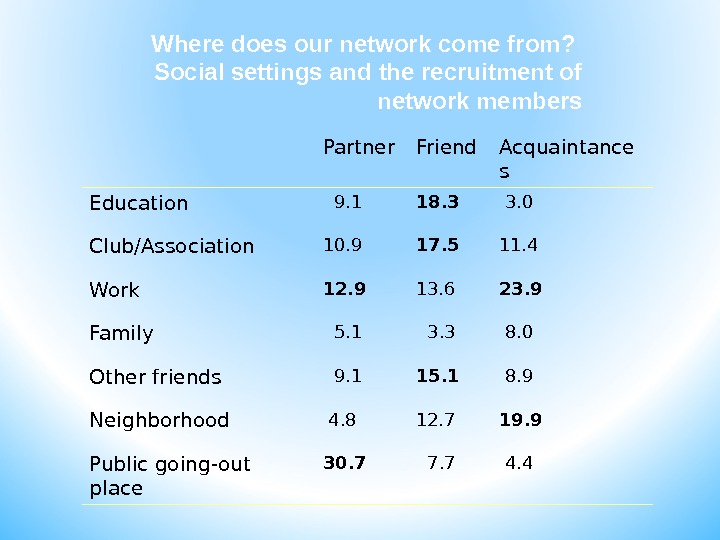
Where does our network come from? Social settings and the recruitment of network members Partner Friend Acquaintance s Education 9. 1 18. 3 3. 0 Club/Association 10. 9 17. 5 11. 4 Work 12. 9 13. 6 23. 9 Family 5. 1 3. 3 8. 0 Other friends 9. 1 15. 1 8. 9 Neighborhood 4. 8 12. 7 19. 9 Public going-out place 30. 7 7. 7 4.
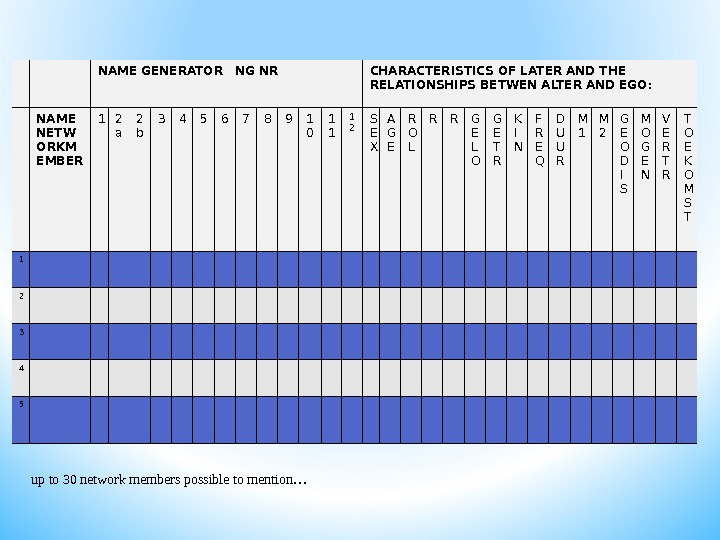
35 Step 2: Characteristics of alters and the relationship ego-alter • Characteristics of alter: – Sex, age, education, occupation, having a paid job, family situation , religion, – role relation with ego • Characteristics of the relationship ego- alter: – Degree of intensity, trust and liking – Duration of relationship – Frequency of contact – Geographical distance – Where did you meet first? – Where do you meet currently?
NAME GENERATOR NG NR CHARACTERISTICS OF LATER AND THE RELATIONSHIPS BETWEN ALTER AND EGO: NAME NETW ORKM EMBER 1 2 a 2 b 3 4 5 6 7 8 9 1 0 1 1 1 2 S E X A G E R O L R R G E L O G E T R K I N F R E Q D U U R M 1 M 2 G E O D I S M O G E N V E R T O E K O M S T 1 2 3 4 5 up to 30 network members possible to mention…
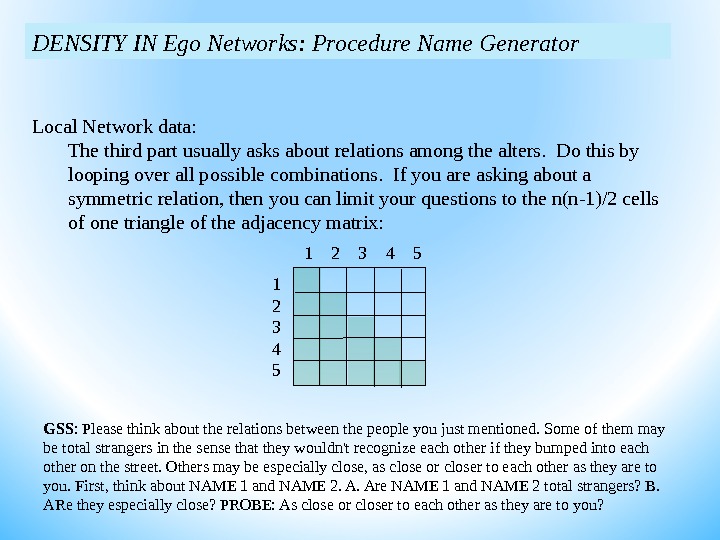
Local Network data: The third part usually asks about relations among the alters. Do this by looping over all possible combinations. If you are asking about a symmetric relation, then you can limit your questions to the n(n-1)/2 cells of one triangle of the adjacency matrix: 1 2 3 4 5 1 2 3 4 5 GSS : Please think about the relations between the people you just mentioned. Some of them may be total strangers in the sense that they wouldn’t recognize each other if they bumped into each other on the street. Others may be especially close, as close or closer to each other as they are to you. First, think about NAME 1 and NAME 2. A. Are NAME 1 and NAME 2 total strangers? B. ARe they especially close? PROBE: As close or closer to each other as they are to you? DENSITY IN Ego Networks: Procedure Name Generator
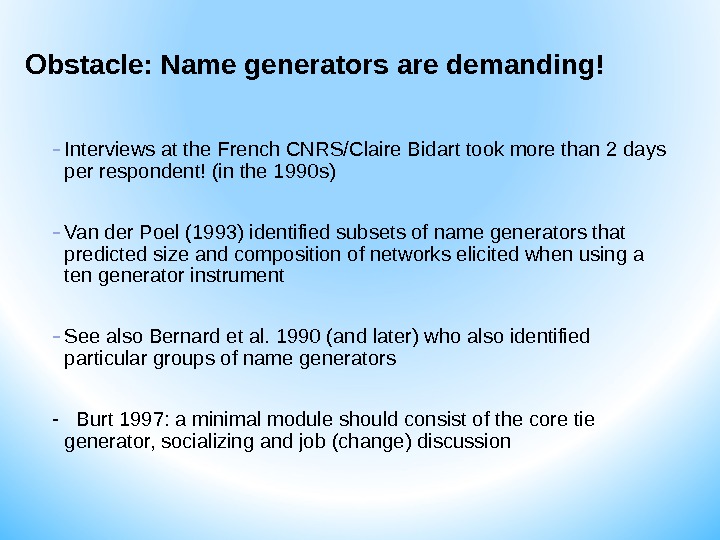
Obstacle: Name generators are demanding! — Interviews at the French CNRS/Claire Bidart took more than 2 days per respondent! (in the 1990 s) — Van der Poel (1993) identified subsets of name generators that predicted size and composition of networks elicited when using a ten generator instrument — See also Bernard et al. 1990 (and later) who also identified particular groups of name generators — Burt 1997: a minimal module should consist of the core tie generator, socializing and job (change) discussion
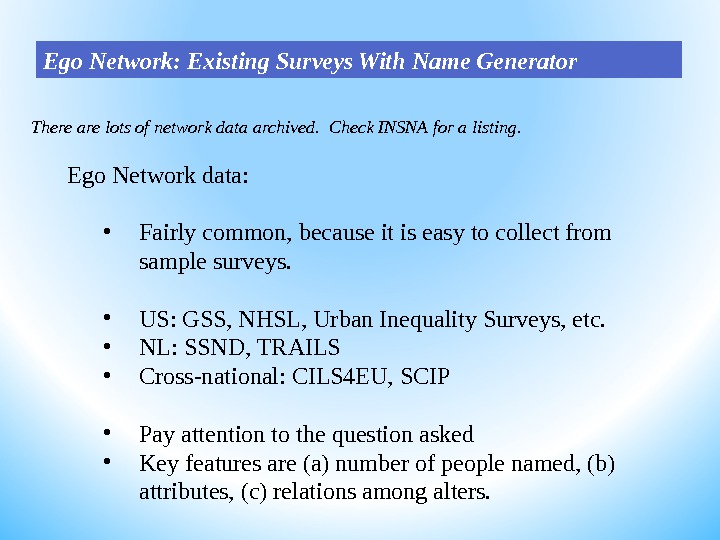
There are lots of network data archived. Check INSNA for a listing. Ego Network data: • Fairly common, because it is easy to collect from sample surveys. • US: GSS, NHSL, Urban Inequality Surveys, etc. • NL: SSND, TRAILS • Cross-national: CILS 4 EU, SCIP • Pay attention to the question asked • Key features are (a) number of people named, (b) attributes, (c) relations among alters. Ego Network: Existing Surveys With Name Generator
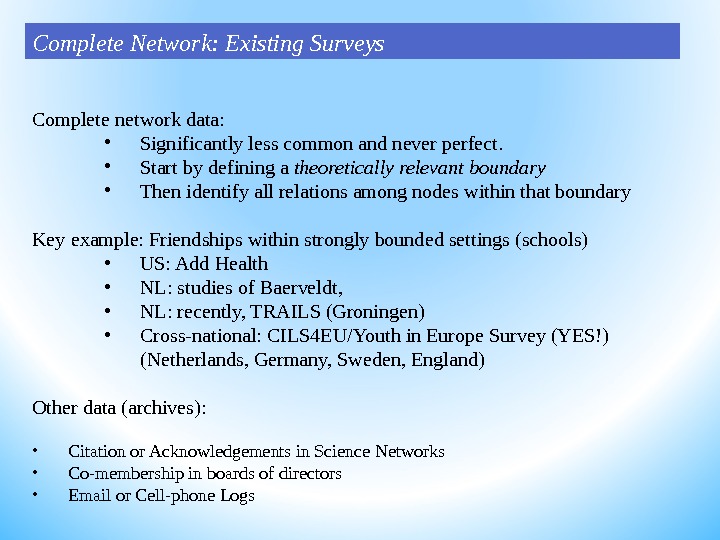
Complete network data: • Significantly less common and never perfect. • Start by defining a theoretically relevant boundary • Then identify all relations among nodes within that boundary Key example: Friendships within strongly bounded settings (schools) • US: Add Health • NL: studies of Baerveldt, • NL: recently, TRAILS (Groningen) • Cross-national: CILS 4 EU/Youth in Europe Survey (YES!) (Netherlands, Germany, Sweden, England) Other data (archives): • Citation or Acknowledgements in Science Networks • Co-membership in boards of directors • Email or Cell-phone Logs. Complete Network: Existing Surveys
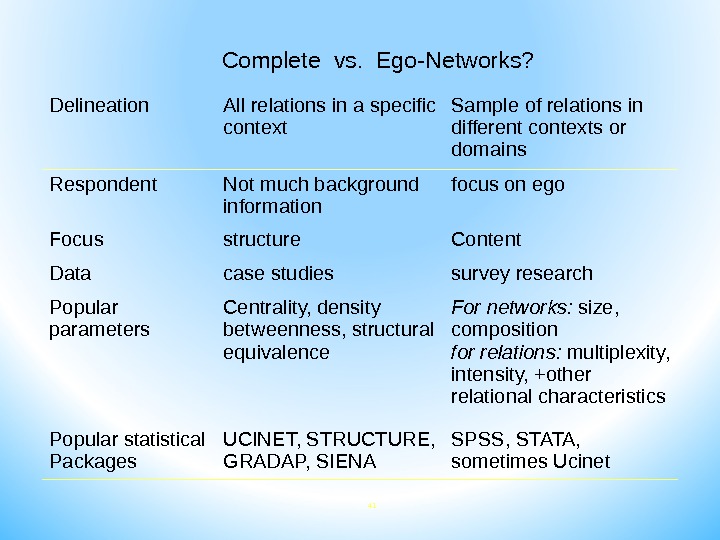
41 Complete vs. Ego-Networks? Delineation All relations in a specific context Sample of relations in different contexts or domains Respondent Not much background information focus on ego Focus structure Content Data case studies survey research Popular parameters Centrality, density betweenness, structural equivalence For networks: size, composition for relations: multiplexity, intensity, +other relational characteristics Popular statistical Packages UCINET, STRUCTURE, GRADAP, SIENA SPSS, STATA, sometimes Ucinet
1. Strong ties: • Role relations: partner, good friends • Affective method • Name generator/exchange method 2. Strong and weak ties: • Scale up-methods • Summation method 3. Resource or position generator method Personal Network Size Common Measures
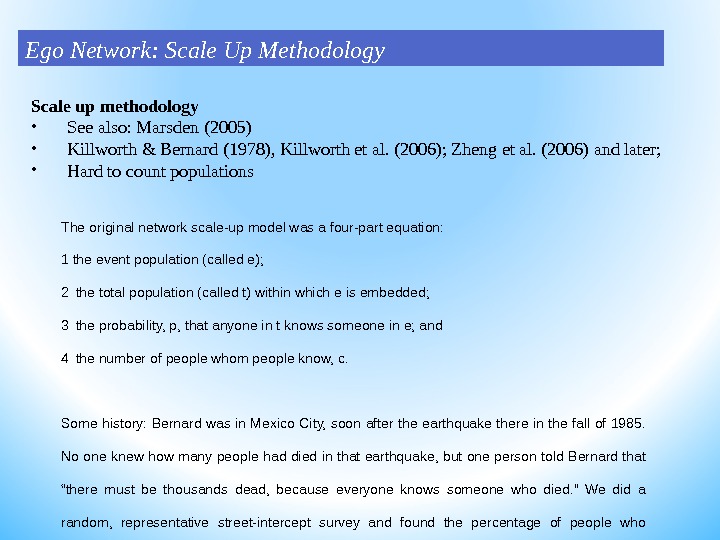
Scale up methodology • See also: Marsden (2005) • Killworth & Bernard (1978), Killworth et al. (2006); Zheng et al. (2006) and later; • Hard to count populations. Ego Network: Scale Up Methodology The original network scale-up model was a four-part equation: 1 the event population (called e); 2 the total population (called t) within which e is embedded; 3 the probability, p, that anyone in t knows someone in e; and 4 the number of people whom people know, c. Some history: Bernard was in Mexico City, soon after the earthquake there in the fall of 1985. No one knew how many people had died in that earthquake, but one person told Bernard that “there must be thousands dead, because everyone knows someone who died. ” We did a random, representative street-intercept survey and found the percentage of people who reported knowing someone who died in the quake. That gave us two parts of the equation. We knew t (Mexico City had around 18 million people at the time) and we knew p. We reasoned that if we knew c, then we could solve for e.
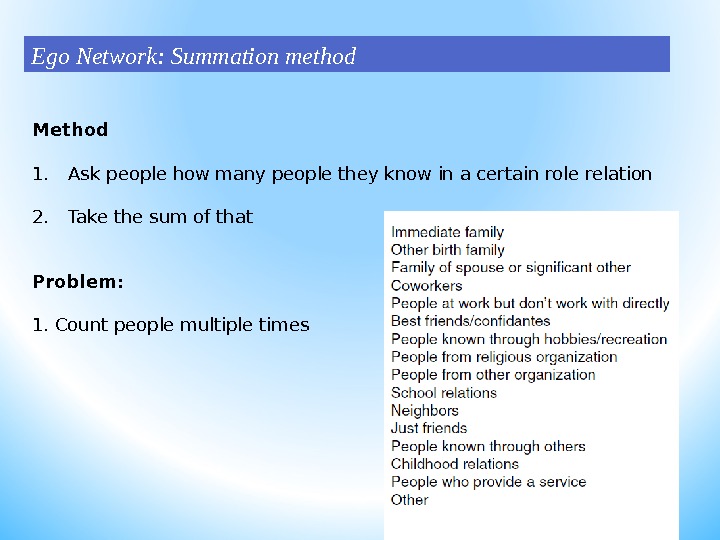
Method 1. Ask people how many people they know in a certain role relation 2. Take the sum of that Problem: 1. Count people multiple times. Ego Network: Summation method
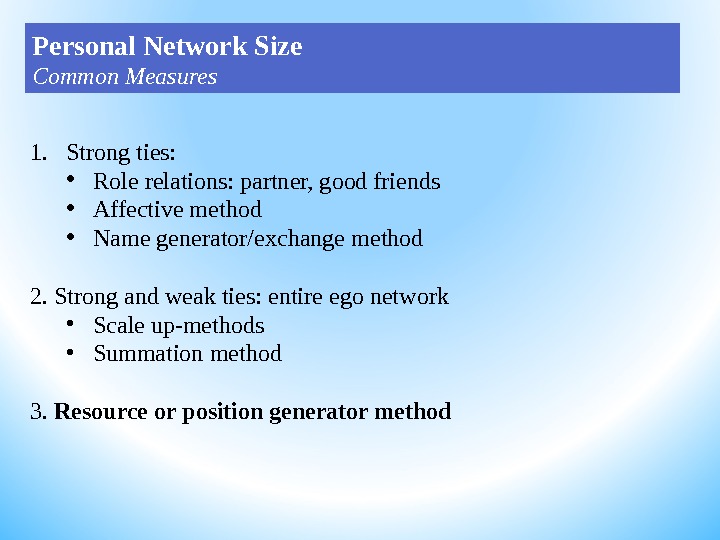
1. Strong ties: • Role relations: partner, good friends • Affective method • Name generator/exchange method 2. Strong and weak ties: entire ego network • Scale up-methods • Summation method 3. Resource or position generator method. Personal Network Size Common Measures
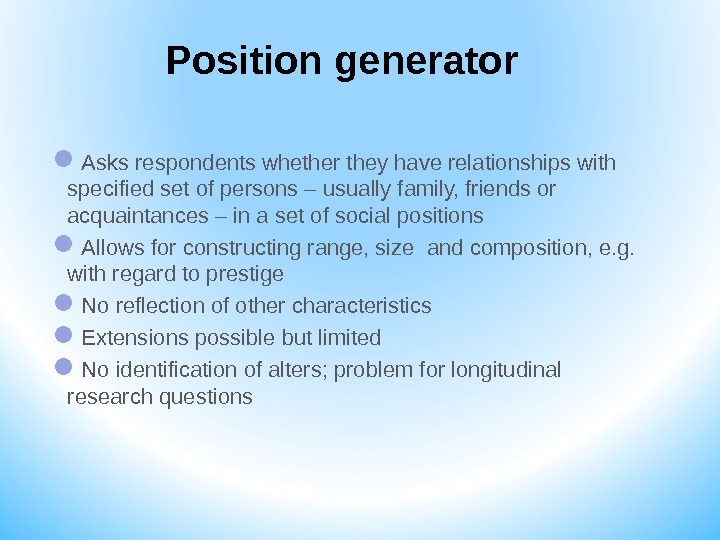
Position generator Asks respondents whether they have relationships with specified set of persons – usually family, friends or acquaintances – in a set of social positions Allows for constructing range, size and composition, e. g. with regard to prestige No reflection of other characteristics Extensions possible but limited No identification of alters; problem for longitudinal research questions
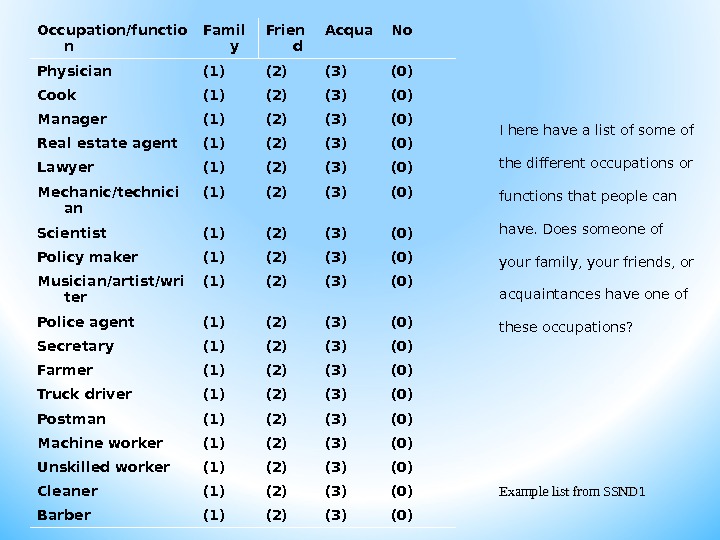
I here have a list of some of the different occupations or functions that people can have. Does someone of your family, your friends, or acquaintances have one of these occupations? Occupation/functio n Famil y Frien d Acqua No Physician (1) (2) (3) (0) Cook (1) (2) (3) (0) Manager (1) (2) (3) (0) Real estate agent (1) (2) (3) (0) Lawyer (1) (2) (3) (0) Mechanic/technici an (1) (2) (3) (0) Scientist (1) (2) (3) (0) Policy maker (1) (2) (3) (0) Musician/artist/wri ter (1) (2) (3) (0) Police agent (1) (2) (3) (0) Secretary (1) (2) (3) (0) Farmer (1) (2) (3) (0) Truck driver (1) (2) (3) (0) Postman (1) (2) (3) (0) Machine worker (1) (2) (3) (0) Unskilled worker (1) (2) (3) (0) Cleaner (1) (2) (3) (0) Barber (1) (2) (3) (0) Example list from SSN
Extension of position generator: resource generator * Van der Gaag 2004 * Instrument for measuring individual social capital * Focuses on whether alters have specific possessions or capacities
49 Position generator
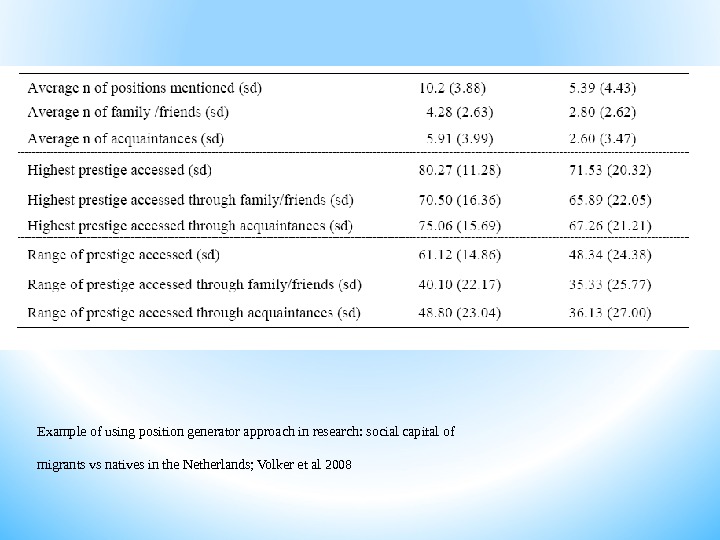
Example of using position generator approach in research: social capital of migrants vs natives in the Netherlands; Volker et al
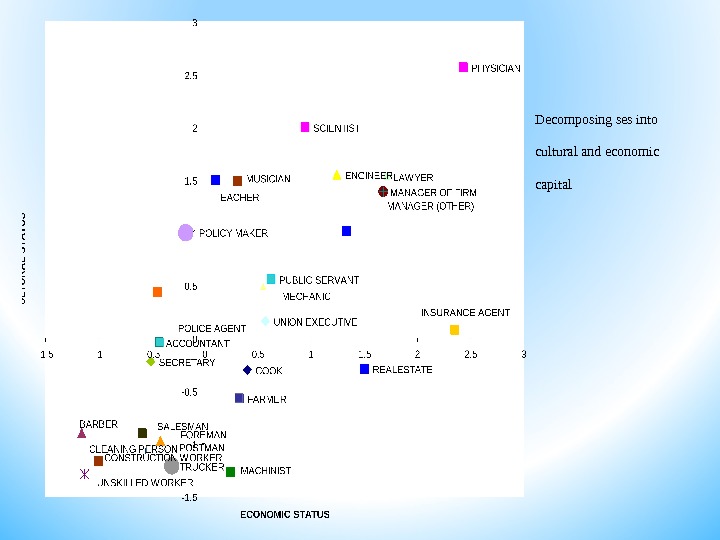
Decomposing ses into cultural and economic capital
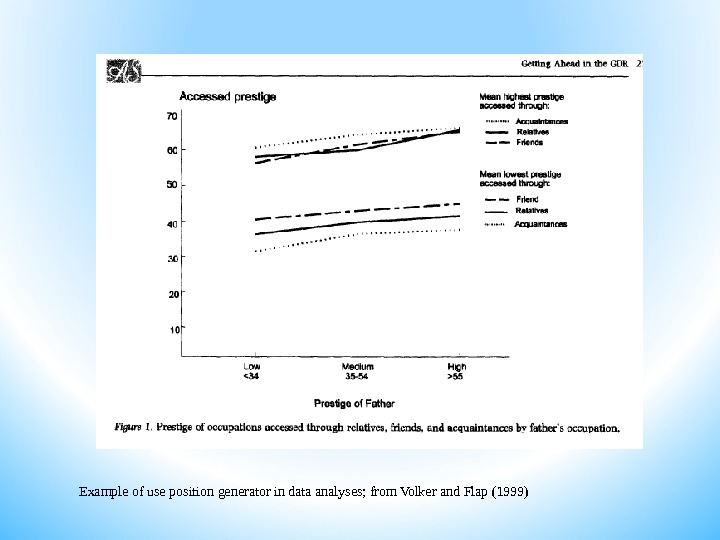
Example of use position generator in data analyses; from Volker and Flap (1999)
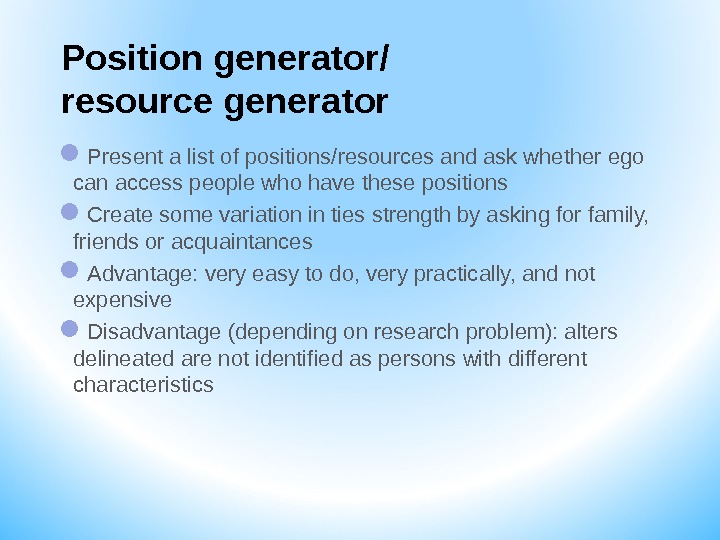
Position generator/ resource generator Present a list of positions/resources and ask whether ego can access people who have these positions Create some variation in ties strength by asking for family, friends or acquaintances Advantage: very easy to do, very practically, and not expensive Disadvantage (depending on research problem): alters delineated are not identified as persons with different characteristics
Topics and issues 1. How to measure people ’s network? 2. How large are personal networks? 3. What explains individual variation? 4. Size and connectivity 5. Practical assignment
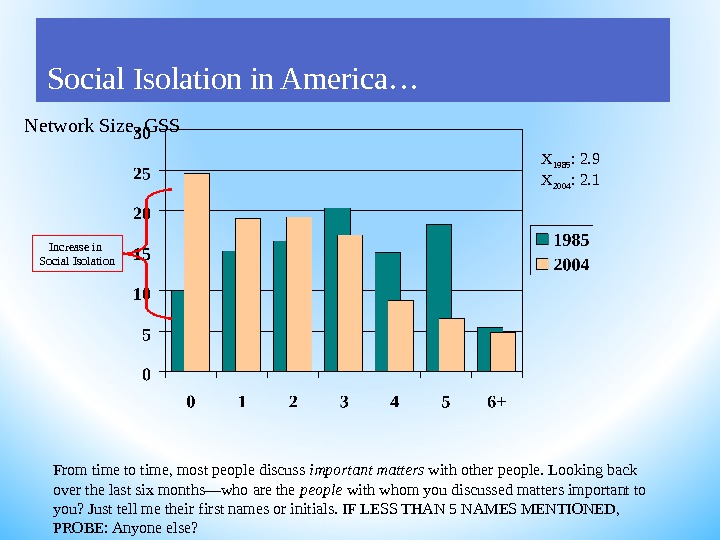
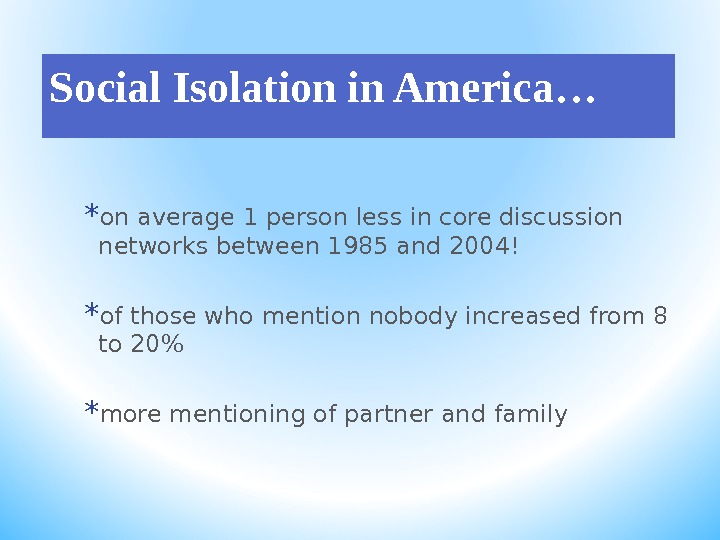
Network Size, GSS From time to time, most people discuss important matters with other people. Looking back over the last six months—who are the people with whom you discussed matters important to you? Just tell me their first names or initials. IF LESS THAN 5 NAMES MENTIONED, PROBE: Anyone else? X 1985 : 2. 9 X 2004 : 2. 1 Increase in Social Isolation in America…
Social Isolation in America…
Social Isolation in America …
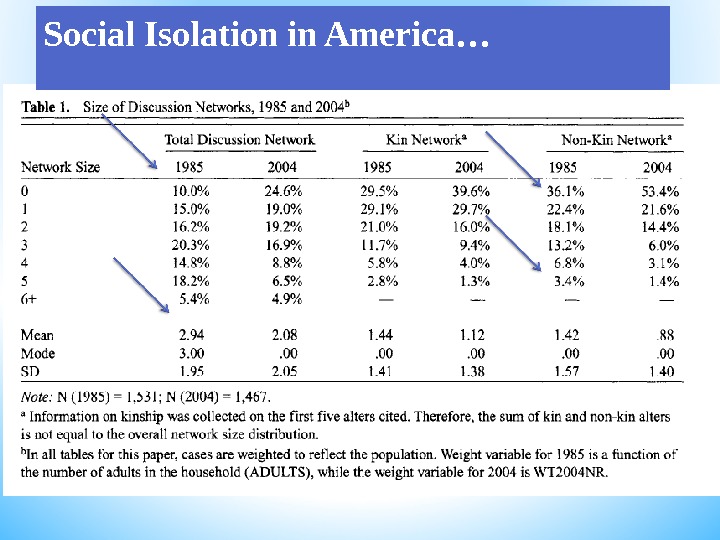
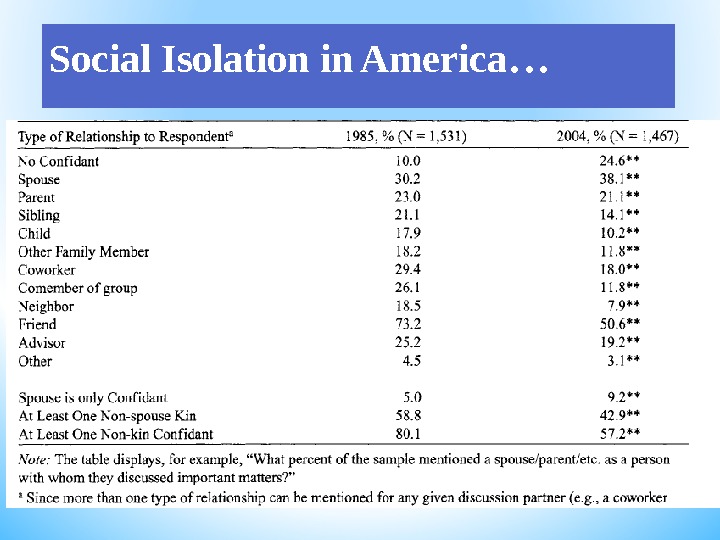
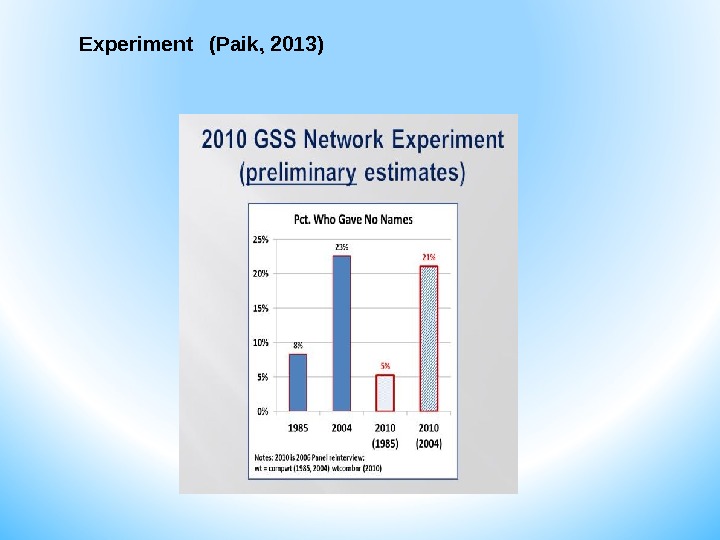
Social Isolation in America… * on average 1 person less in core discussion networks between 1985 and 2004! * of those who mention nobody increased from 8 to 20% * more mentioning of partner and family
Convinced? Increase in social isolation in US? . . And in general? In our society? Agree with Mc. Pherson et al (2006)?
Criticism by Claude S. Fischer (2009/2011): * Something is strange: other indicators such as education do not predict adequately network size in this data * Wrong coding?
Criticism by Wang and Wellman (2007); Hampton (2011) No replication, no confirmation!
Experiment (Paik, 2013)
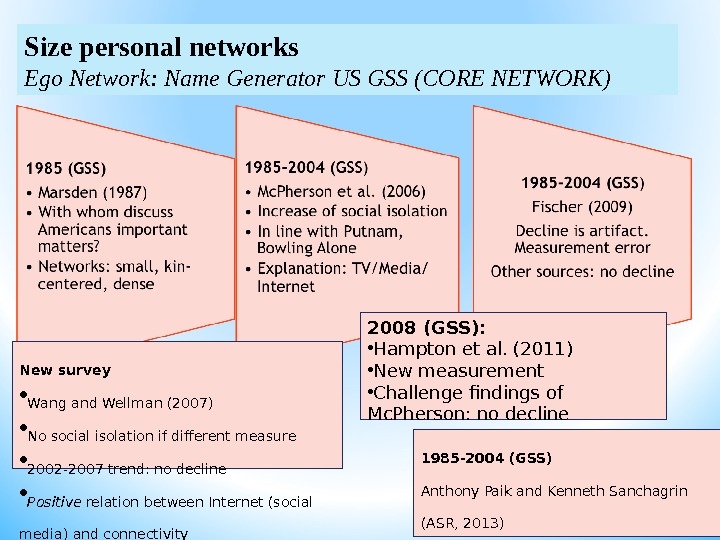
Size personal networks Ego Network: Name Generator US GSS (CORE NETWORK) 1985 -2004 (GSS) Anthony Paik and Kenneth Sanchagrin (ASR, 2013) Interviewer effects: skipped long core network module 2008 (GSS): • Hampton et al. (2011) • New measurement • Challenge findings of Mc. Pherson: no decline. New survey • Wang and Wellman (2007) • No social isolation if different measure • 2002 -2007 trend: no decline • Positive relation between Internet (social media) and connectivity
End of discussion?
NO! composition and quality might have changed (further discussion in afternoon lecture)
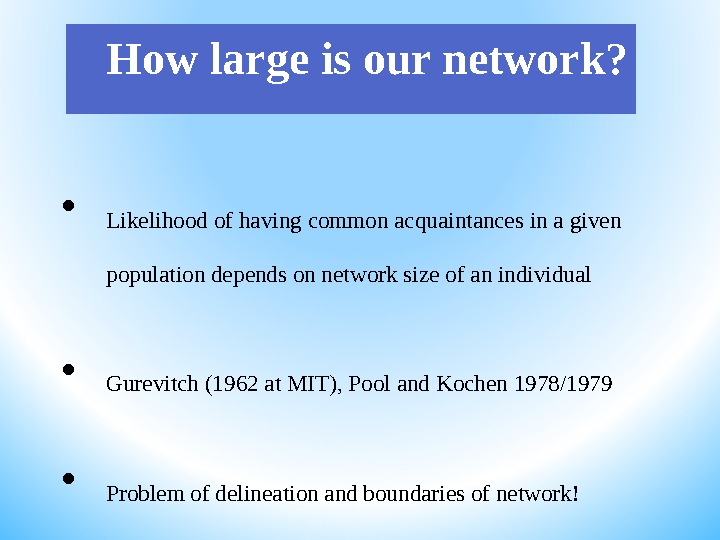
• Likelihood of having common acquaintances in a given population depends on network size of an individual • Gurevitch (1962 at MIT), Pool and Kochen 1978/1979 • Problem of delineation and boundaries of network! How large is our network?
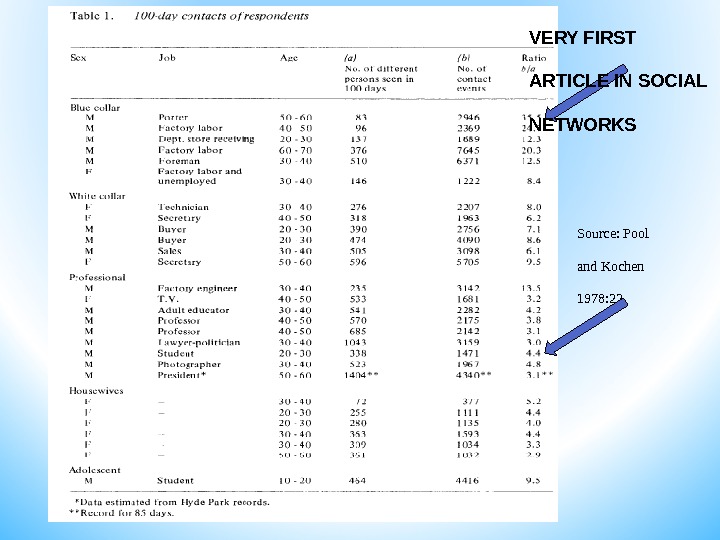
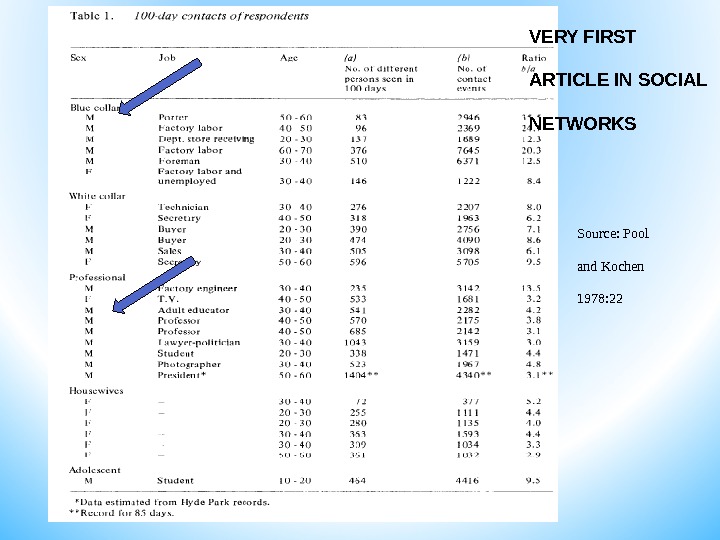
Question asked by Gurevitch: How many different persons does one meet at how many different occasions ?
Average n of 100 day contact: 1000! But huge standardeviation
70 Source: Pool and Kochen 1978: 22 VERY FIRST ARTICLE IN SOCIAL NETWORKS
Our social world depends on the number of people we meet at different occasions. Someone’s social horizon is small if s/he meets always the same person, not matter where s/he goes.
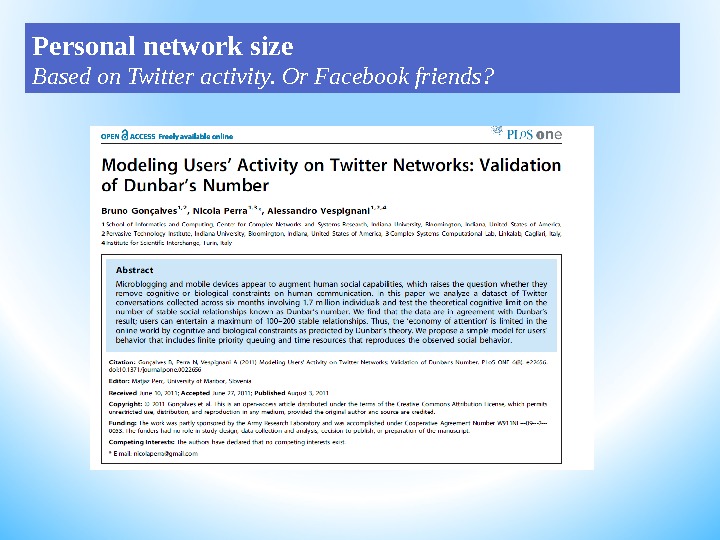
Personal network size Based on Twitter activity. Or Facebook friends?
Topics and issues 1. How to measure people ’s network? 2. How large are personal networks? 3. What explains individual variation? 4. Size and connectivity 5. Practical assignment
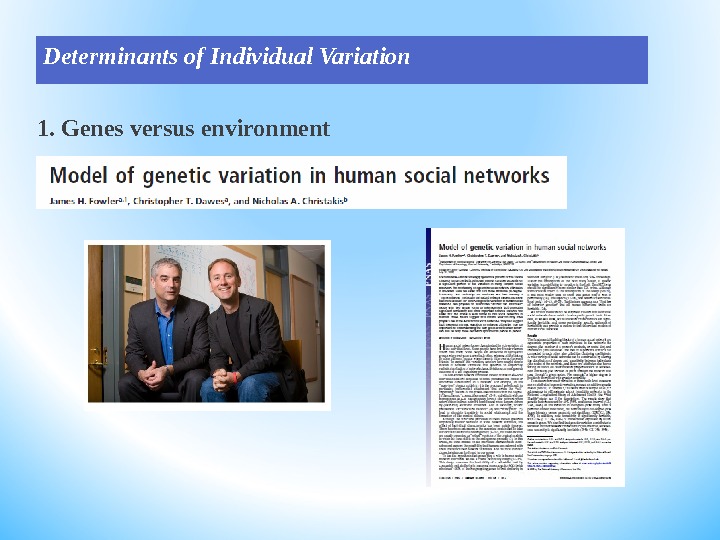
Determinants of Individual Variation 1. Genes versus environment
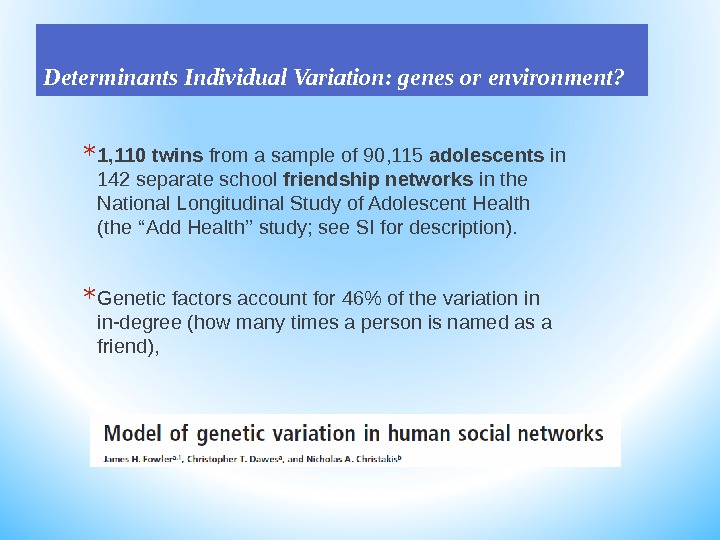
Determinants Individual Variation: genes or environment? * 1, 110 twins from a sample of 90, 115 adolescents in 142 separate school friendship networks in the National Longitudinal Study of Adolescent Health (the ‘‘ Add Health ’’ study; see SI for description). * Genetic factors account for 46% of the variation in in-degree (how many times a person is named as a friend),
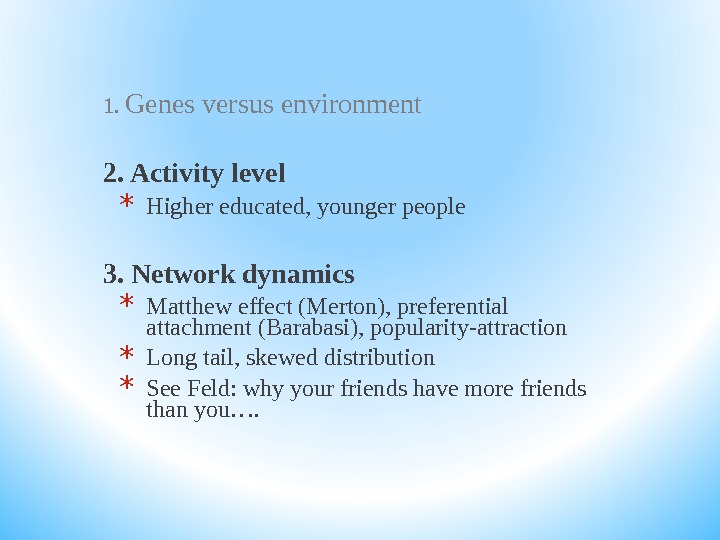
1. Genes versus environment 2. Activity level * Higher educated, younger people 3. Network dynamics * Matthew effect (Merton), preferential attachment (Barabasi), popularity-attraction * Long tail, skewed distribution * See Feld: why your friends have more friends than you….
77 Source: Pool and Kochen 1978: 22 VERY FIRST ARTICLE IN SOCIAL NETWORKS
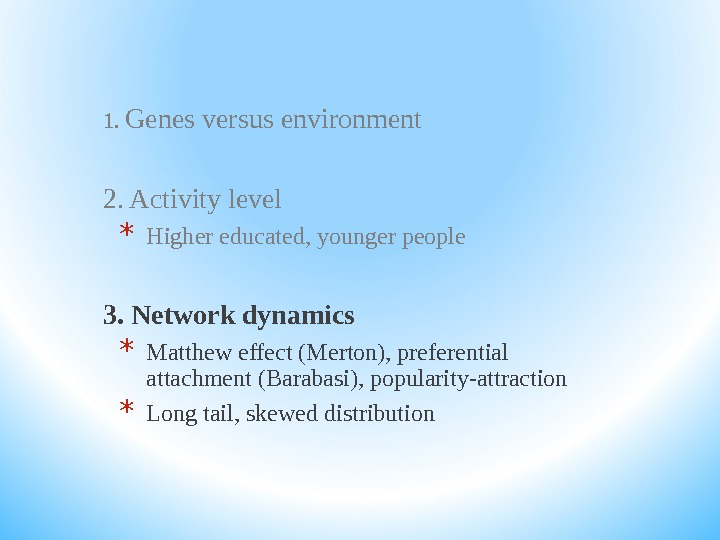
1. Genes versus environment 2. Activity level * Higher educated, younger people 3. Network dynamics * Matthew effect (Merton), preferential attachment (Barabasi), popularity-attraction * Long tail, skewed distribution
Topics and issues 1. How to measure people ’s network? 2. How large are personal networks? 3. What explains individual variation? 4. Size and connectivity 5. Practical assignment
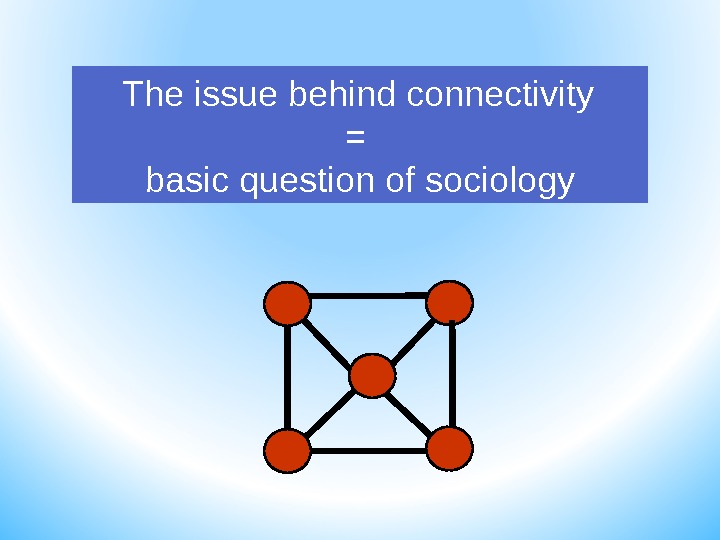
The issue behind connectivity = basic question of sociology
Is there a trend in contemporary society towards the erosion of social networks and communities?
Is there a trend in contemporary society towards the erosion of social networks and communities?
Is there a trend in contemporary society towards the erosion of social networks and communities?
Is there a trend in contemporary society towards the erosion of social networks and communities?
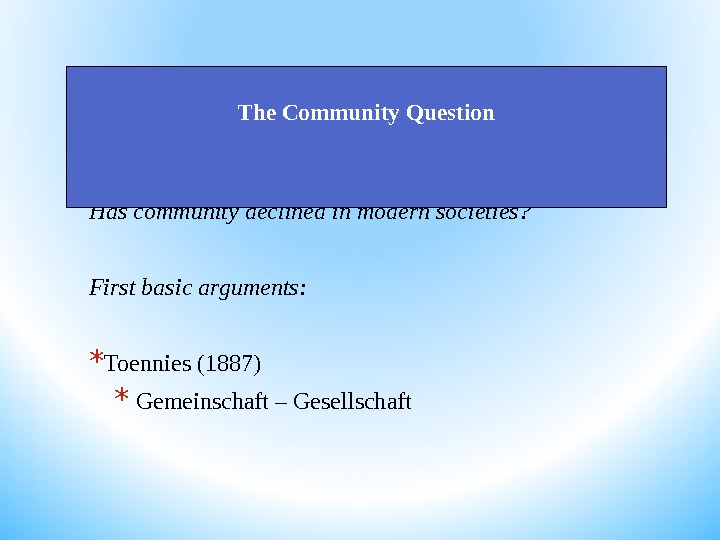
Has community declined in modern societies? First basic arguments: * Toennies (1887) * Gemeinschaft – Gesellschaft The Community Question
Influences: Chicago school of sociology (1920 onwards) * Ecological perspective on sociology * Ethnographic, descriptive tradition * Studied Urban life and consequences of urbanization * Became later influential in studies in crime * See a. o. : Wirth, Park, Sutherland, Burgess
Usual implications * Community = locally bounded * Community = a thing that has to be desired since it facilitates solidarity behavior and individual wellbeing and it hampers asocial behavior like crime or vandalism.
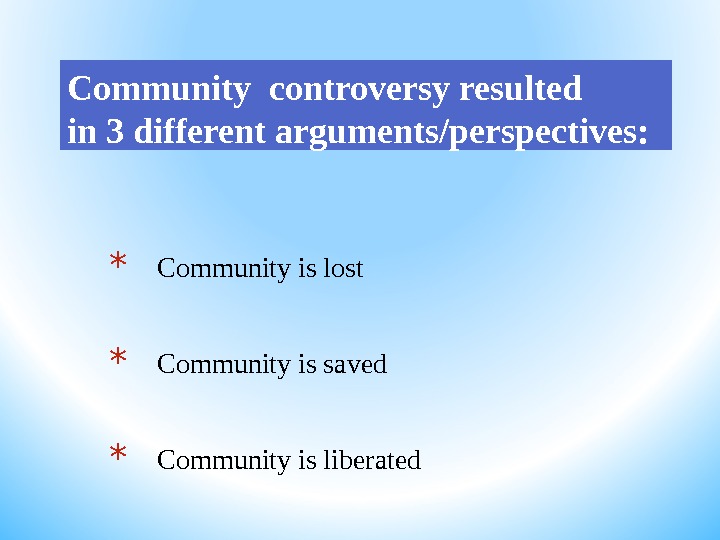
Community controversy resulted in 3 different arguments/perspectives: * Community is lost * Community is saved * Community is liberated
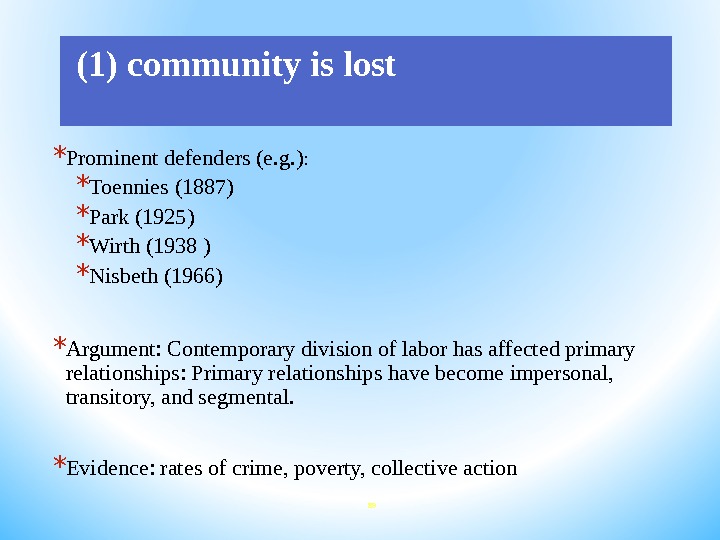
(1) community is lost * Prominent defenders (e. g. ) : * Toennies (1887) * Park (1925) * Wirth (1938 ) * Nisbeth (1966) * Argument: Contemporary division of labor has affected primary relationships: Primary relationships have become impersonal, transitory, and segmental. * Evidence: rates of crime, poverty, collective action
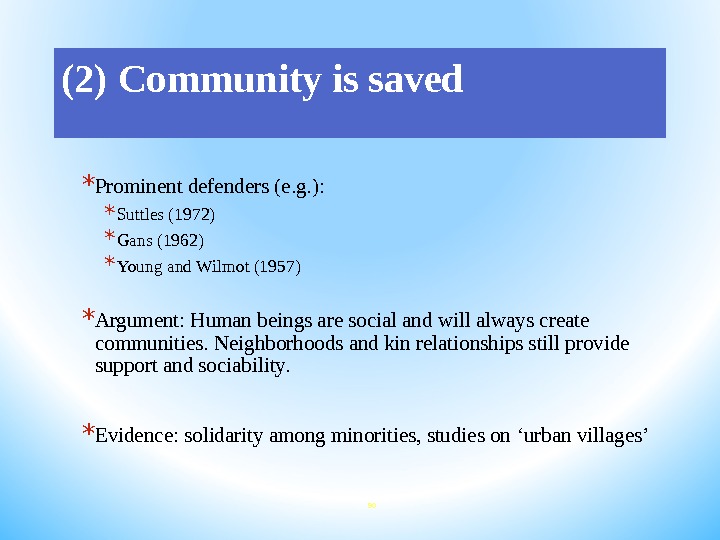
(2) Community is saved * Prominent defenders (e. g. ): * Suttles (1972) * Gans (1962) * Young and Wilmot (1957) * Argument: Human beings are social and will always create communities. Neighborhoods and kin relationships still provide support and sociability. * Evidence: solidarity among minorities, studies on ‘ urban villages ’
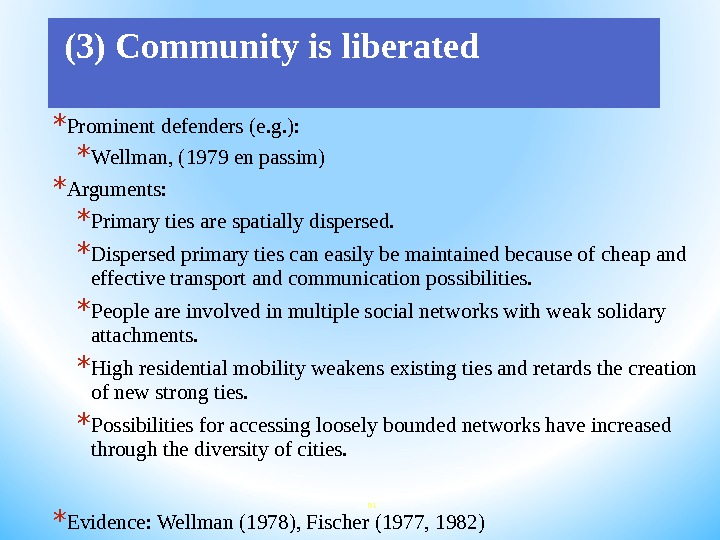
(3) Community is liberated * Prominent defenders (e. g. ): * Wellman, (1979 en passim) * Arguments: * Primary ties are spatially dispersed. * Dispersed primary ties can easily be maintained because of cheap and effective transport and communication possibilities. * People are involved in multiple social networks with weak solidary attachments. * High residential mobility weakens existing ties and retards the creation of new strong ties. * Possibilities for accessing loosely bounded networks have increased through the diversity of cities. * Evidence: Wellman (1978), Fischer (1977, 1982)
More recently: Revival of the Community Controversy * New wave I: The Asymmetric Society * (Coleman 1982) * New wave II: Bowling Alone (Putnam 2000)
Robert Putnam
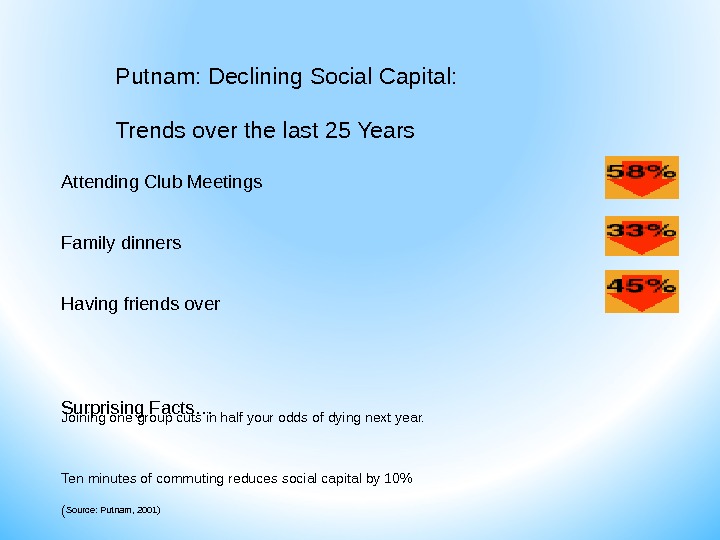
Putnam: Declining Social Capital: Trends over the last 25 Years Attending Club Meetings Family dinners Having friends over Surprising Facts… Joining one group cuts in half your odds of dying next year. Ten minutes of commuting reduces social capital by 10% ( Source: Putnam, 2001)
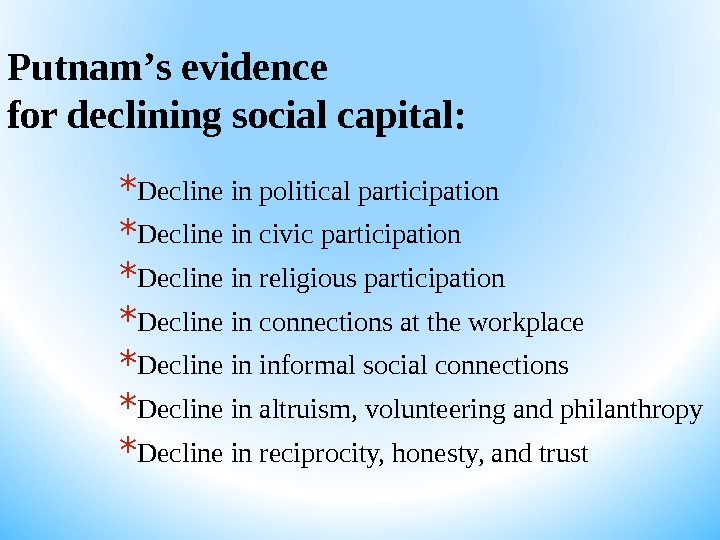
Putnam ’ s evidence for declining social capital: * Decline in political participation * Decline in civic participation * Decline in religious participation * Decline in connections at the workplace * Decline in informal social connections * Decline in altruism, volunteering and philanthropy * Decline in reciprocity, honesty, and trust
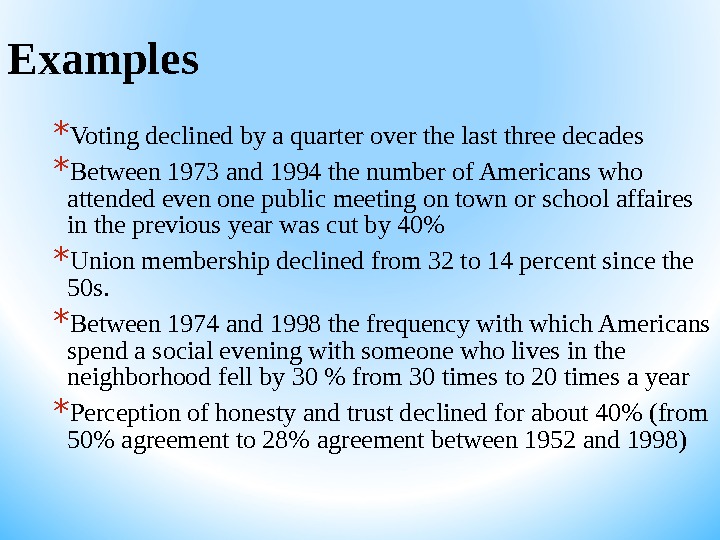
Examples * Voting declined by a quarter over the last three decades * Between 1973 and 1994 the number of Americans who attended even one public meeting on town or school affaires in the previous year was cut by 40% * Union membership declined from 32 to 14 percent since the 50 s. * Between 1974 and 1998 the frequency with which Americans spend a social evening with someone who lives in the neighborhood fell by 30 % from 30 times to 20 times a year * Perception of honesty and trust declined for about 40% (from 50% agreement to 28% agreement between 1952 and 1998)
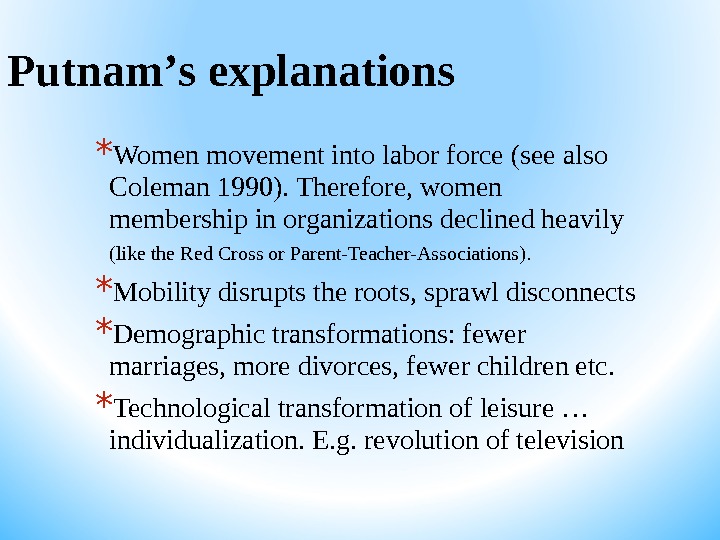
Putnam ’ s explanations * Women movement into labor force (see also Coleman 1990). Therefore, women membership in organizations declined heavily (like the Red Cross or Parent-Teacher-Associations). * Mobility disrupts the roots, sprawl disconnects * Demographic transformations: fewer marriages, more divorces, fewer children etc. * Technological transformation of leisure … individualization. E. g. revolution of television
Criticism * Social connections -> trust * Trust -> social connections * Evidence unclear * For a critical review of Putnam ’ s ‘ Bowling alone ’ , see Durlauf (2002)
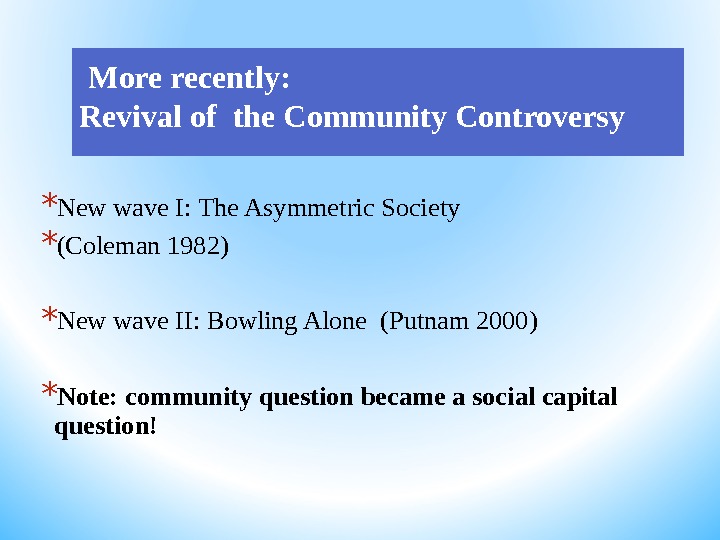
More recently: Revival of the Community Controversy * New wave I: The Asymmetric Society * (Coleman 1982) * New wave II: Bowling Alone (Putnam 2000) * Note: community question became a social capital question!
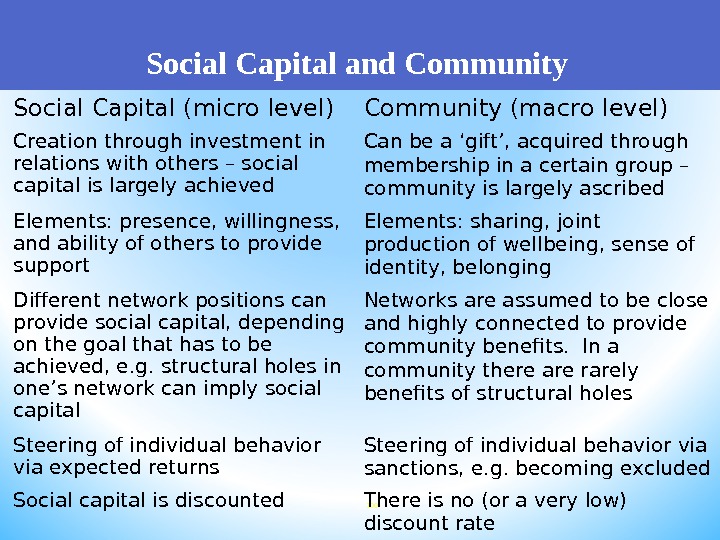
Social Capital and Community 100 Social Capital (micro level) Community (macro level) Creation through investment in relations with others – social capital is largely achieved Can be a ‘ gift ’ , acquired through membership in a certain group – community is largely ascribed Elements: presence, willingness, and ability of others to provide support Elements: sharing, joint production of wellbeing, sense of identity, belonging Different network positions can provide social capital, depending on the goal that has to be achieved, e. g. structural holes in one ’ s network can imply social capital Networks are assumed to be close and highly connected to provide community benefits. In a community there are rarely benefits of structural holes Steering of individual behavior via expected returns Steering of individual behavior via sanctions, e. g. becoming excluded Social capital is discounted There is no (or a very low) discount rate
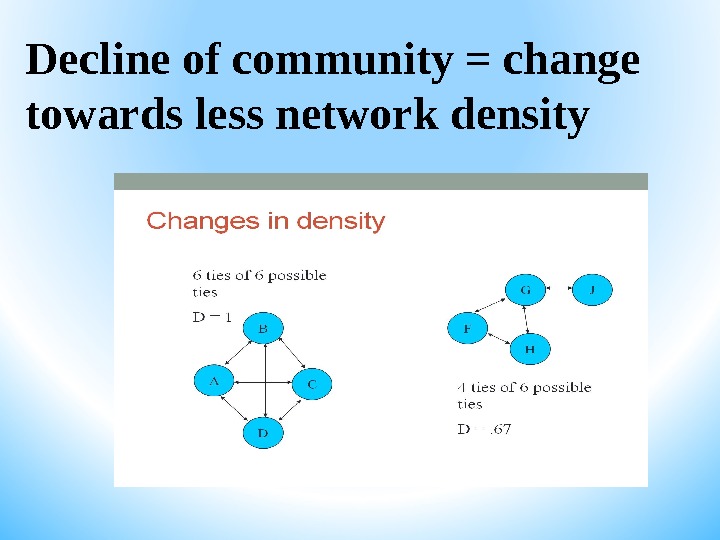
Decline of community = change towards less network density
To dwell among friends – C. S. Fischer (1982) * Study of urban – rural differences (because of lack of longitudinal data) * Important works: * Networks and Places (1977) * To dwell among friends (1982)
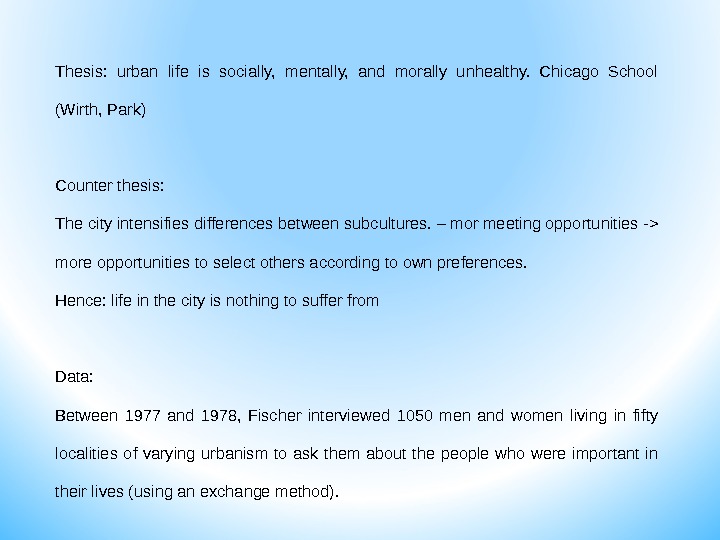
Thesis: urban life is socially, mentally, and morally unhealthy. Chicago School (Wirth, Park) Counter thesis: The city intensifies differences between subcultures. – mor meeting opportunities -> more opportunities to select others according to own preferences. Hence: life in the city is nothing to suffer from Data: Between 1977 and 1978, Fischer interviewed 1050 men and women living in fifty localities of varying urbanism to ask them about the people who were important in their lives (using an exchange method).
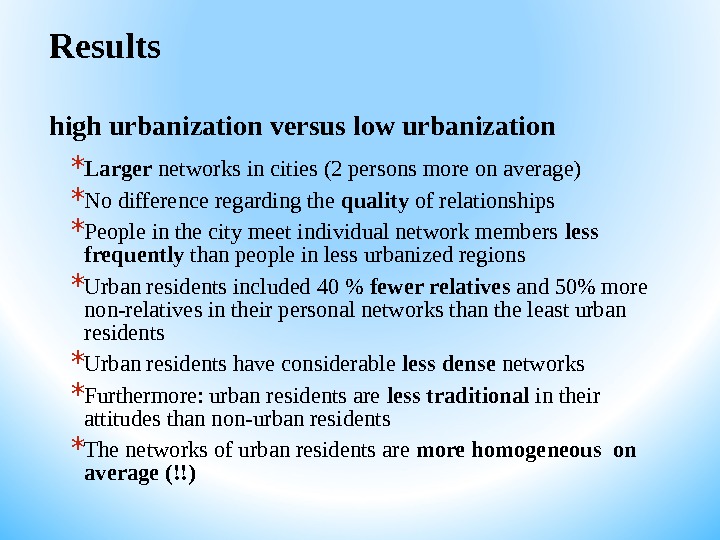
Results high urbanization versus low urbanization * Larger networks in cities (2 persons more on average) * No difference regarding the quality of relationships * People in the city meet individual network members less frequently than people in less urbanized regions * Urban residents included 40 % fewer relatives and 50% more non-relatives in their personal networks than the least urban residents * Urban residents have considerable less dense networks * Furthermore: urban residents are less traditional in their attitudes than non-urban residents * The networks of urban residents are more homogeneous on average (!!)
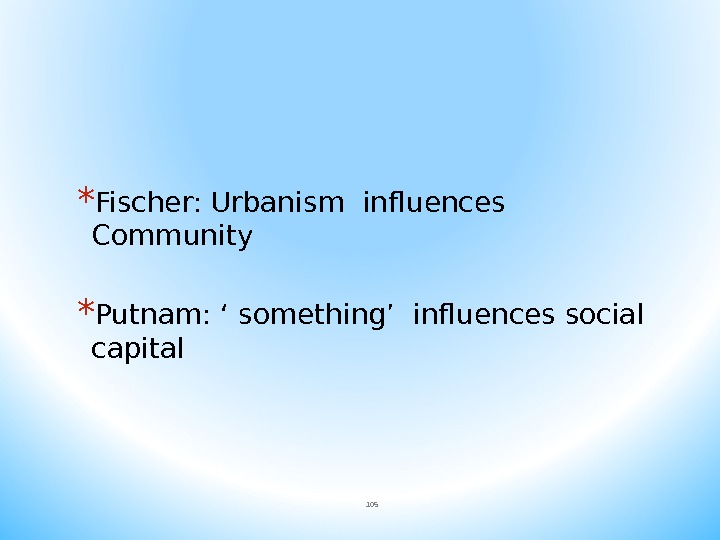
* Fischer: Urbanism influences Community * Putnam: ‘ something’ influences social capital
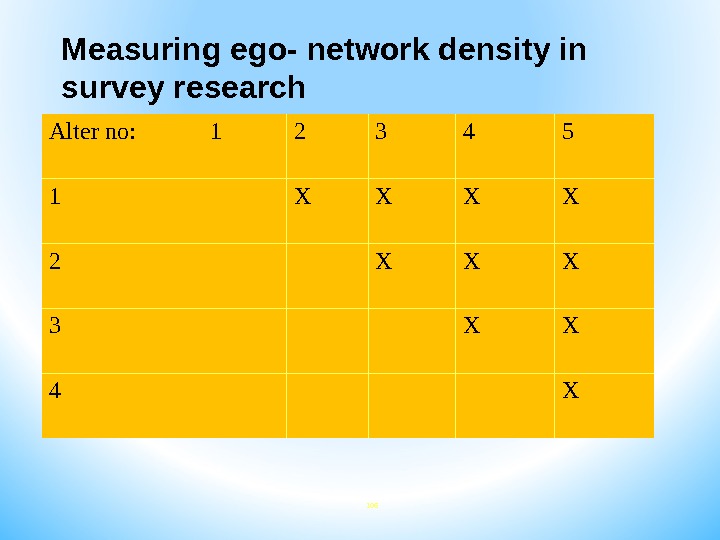
Measuring ego- network density in survey research Alter no: 1 2 3 4 5 1 X X 2 X X X 3 X X 4 X
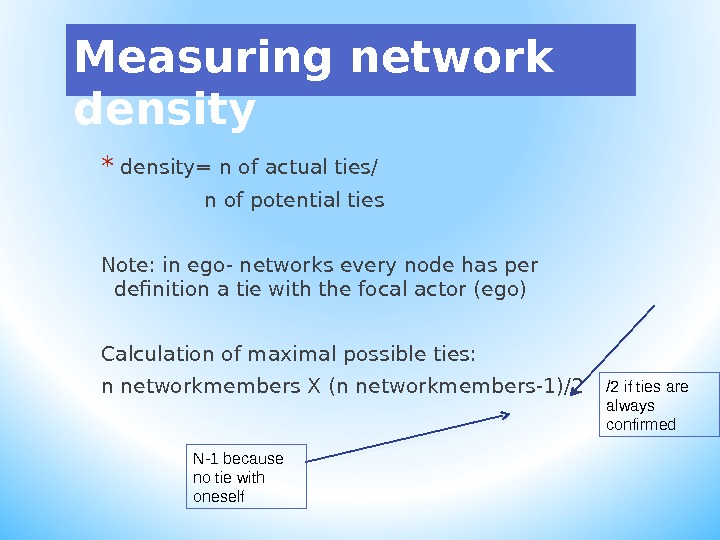
Measuring network density * density= n of actual ties/ n of potential ties Note: in ego- networks every node has per definition a tie with the focal actor (ego) Calculation of maximal possible ties: n networkmembers X (n networkmembers-1)/2 /2 if ties are always confirmed N-1 because no tie with oneself
Topics and issues 1. How to measure people ’s network? 2. How large are personal networks? 3. What explains individual variation? 4. Size and connectivity 5. Practical assignment
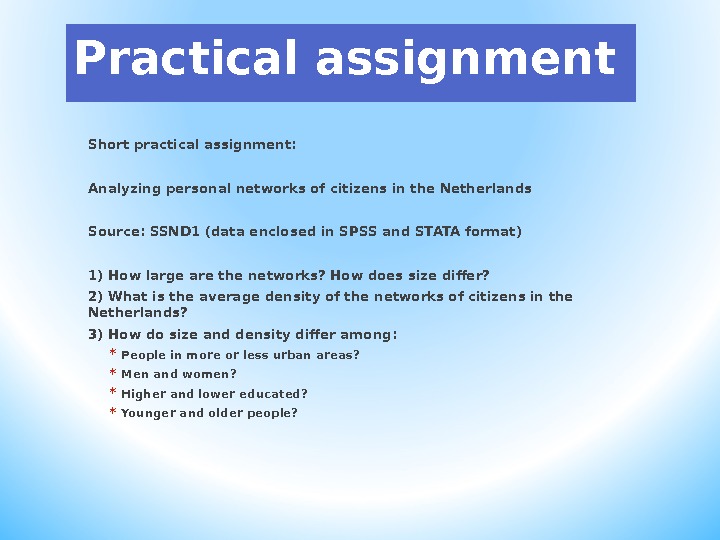
Practical assignment Short practical assignment: Analyzing personal networks of citizens in the Netherlands Source: SSND 1 (data enclosed in SPSS and STATA format) 1) How large are the networks? How does size differ? 2) What is the average density of the networks of citizens in the Netherlands? 3) How do size and density differ among: * People in more or less urban areas? * Men and women? * Higher and lower educated? * Younger and older people?
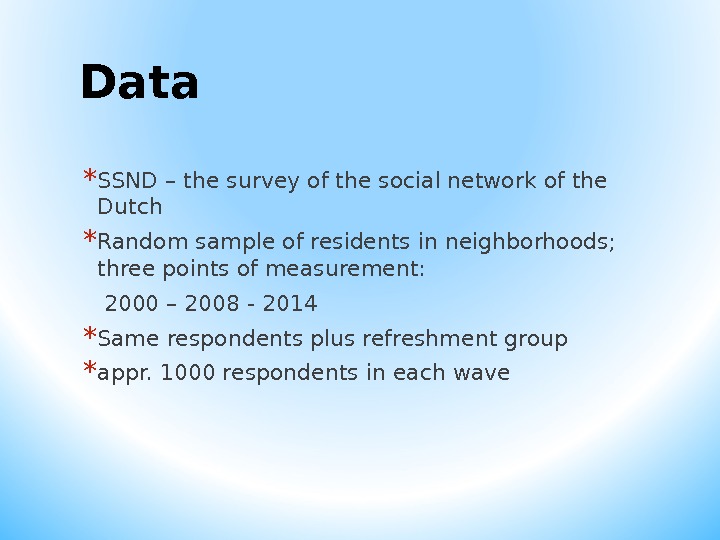
Data * SSND – the survey of the social network of the Dutch * Random sample of residents in neighborhoods; three points of measurement: 2000 – 2008 — 2014 * Same respondents plus refreshment group * appr. 1000 respondents in each wave
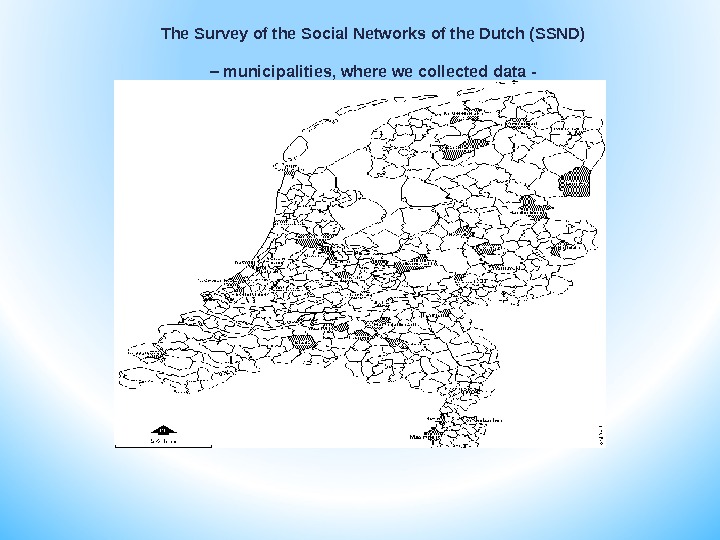
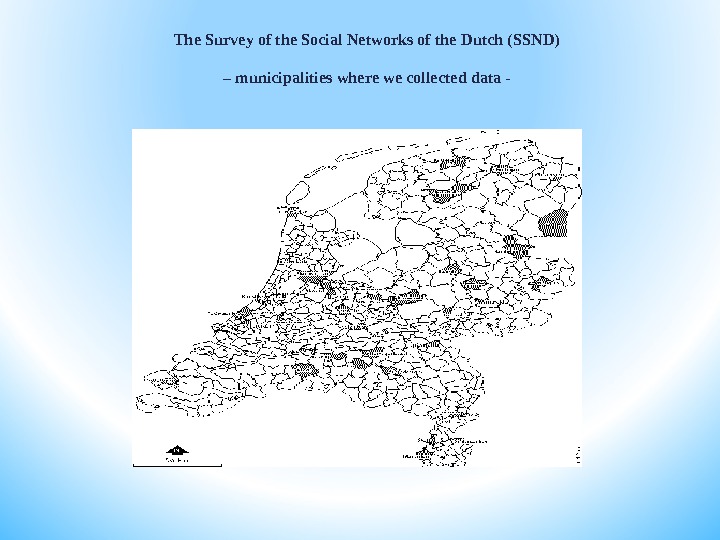
The Survey of the Social Networks of the Dutch (SSND) – municipalities, where we collected data —
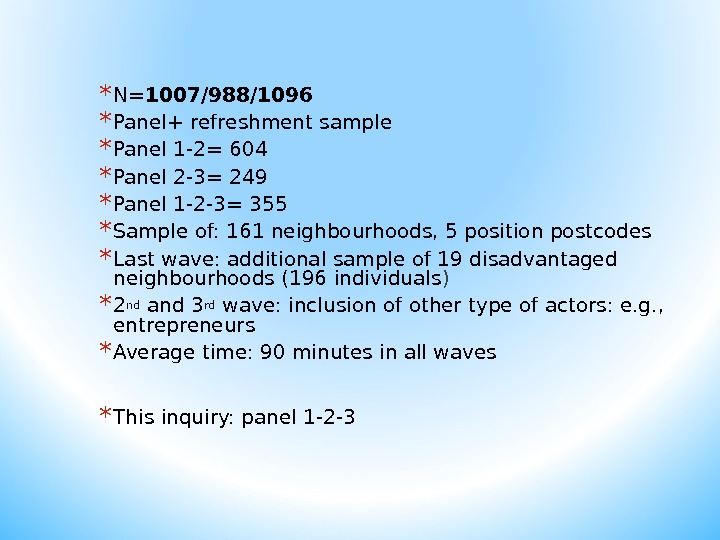
* N= 1007/988/1096 * Panel+ refreshment sample * Panel 1 -2= 604 * Panel 2 -3= 249 * Panel 1 -2 -3= 355 * Sample of: 161 neighbourhoods, 5 position postcodes * Last wave: additional sample of 19 disadvantaged neighbourhoods (196 individuals ) * 2 nd and 3 rd wave: inclusion of other type of actors: e. g. , entrepreneurs * Average time: 90 minutes in all waves * This inquiry: panel 1 -2 —
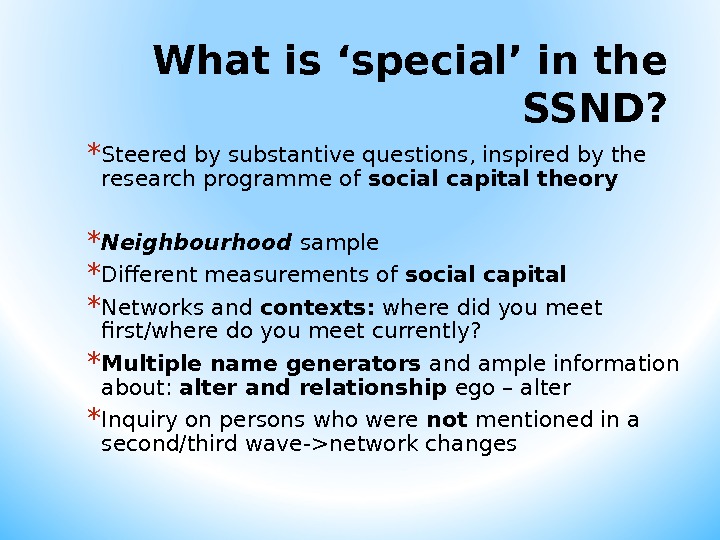
What is ‘ special ’ in the SSND? * Steered by substantive questions, inspired by the research programme of social capital theory * Neighbourhood sample * Different measurements of social capital * Networks and contexts: where did you meet first/where do you meet currently? * Multiple name generators and ample information about: alter and relationship ego – alter * Inquiry on persons who were not mentioned in a second/third wave->network changes
Name generator Position generator Resource generator Community measurements. Measurements of networks and social capital
…. Break…. .
Topics and issues, — afternoon — 1. Theories about urban life and community – on the emergence of social and physical disorder: collective efficacy broken windows 2. Does the internet change our social relationships?
Lost letters in Dutch Neighborhoods. A field experiment on informal control, formal control and collective good production
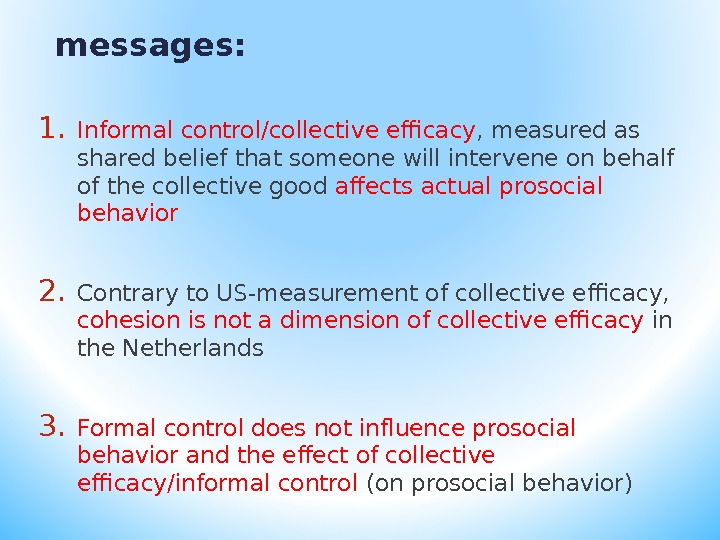
messages: 1. Informal control/collective efficacy , measured as shared belief that someone will intervene on behalf of the collective good affects actual prosocial behavior 2. Contrary to US-measurement of collective efficacy, cohesion is not a dimension of collective efficacy in the Netherlands 3. Formal control does not influence prosocial behavior and the effect of collective efficacy/informal control (on prosocial behavior)
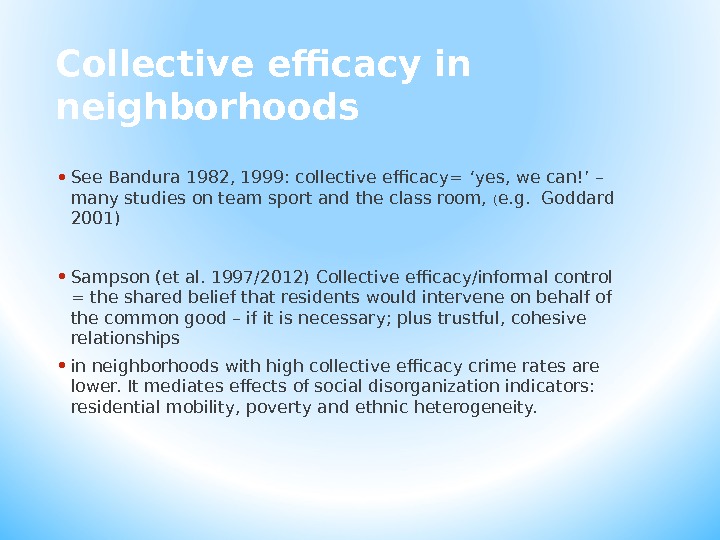
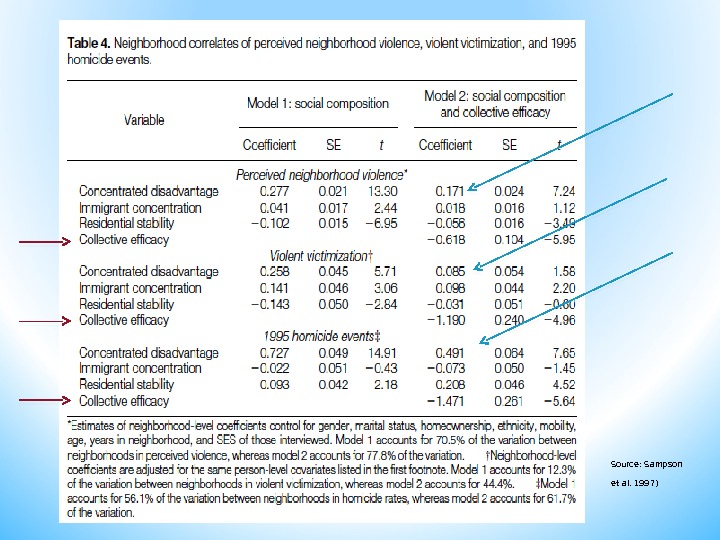
Collective efficacy in neighborhoods • See Bandura 1982, 1999: collective efficacy= ‘ yes, we can! ’ – many studies on team sport and the class room, ( e. g. Goddard 2001) • Sampson (et al. 1997/2012) Collective efficacy/informal control = the shared belief that residents would intervene on behalf of the common good – if it is necessary; plus trustful, cohesive relationships • in neighborhoods with high collective efficacy crime rates are lower. It mediates effects of social disorganization indicators: residential mobility, poverty and ethnic heterogeneity.
Source: Sampson et al. 1997)
This study: collective efficacy, formal control and prosocial behavior • ‘ Collective efficacy ’ has been shown to be an important predictor for low crime rates, but does it also stimulate prosocial action? • Studies on prosocial behavior are usually reports of intentions or reports on actions but not real actions • Considerably less is known about the effects of formal control by institutions or the police
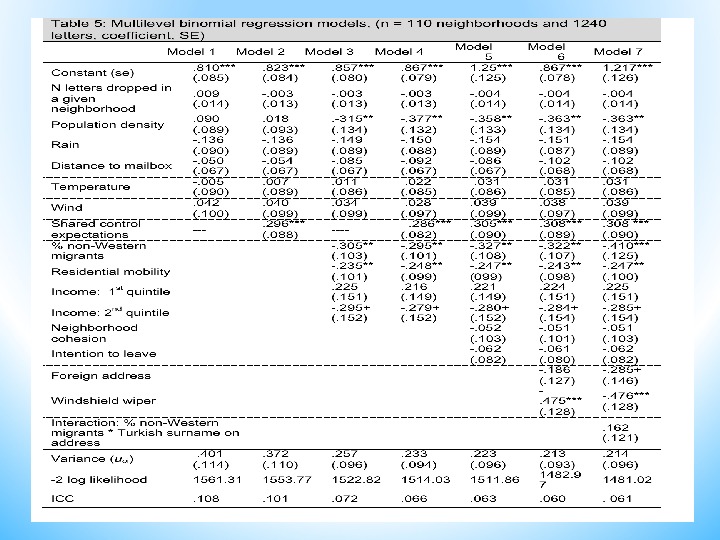
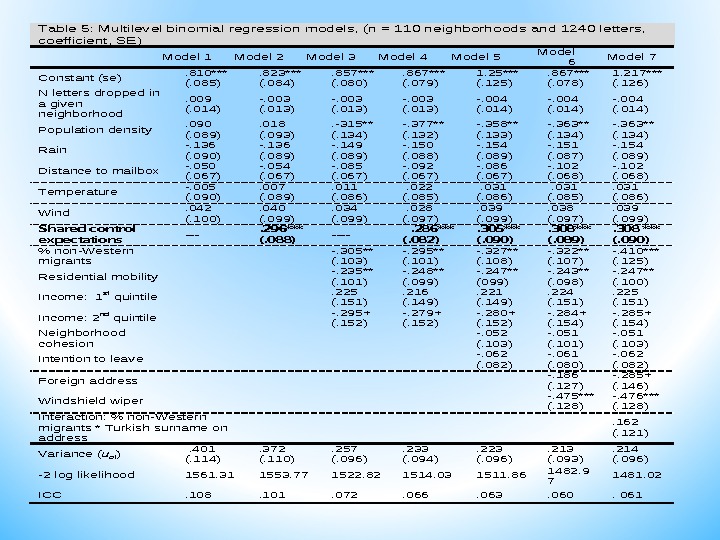
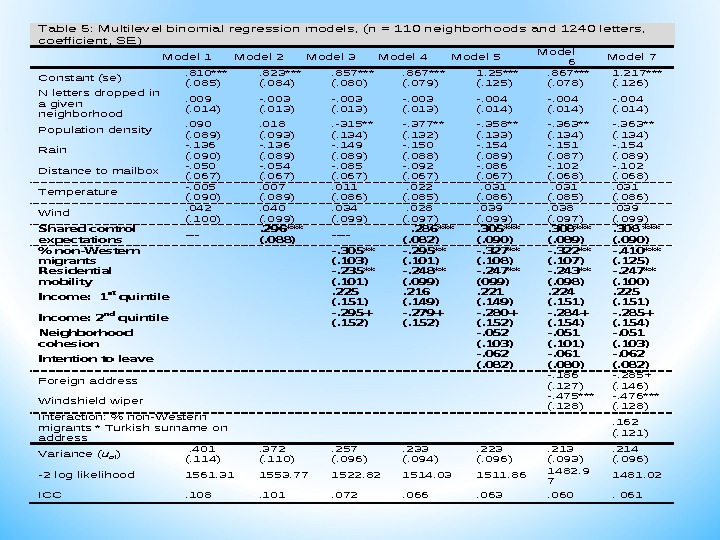
Table 5: Multilevel binomial regression models, (n = 110 neighborhoods and 1240 letters, coefficient, SE) Model 1 Model 2 Model 3 Model 4 Model 5 Model 6 Model 7 Constant (se) . 810*** (. 085) 823*** (. 084) . 857*** (. 080) . 867*** (. 079) 1. 25*** (. 125) . 867*** (. 078) 1. 217*** (. 126) N letters dropped in a given neighborhood . 009 (. 014) -. 003 (. 013) -. 004 (. 014) Population density. 090 (. 089) . 018 (. 093) . -315** (. 134) -. 377** (. 132) -. 358** (. 133) -. 363** (. 134) Rain -. 136 (. 090) -. 136 (. 089) -. 149 (. 089) -. 150 (. 088) -. 154 (. 089) -. 151 (. 087) -. 154 (. 089) Distance to mailbox -. 050 (. 067) -. 054 (. 067) -. 085 (. 067) -. 092 (. 067) -. 086 (. 067) -. 102 (. 068) Temperature -. 005 (. 090) . 007 (. 089) . 011 (. 086) . 022 (. 085) . 031 (. 086) . 031 (. 085) . 031 (. 086) Wind. 042 (. 100) . 040 (. 099) . 034 (. 099) . 028 (. 097) . 039 (. 099) . 038 (. 097) . 039 (. 099) Shared control expectations —. 296*** (. 088) —- . 286*** (. 082) . 305*** (. 090) . 308*** (. 089) . 308 *** (. 090) % non-Western migrants -. 305** (. 103) -. 295** (. 101) -. 327** (. 108) -. 322** (. 107) -. 410*** (. 125) Residential mobility -. 235** (. 101) -. 248** (. 099) -. 247** (099) -. 243** (. 098) -. 247** (. 100) Income: 1 st quintile . 225 (. 151) . 216 (. 149) . 221 (. 149) . 224 (. 151) . 225 (. 151) Income: 2 nd quintile -. 295+ (. 152) -. 279+ (. 152) -. 280+ (. 152) -. 284+ (. 154) -. 285+ (. 154) Neighborhood cohesion -. 052 (. 103) -. 051 (. 101) -. 051 (. 103) Intention to leave -. 062 (. 082) -. 061 (. 080) -. 062 (. 082) Foreign address -. 186 (. 127) -. 285+ (. 146) Windshield wiper -. 475*** (. 128) -. 476*** (. 128) Interaction: % non-Western migrants * Turkish surname on address . 162 (. 121) Variance (uoi). 401 (. 114) . 372 (. 110) . 257 (. 096) , 233 (. 094) 223 (. 096) . 213 (. 093) . 214 (. 096) -2 log likelihood 1561. 31 1553. 77 1522. 82 1514. 03 1511. 86 1482. 97 1481. 02 3 ICC. 108. 101. 072. 066. 063. 060.
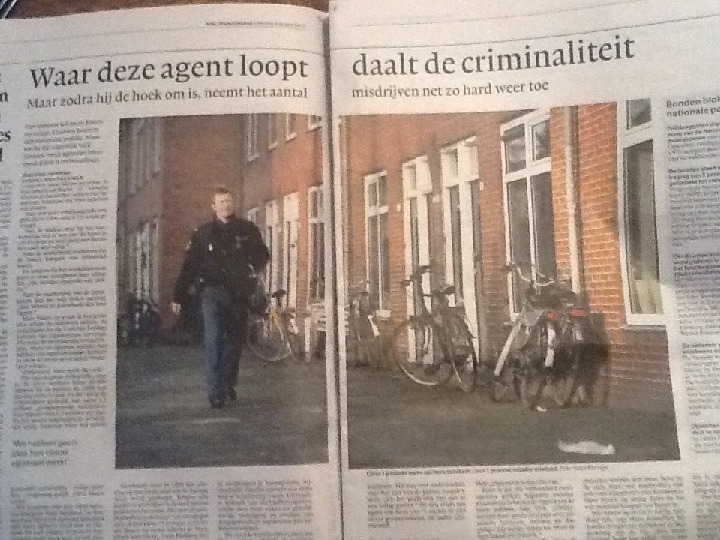
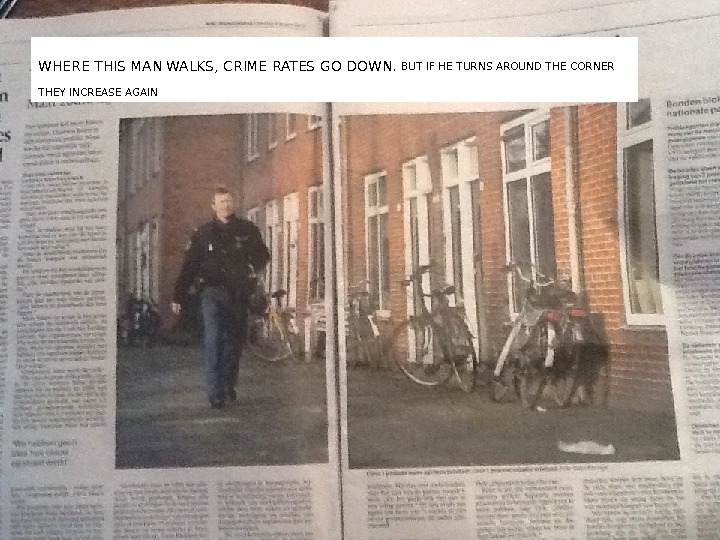
WHERE THIS MAN WALKS, CRIME RATES GO DOWN. BUT IF HE TURNS AROUND THE CORNER THEY INCREASE AGAIN
… two contributions * Studying the influence of neighborhood collective efficacy on prosocial behavior * Studying the influence of formal control, next to collective efficacy on prosocial behavior
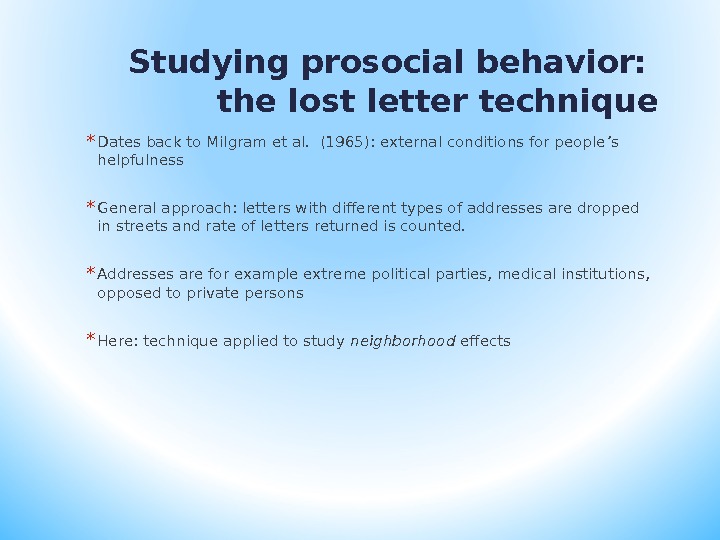
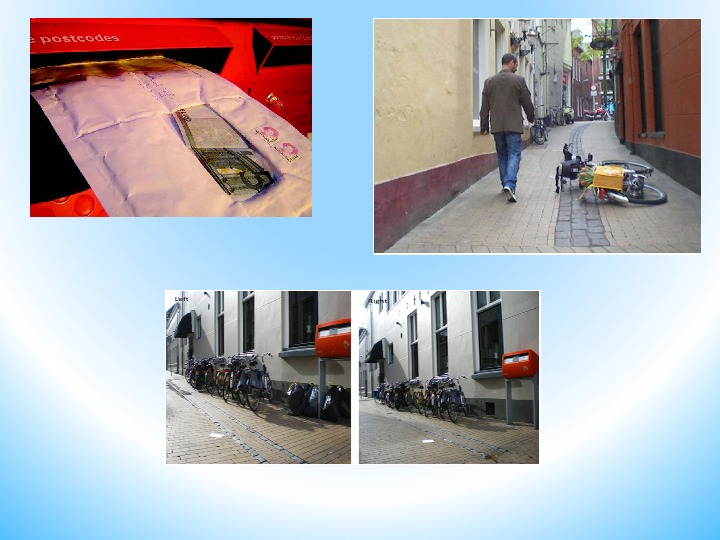
Studying prosocial behavior: the lost letter technique * Dates back to Milgram et al. (1965): external conditions for people ’ s helpfulness * General approach: letters with different types of addresses are dropped in streets and rate of letters returned is counted. * Addresses are for example extreme political parties, medical institutions, opposed to private persons * Here: technique applied to study neighborhood effects
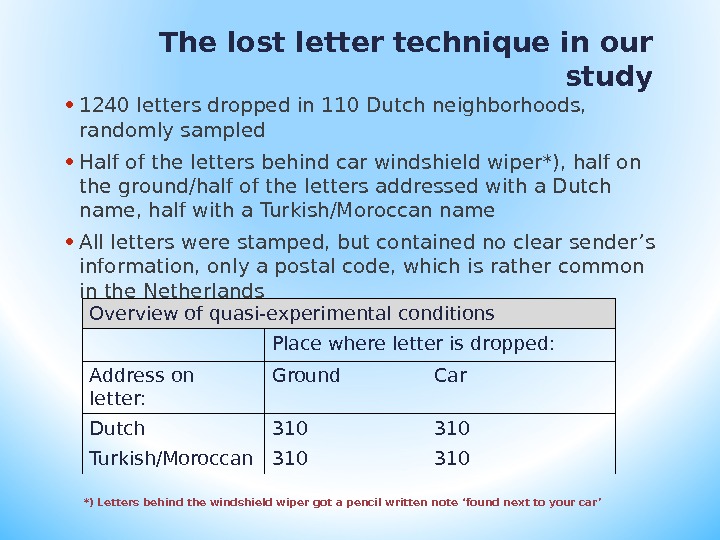
The lost letter technique in our study • 1240 letters dropped in 110 Dutch neighborhoods, randomly sampled • Half of the letters behind car windshield wiper*), half on the ground/half of the letters addressed with a Dutch name, half with a Turkish/Moroccan name • All letters were stamped, but contained no clear sender ’ s information, only a postal code, which is rather common in the Netherlands Overview of quasi-experimental conditions Place where letter is dropped: Address on letter: Ground Car Dutch 310 Turkish/Moroccan 310 *) Letters behind the windshield wiper got a pencil written note ‘ found next to your car ’
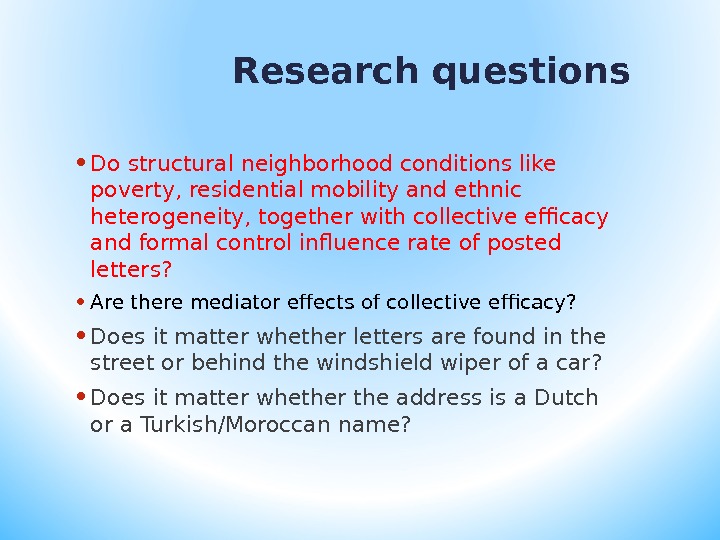
Research questions • Do structural neighborhood conditions like poverty, residential mobility and ethnic heterogeneity, together with collective efficacy and formal control influence rate of posted letters? • Are there mediator effects of collective efficacy? • Does it matter whether letters are found in the street or behind the windshield wiper of a car? • Does it matter whether the address is a Dutch or a Turkish/Moroccan name?
Arguments * Action possibilities for a person finding a letter: * Do nothing * Throw it in a garbage container * Post it Do something for the neigh-borhood ’ s cleanness Do something for an unknown stranger, who presumably lives close by
… and hypotheses (1 a) • = volunteers dilemma (cf. Diekmann 1985). Such a dilemma is solved if an individual maximizes utility under the restriction of Kant ’ s imperative. * we expect that norm activation depends on neighborhood collective efficacy.
… hypotheses (1 b) • In addition: presence of formal control has been shown to affect norm-conform behavior, at least in classrooms (e. g. Junger-Tas 2000, Hirschi 1990) • Hence: expectation is that formal control matters
… hypotheses (2) * Furthermore: residential mobility, ethnic heterogeneity and poverty (cf. Shaw and Mc. Kay, 1942) * High residential mobility: impedes creation of relationships with each other as well as with the neighborhood in general * Ethnic heterogeneity: impedes creation of networks and production of collective goods * Poverty : no resources to produce collective goods; in addition, value of collective goods might be less appreciated because important individual goods are lacking
And hy 3 * Interaction neighborhood composition*adress on letter: in neighborhoods with many foreigners letters with foreign addresses have a higher chance to be posted
Data • Structural neighborhood characteristics: Statistics Netherlands (2007/2008) • Police and safety monitor (2005 -8), information about visibility and functioning of the police in neighborhoods • Information about collective efficacy/informal control: Survey of the Social Networks of the Dutch (SSND, 2008) held among respondents in the selected neighborhoods, n=
The Survey of the Social Networks of the Dutch (SSND) – municipalities where we collected data —
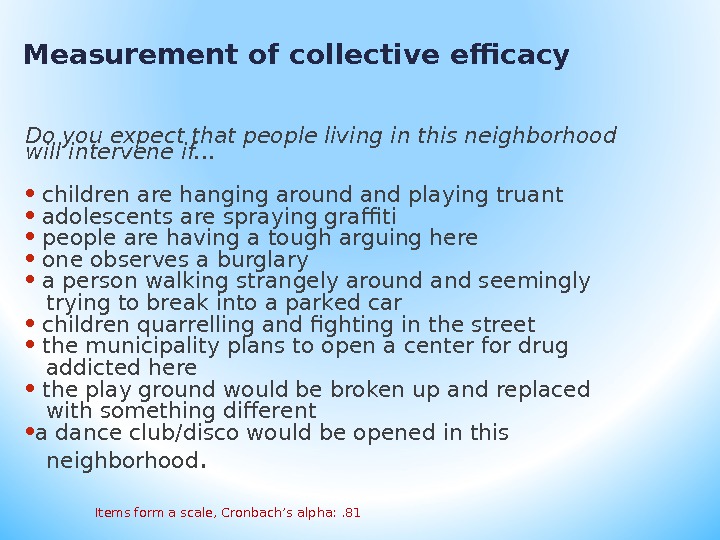
Measurement of collective efficacy Do you expect that people living in this neighborhood will intervene if… • children are hanging around and playing truant • adolescents are spraying graffiti • people are having a tough arguing here • one observes a burglary • a person walking strangely around and seemingly trying to break into a parked car • children quarrelling and fighting in the street • the municipality plans to open a center for drug addicted here • the play ground would be broken up and replaced with something different • a dance club/disco would be opened in this neighborhood. Items form a scale, Cronbach ’ s alpha: .
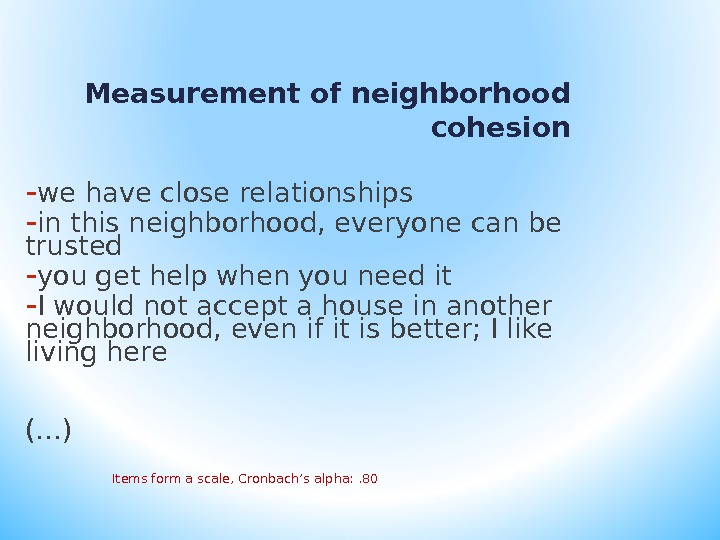
Measurement of neighborhood cohesion — we have close relationships — in this neighborhood, everyone can be trusted — you get help when you need it — I would not accept a house in another neighborhood, even if it is better; I like living here (…) Items form a scale, Cronbach ’ s alpha: .
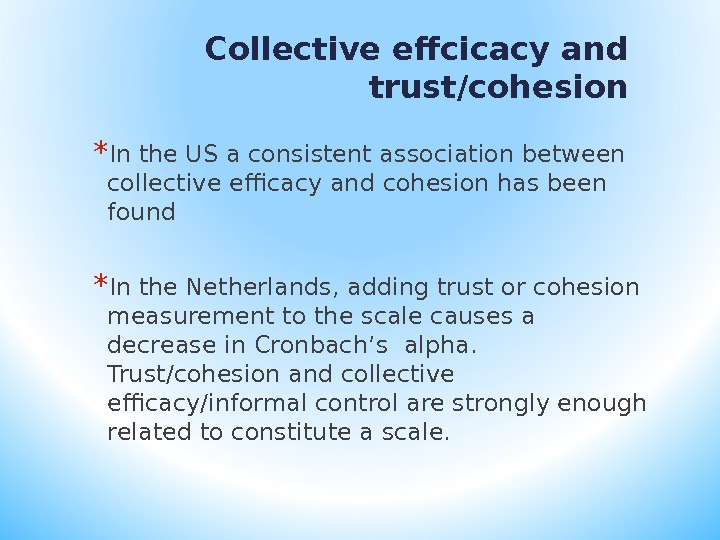
Collective effcicacy and trust/cohesion * In the US a consistent association between collective efficacy and cohesion has been found * In the Netherlands, adding trust or cohesion measurement to the scale causes a decrease in Cronbach ’ s alpha. Trust/cohesion and collective efficacy/informal control are strongly enough related to constitute a scale.
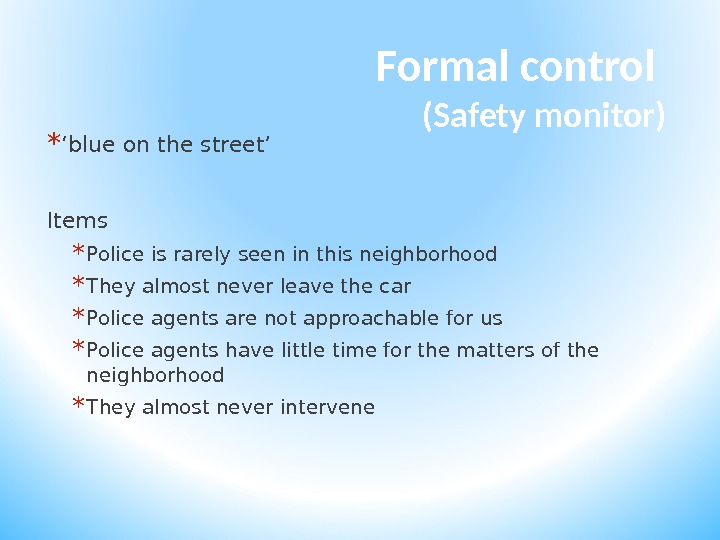
Formal control (Safety monitor) * ‘ blue on the street’ Items * Police is rarely seen in this neighborhood * They almost never leave the car * Police agents are not approachable for us * Police agents have little time for the matters of the neighborhood * They almost never intervene
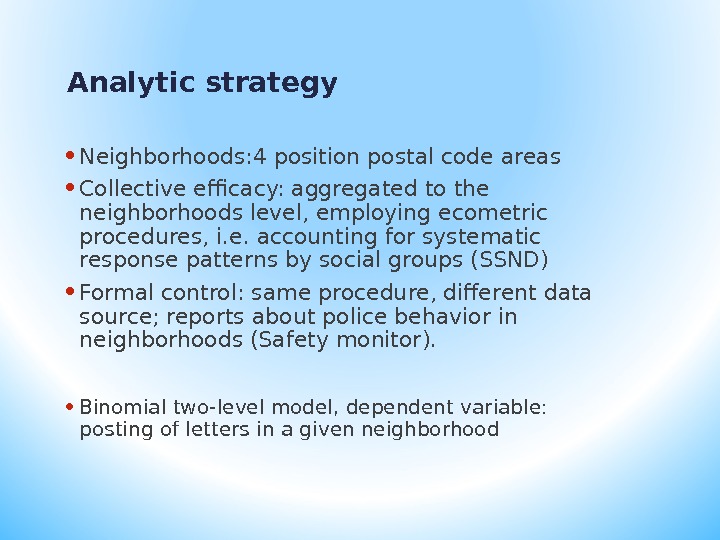
Analytic strategy • Neighborhoods: 4 position postal code areas • Collective efficacy: aggregated to the neighborhoods level, employing ecometric procedures, i. e. accounting for systematic response patterns by social groups (SSND) • Formal control: same procedure, different data source; reports about police behavior in neighborhoods (Safety monitor). • Binomial two-level model, dependent variable: posting of letters in a given neighborhood
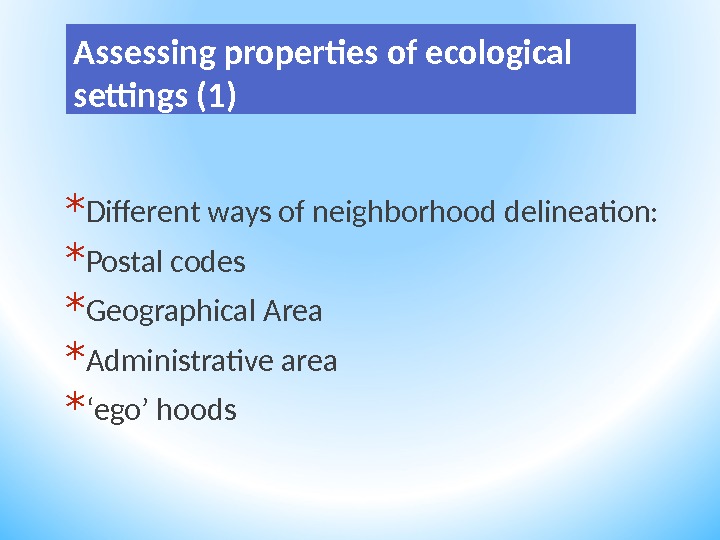
Assessing properties of ecological settings (1) * Different ways of neighborhood delineation: * Postal codes * Geographical Area * Administrative area * ‘ ego’ hoods
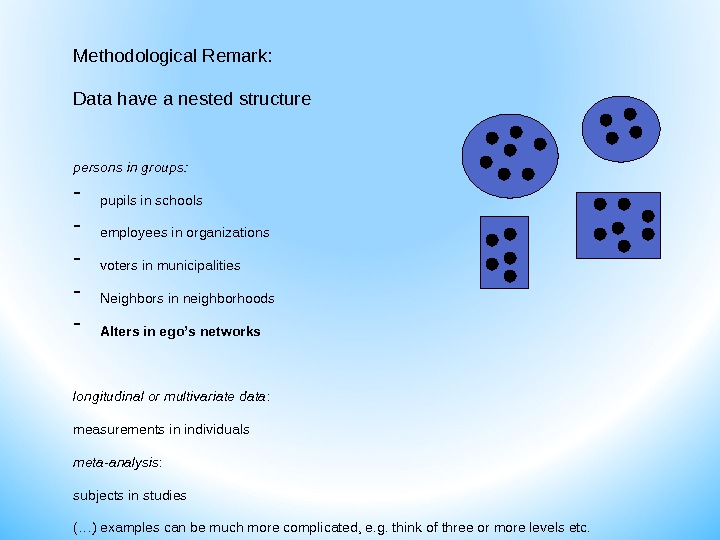
Methodological Remark: Data have a nested structure persons in groups: — pupils in schools — employees in organizations — voters in municipalities — Neighbors in neighborhoods — Alters in ego ’ s networks longitudinal or multivariate data : measurements in individuals meta-analysis : subjects in studies (…) examples can be much more complicated, e. g. think of three or more levels etc.
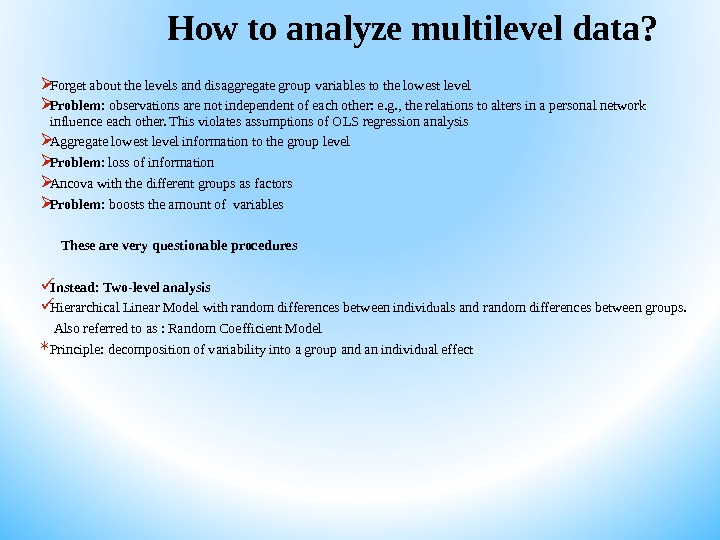
How to analyze multilevel data? Forget about the levels and disaggregate group variables to the lowest level Problem: observations are not independent of each other: e. g. , the relations to alters in a personal network influence each other. This violates assumptions of OLS regression analysis Aggregate lowest level information to the group level Problem : loss of information Ancova with the different groups as factors Problem: boosts the amount of variables These are very questionable procedures Instead: Two-level analysis Hierarchical Linear Model with random differences between individuals and random differences between groups. Also referred to as : Random Coefficient Model * Principle: decomposition of variability into a group and an individual effect
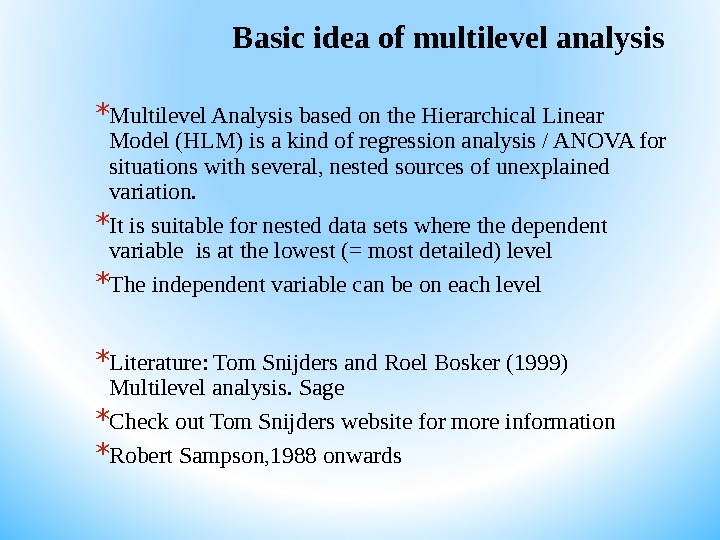
Basic idea of multilevel analysis * Multilevel Analysis based on the Hierarchical Linear Model (HLM) is a kind of regression analysis / ANOVA for situations with several, nested sources of unexplained variation. * It is suitable for nested data sets where the dependent variable is at the lowest (= most detailed) level * The independent variable can be on each level * Literature: Tom Snijders and Roel Bosker (1999) Multilevel analysis. Sage * Check out Tom Snijders website for more information * Robert Sampson, 1988 onwards
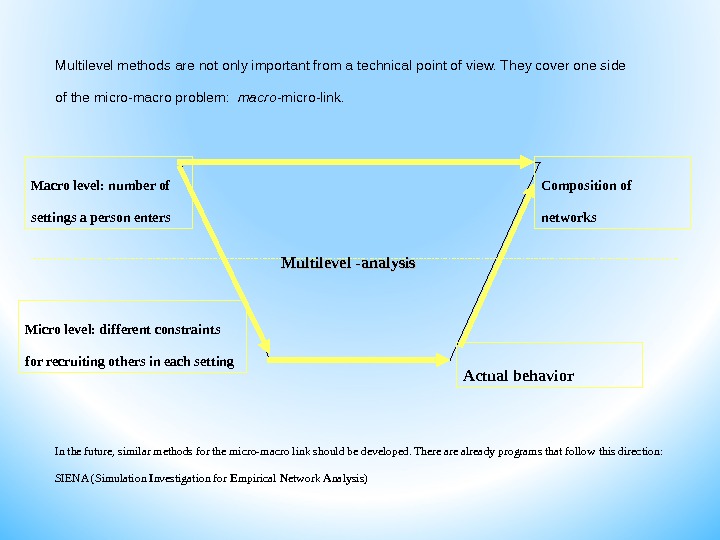
Multilevel methods are not only important from a technical point of view. They cover one side of the micro-macro problem: macro- micro-link. Micro level: different constraints for recruiting others in each setting In the future, similar methods for the micro-macro link should be developed. There already programs that follow this direction: SIENA ( S imulation I nvestigation for E mpirical N etwork A nalysis) Actual behavior Composition of networks. Macro level: number of settings a person enters. Multilevel -analysis
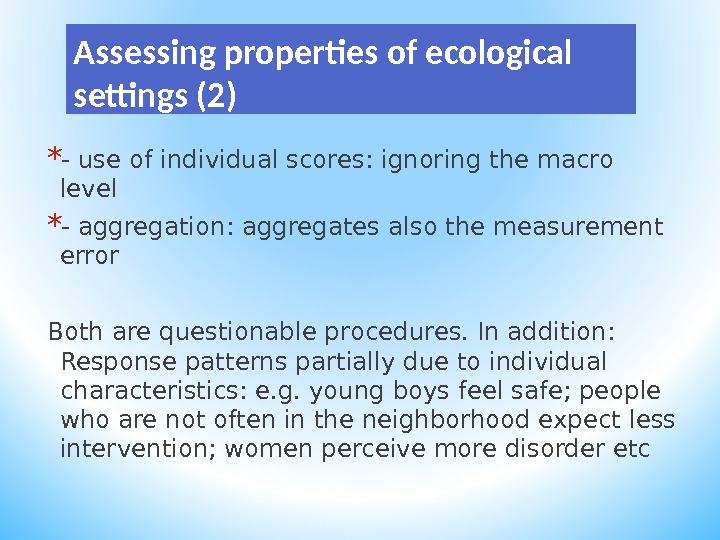
Assessing properties of ecological settings (2) * — use of individual scores: ignoring the macro level * — aggregation: aggregates also the measurement error Both are questionable procedures. In addition: Response patterns partially due to individual characteristics: e. g. young boys feel safe; people who are not often in the neighborhood expect less intervention; women perceive more disorder etc
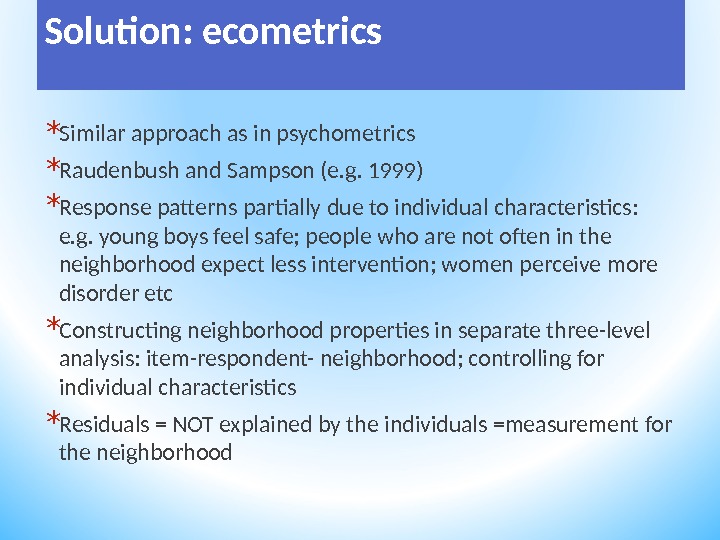
Solution: ecometrics * Similar approach as in psychometrics * Raudenbush and Sampson (e. g. 1999) * Response patterns partially due to individual characteristics: e. g. young boys feel safe; people who are not often in the neighborhood expect less intervention; women perceive more disorder etc * Constructing neighborhood properties in separate three-level analysis: item-respondent- neighborhood; controlling for individual characteristics * Residuals = NOT explained by the individuals =measurement for the neighborhood
Back to the Lost Letters… * Letters dropped in neighborhoods * Different places: car/sidewalk * Different addresses: Dutch/foreign
Ladies and gentlemen…… I take your bid…. Rate of posting: ? ? ?
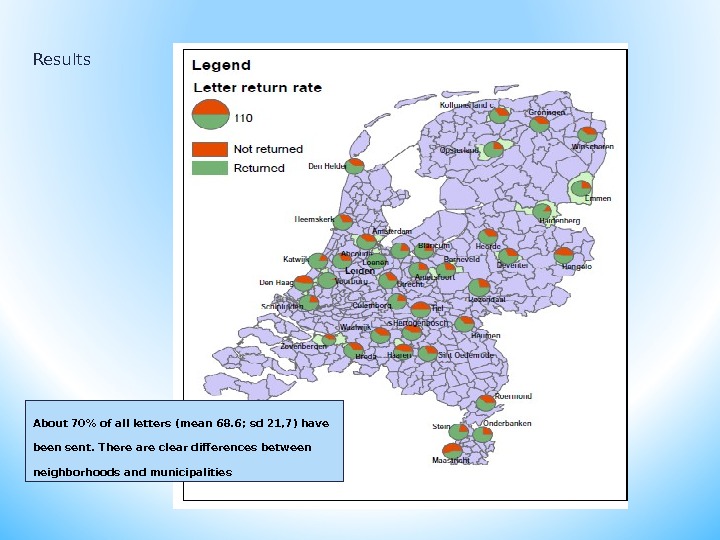
About 70% of all letters (mean 68. 6; sd 21, 7) have been sent. There are clear differences between neighborhoods and municipalities. Results
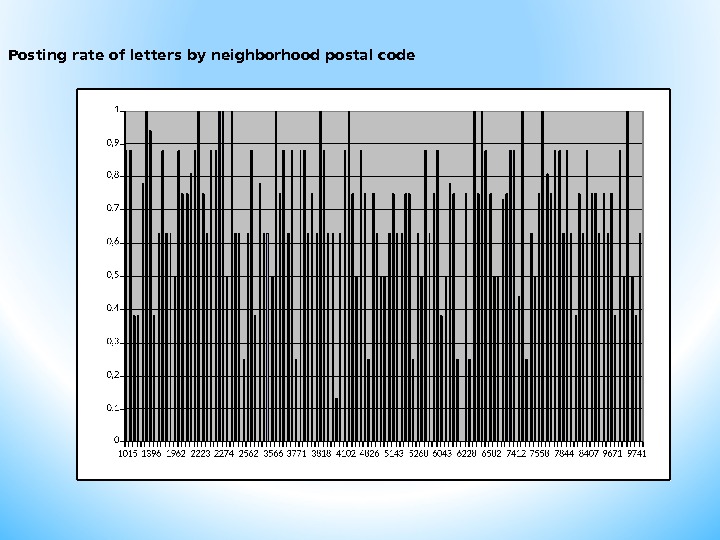
Posting rate of letters by neighborhood postal code
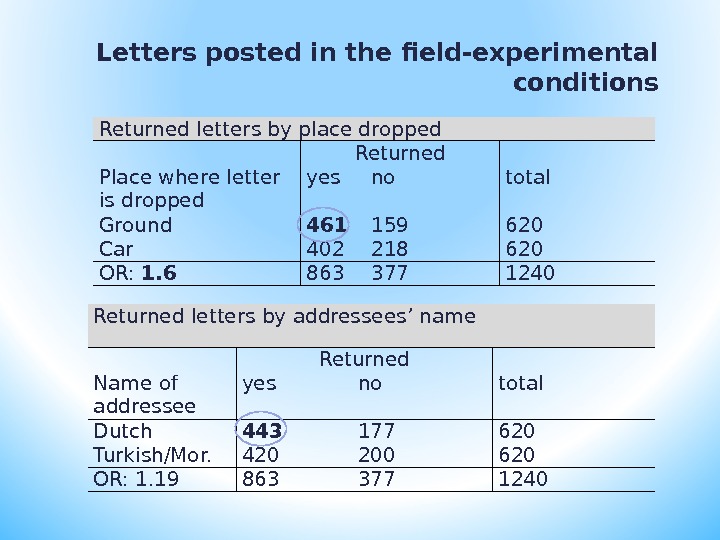
Letters posted in the field-experimental conditions Returned letters by place dropped Returned Place where letter is dropped yes no total Ground 461 159 620 Car 402 218 620 OR: 1. 6 863 377 1240 Returned letters by addressees ’ name Returned Name of addressee yes no total Dutch 443 177 620 Turkish/Mor. 420 200 620 OR: 1.
Table 5: Multilevel binomial regression models, (n = 110 neighborhoods and 1240 letters, coefficient, SE) Model 1 Model 2 Model 3 Model 4 Model 5 Model 6 Model 7 Constant (se). 810*** (. 085) . 823*** (. 084) . 857*** (. 080) . 867*** (. 079) 1. 25*** (. 125) . 867*** (. 078) 1. 217*** (. 126) N letters dropped in a given neighborhood . 009 (. 014) -. 003 (. 013) -. 004 (. 014) Population density. 090 (. 089) . 018 (. 093) . -315** (. 134) -. 377** (. 132) -. 358** (. 133) -. 363** (. 134) Rain -. 136 (. 090) -. 136 (. 089) -. 149 (. 089) -. 150 (. 088) -. 154 (. 089) -. 151 (. 087) -. 154 (. 089) Distance to mailbox -. 050 (. 067) -. 054 (. 067) -. 085 (. 067) -. 092 (. 067) -. 086 (. 067) -. 102 (. 068) Temperature -. 005 (. 090) . 007 (. 089) . 011 (. 086) . 022 (. 085) . 031 (. 086) . 031 (. 085) . 031 (. 086) Wind. 042 (. 100) . 040 (. 099) . 034 (. 099) . 028 (. 097) . 039 (. 099) . 038 (. 097) . 039 (. 099) Shared control expectations —. 296*** (. 088) —- . 286*** (. 082) . 305*** (. 090) . 308*** (. 089) . 308 *** (. 090) % non-Western migrants -. 305** (. 103) -. 295** (. 101) -. 327** (. 108) -. 322** (. 107) -. 410*** (. 125) Residential mobility -. 235** (. 101) -. 248** (. 099) -. 247** (099) -. 243** (. 098) -. 247** (. 100) Income: 1 st quintile . 225 (. 151) . 216 (. 149) . 221 (. 149) . 224 (. 151) . 225 (. 151) Income: 2 nd quintile -. 295+ (. 152) -. 279+ (. 152) -. 280+ (. 152) -. 284+ (. 154) -. 285+ (. 154) Neighborhood cohesion -. 052 (. 103) -. 051 (. 101) -. 051 (. 103) Intention to leave -. 062 (. 082) -. 061 (. 080) -. 062 (. 082) Foreign address -. 186 (. 127) -. 285+ (. 146) Windshield wiper -. 475*** (. 128) -. 476*** (. 128) Interaction: % non-Western migrants * Turkish surname on address . 162 (. 121) Variance (uoi) . 401 (. 114). 372 (. 110). 257 (. 096). 233 (. 094). 223 (. 096). 213 (. 093). 214 (. 096) -2 log likelihood 1561. 31 1553. 77 1522. 82 1514. 03 1511. 86 1482. 97 1481. 02 ICC. 108. 101. 072. 066. 063. 060.
Table 5: Multilevel binomial regression models, (n = 110 neighborhoods and 1240 letters, coefficient, SE) Model 1 Model 2 Model 3 Model 4 Model 5 Model 6 Model 7 Constant (se). 810*** (. 085) . 823*** (. 084) . 857*** (. 080) . 867*** (. 079) 1. 25*** (. 125) . 867*** (. 078) 1. 217*** (. 126) N letters dropped in a given neighborhood . 009 (. 014) -. 003 (. 013) -. 004 (. 014) Population density. 090 (. 089) . 018 (. 093) . -315** (. 134) -. 377** (. 132) -. 358** (. 133) -. 363** (. 134) Rain -. 136 (. 090) -. 136 (. 089) -. 149 (. 089) -. 150 (. 088) -. 154 (. 089) -. 151 (. 087) -. 154 (. 089) Distance to mailbox -. 050 (. 067) -. 054 (. 067) -. 085 (. 067) -. 092 (. 067) -. 086 (. 067) -. 102 (. 068) Temperature -. 005 (. 090) . 007 (. 089) . 011 (. 086) . 022 (. 085) . 031 (. 086) . 031 (. 085) . 031 (. 086) Wind. 042 (. 100) . 040 (. 099) . 034 (. 099) . 028 (. 097) . 039 (. 099) . 038 (. 097) . 039 (. 099) Shared control expectations —. 296*** (. 088) —- . 286*** (. 082) . 305*** (. 090) . 308*** (. 089) . 308 *** (. 090) % non-Western migrants -. 305** (. 103) -. 295** (. 101) -. 327** (. 108) -. 322** (. 107) -. 410*** (. 125) Residential mobility -. 235** (. 101) -. 248** (. 099) -. 247** (099) -. 243** (. 098) -. 247** (. 100) Income: 1 st quintile . 225 (. 151) . 216 (. 149) . 221 (. 149) . 224 (. 151) . 225 (. 151) Income: 2 nd quintile -. 295+ (. 152) -. 279+ (. 152) -. 280+ (. 152) -. 284+ (. 154) -. 285+ (. 154) Neighborhood cohesion -. 052 (. 103) -. 051 (. 101) -. 051 (. 103) Intention to leave -. 062 (. 082) -. 061 (. 080) -. 062 (. 082) Foreign address -. 186 (. 127) -. 285+ (. 146) Windshield wiper -. 475*** (. 128) -. 476*** (. 128) Interaction: % non-Western migrants * Turkish surname on address . 162 (. 121) Variance (uoi) . 401 (. 114). 372 (. 110). 257 (. 096). 233 (. 094). 223 (. 096). 213 (. 093). 214 (. 096) -2 log likelihood 1561. 31 1553. 77 1522. 82 1514. 03 1511. 86 1482. 97 1481. 02 ICC. 108. 101. 072. 066. 063. 060.
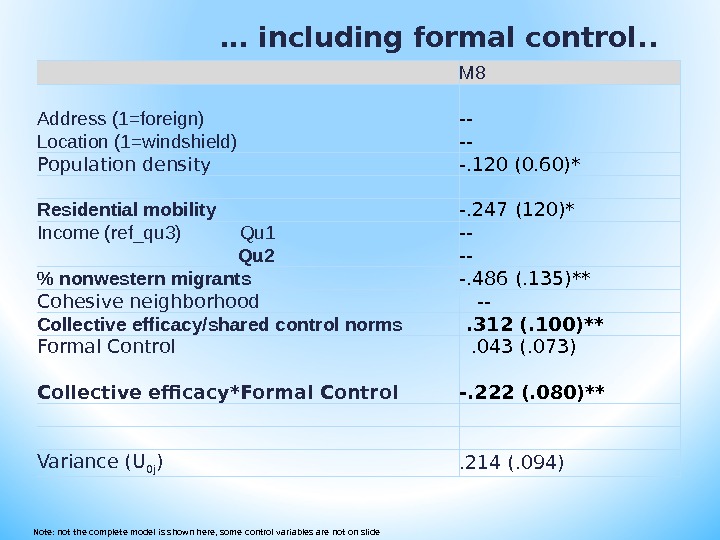
… including formal control. . M 8 Address (1=foreign) — Location (1=windshield) — Population density -. 120 (0. 60)* Residential mobility -. 247 (120)* Income (ref_qu 3) Qu 1 — Qu 2 — % nonwestern migrants -. 486 (. 135)** Cohesive neighborhood — Collective efficacy/shared control norms . 312 (. 100)** Formal Control . 043 (. 073) Collective efficacy*Formal Control -. 222 (. 080)** Variance (U 0 j ). 214 (. 094) Note: not the complete model is shown here, some control variables are not on slide
in addition: * Formal control most clearly affects feelings of safety, but the effect of informal control/shared norms is even stronger here * Formal control affects most clearly occurrence of burglaries * Shared norms influence also degree of littering * Shared norms matter for helping behavior among neighbors, i. e. the belief that you can knock on your neighbors door in case of need * Heterogeneity, poverty and residential mobility negatively influence rate of returned letters
Conclusion • Collective efficacy/shared norms matters for collective good production! … even more than formal control • Neighborhood cohesion not important for posting letters • No independent effect of control by the police
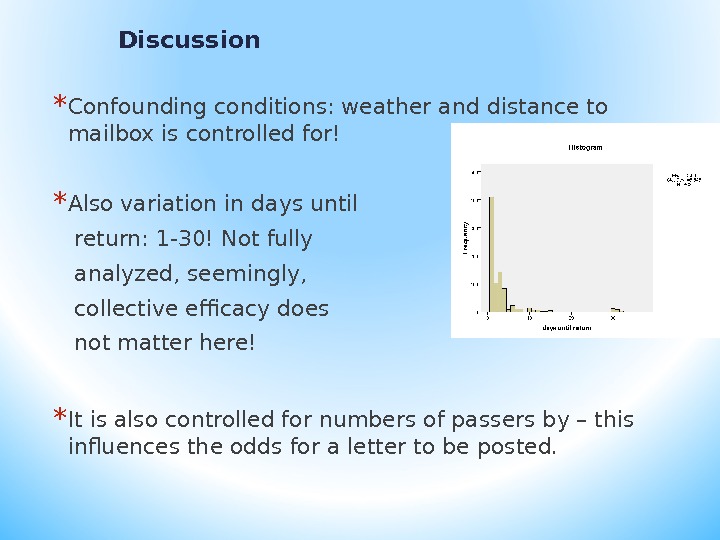
Discussion * Confounding conditions: weather and distance to mailbox is controlled for! * Also variation in days until return: 1 -30! Not fully analyzed, seemingly, collective efficacy does not matter here! * It is also controlled for numbers of passers by – this influences the odds for a letter to be posted.
Topics and issues, — afternoon — 1. Theories about urban life and community – on the emergence of social and physical disorder: collective efficacy broken windows 2. Does the internet change our social relationships?
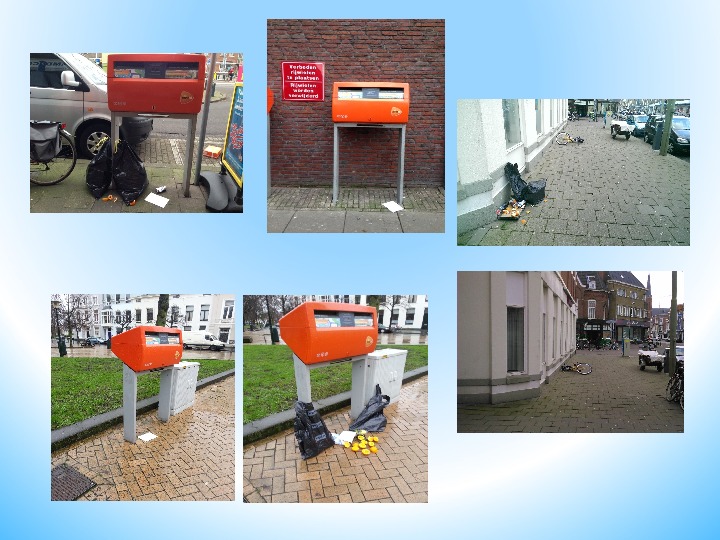
Broken windows theory * Keizer, Lindenberg & Steg (2008/2013)
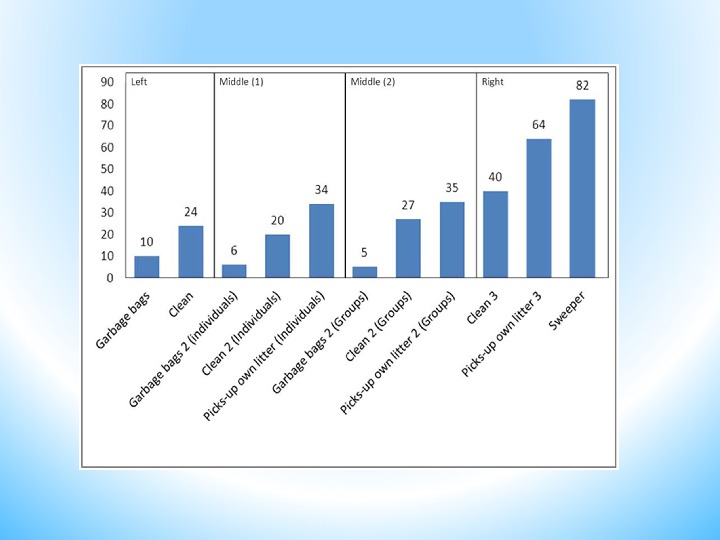
Replication * 28 neighborhoods; appr 4000 observations (70 per condition, at least 2 conditions per experiment) * Neighborhoods: from SSND * Plus: replication in Groningen at the very same location * In addition: respondent characteristics collected
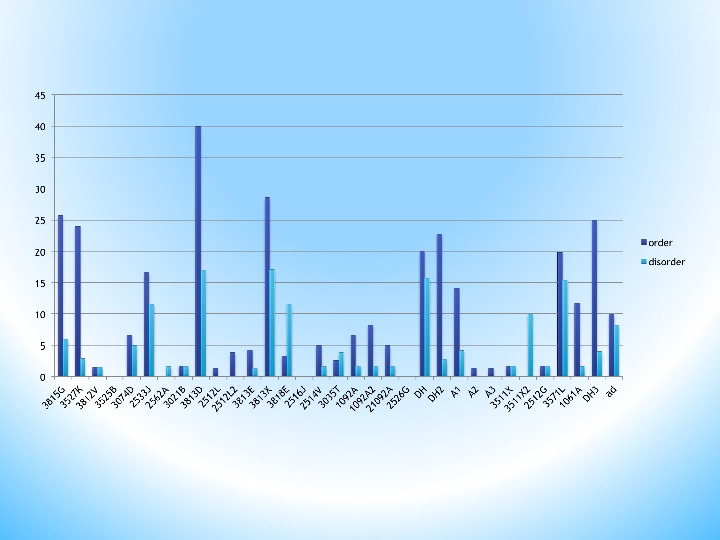
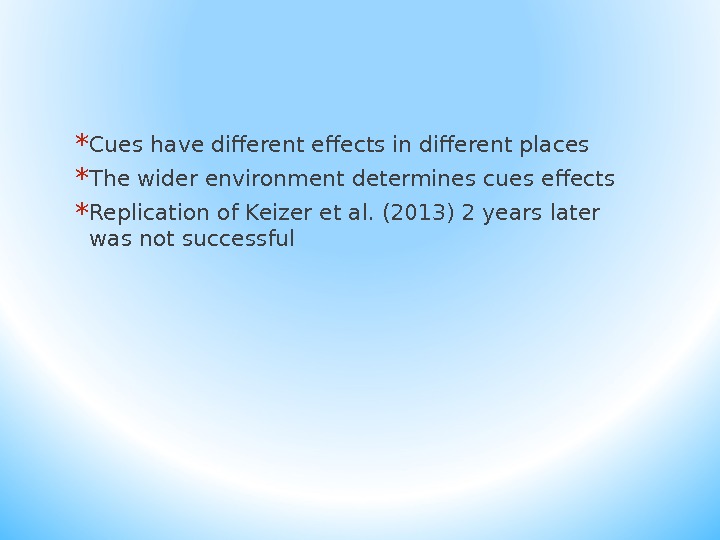
* Cues have different effects in different places * The wider environment determines cues effects * Replication of Keizer et al. (2013) 2 years later was not successful
Topics and issues, — afternoon — 1. Theories about urban life and community – on the emergence of social and physical disorder: collective efficacy broken windows 2. Does the internet change our social relationships?
Introduction to online social networks
Definition of online social networks Web-based services that allow individuals to: — Construct a public or semi-public profile within a bounded system; — Articulate a list of other users with whom they share a connection; — View and traverse their list of connections and those made by others within the system. (Boyd and Ellison, 2007)
Online social networks are everywhere. . .
Information on online social networks • Personal information from profiles, including profile pictures • For each member, a list of friends • Status updates , i. e. , general announcements to (a subset of) other members, including pictures • Reactions to status updates (comments and likes ) • Personal communication (member-to-member, private or public) • Group membership (in Hyves: being member of a group hyve; in Facebook, liking a Facebook page, such as a band or brand page)
Why study online networks? Two types of reasons: — Methodological study old questions in new ways — Substantive study new questions
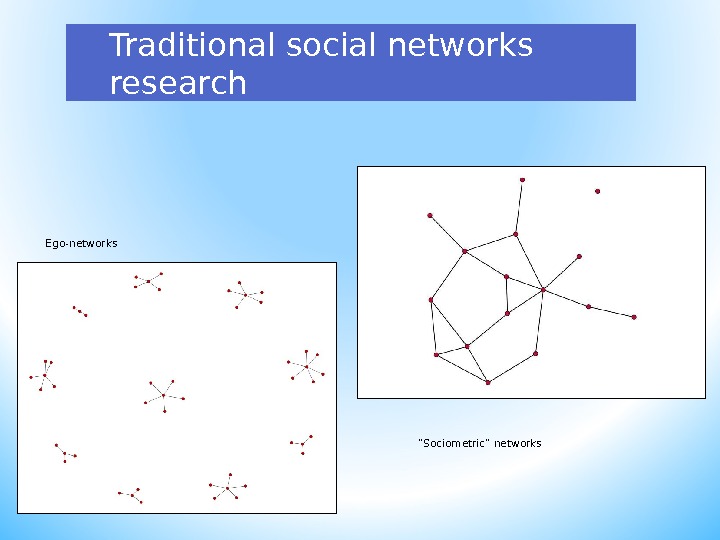
Traditional social networks research Ego-networks “ Sociometric” networks
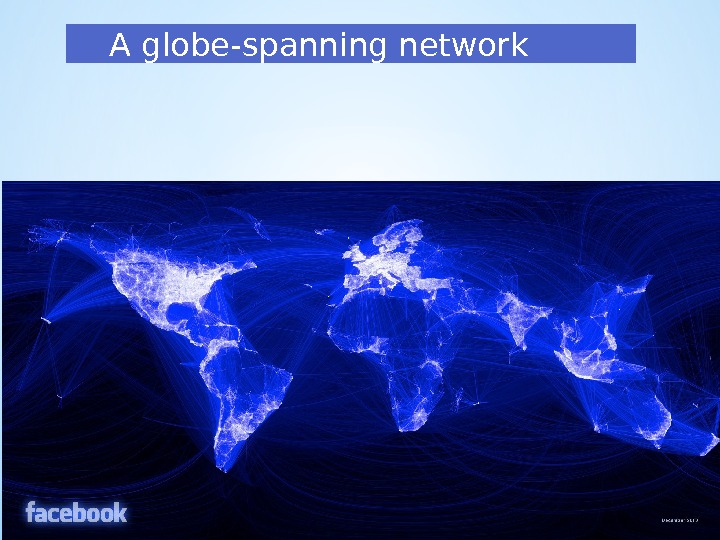
A globe-spanning network 2/24/
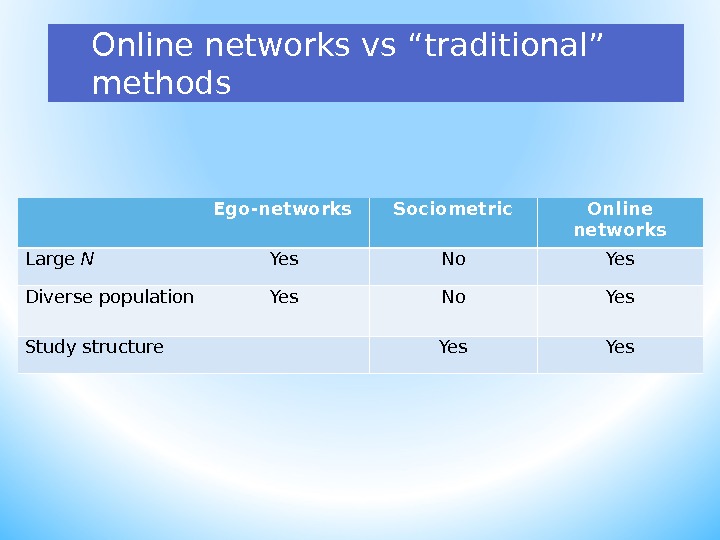
Online networks vs “ traditional ” methods Ego-networks Sociometric Online networks Large N Yes No Yes Diverse population Yes No Yes Study structure Yes
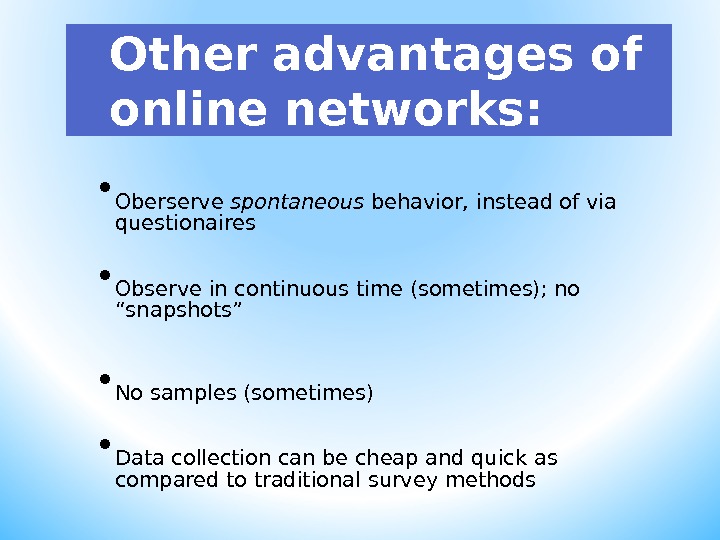
Other advantages of online networks: • Oberserve spontaneous behavior , instead of via questionaires • Observe in continuous time (sometimes); no “snapshots” • No samples (sometimes) • Data collection can be cheap and quick as compared to traditional survey methods
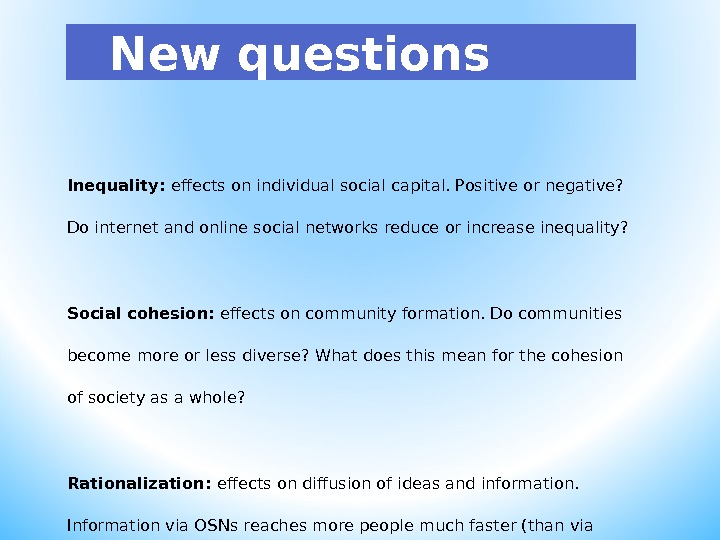
New questions Inequality: effects on individual social capital. Positive or negative? Do internet and online social networks reduce or increase inequality? Social cohesion: effects on community formation. Do communities become more or less diverse? What does this mean for the cohesion of society as a whole? Rationalization: effects on diffusion of ideas and information. Information via OSNs reaches more people much faster (than via offline networks). Implications for science, politics, social movements, etc.
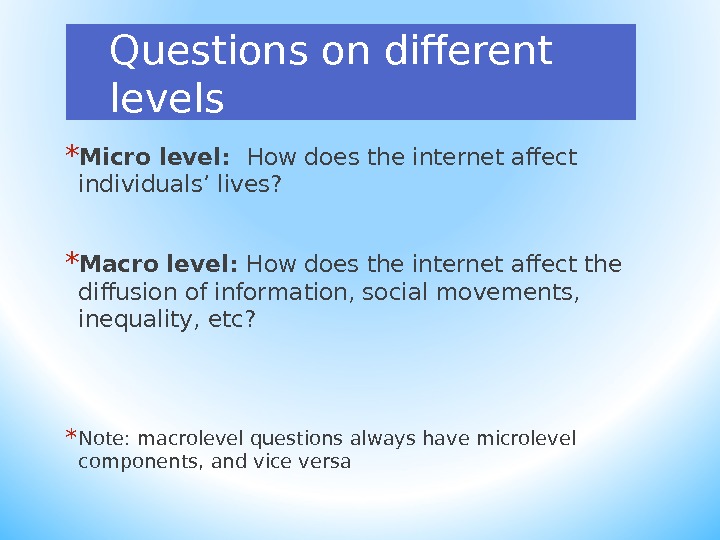
Questions on different levels * Micro level: How does the internet affect individuals ’ lives? * Macro level: How does the internet affect the diffusion of information, social movements, inequality, etc? * Note: macrolevel questions always have microlevel components, and vice versa
Online networks research in practice
example of a microlevel question Does the internet make us lonely?
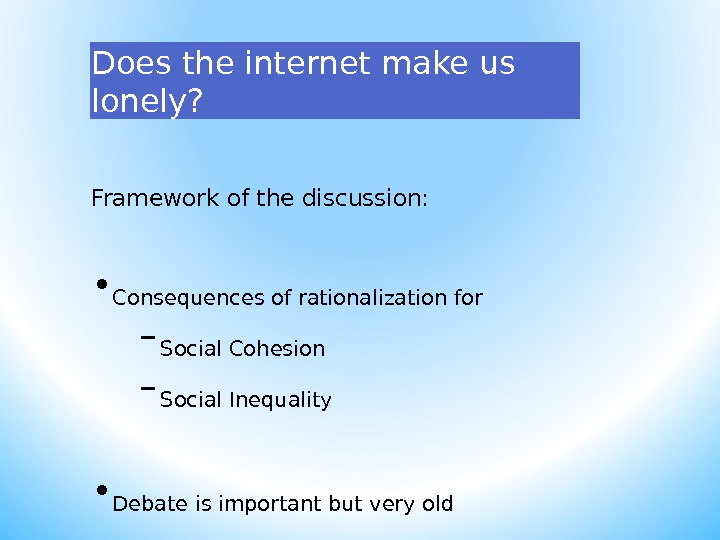
Does the internet make us lonely? Framework of the discussion: • Consequences of rationalization for – Social Cohesion – Social Inequality • Debate is important but very old
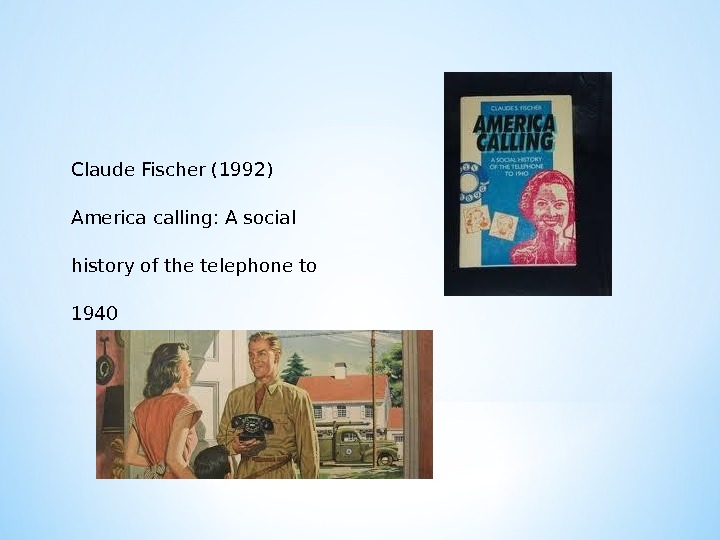
Claude Fischer (1992) America calling: A social history of the telephone to
Loneliness on facebook? Facebook shows what others are doing: -Also that they have fun without you…. -You see that your friends have many friends…
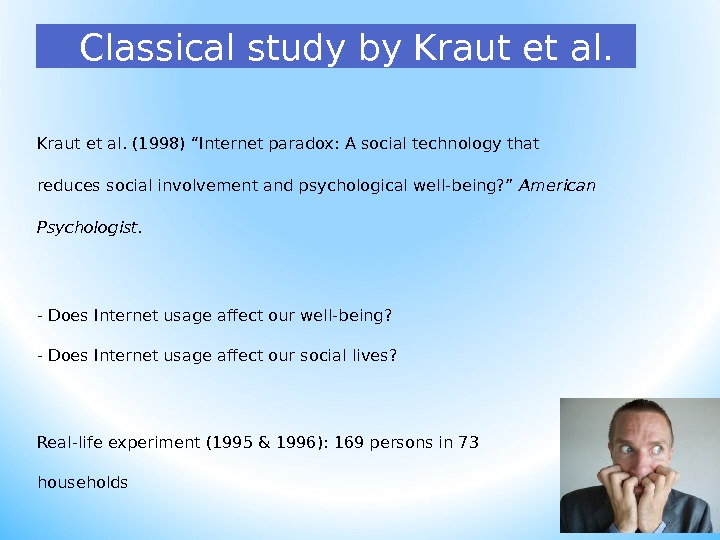
26 Classical study by Kraut et al. (1998) “Internet paradox: A social technology that reduces social involvement and psychological well-being? ” American Psychologist. — Does Internet usage affect our well-being? — Does Internet usage affect our social lives? Real-life experiment (1995 & 1996): 169 persons in 73 households
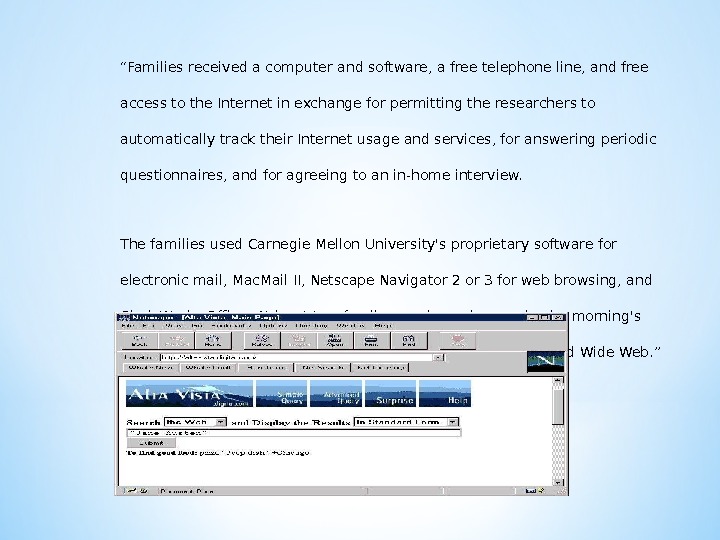
“ Families received a computer and software, a free telephone line, and free access to the Inter net in exchange for permitting the researchers to automatically track their Internet usage and services, for answering periodic questionnaires, and for agreeing to an in-home interview. The families used Carnegie Mellon University’s proprietary software for electronic mail, Mac. Mail II, Netscape Navigator 2 or 3 for web browsing, and Claris. Works Office. At least two family members also received a morning’s training in th use of the computer, electronic mail, and the World Wide Web. ”
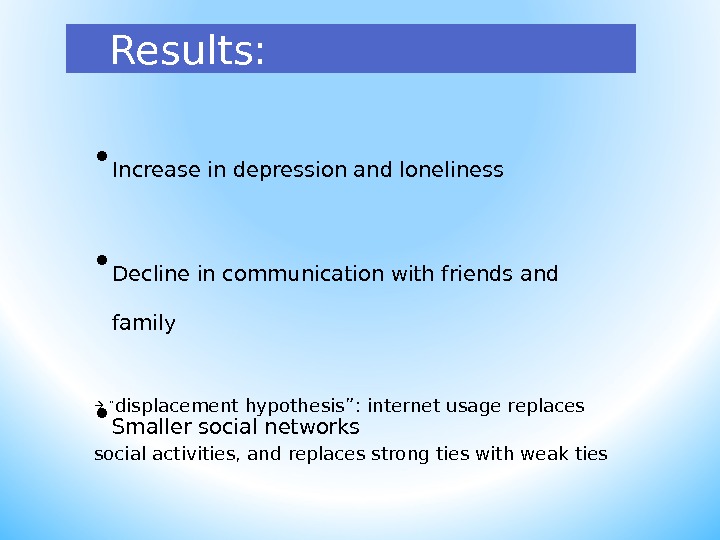
Results: • Increase in depression and loneliness • Decline in communication with friends and family • Smaller social networks “ displacement hypothesis”: internet usage replaces social activities, and replaces strong ties with weak ties
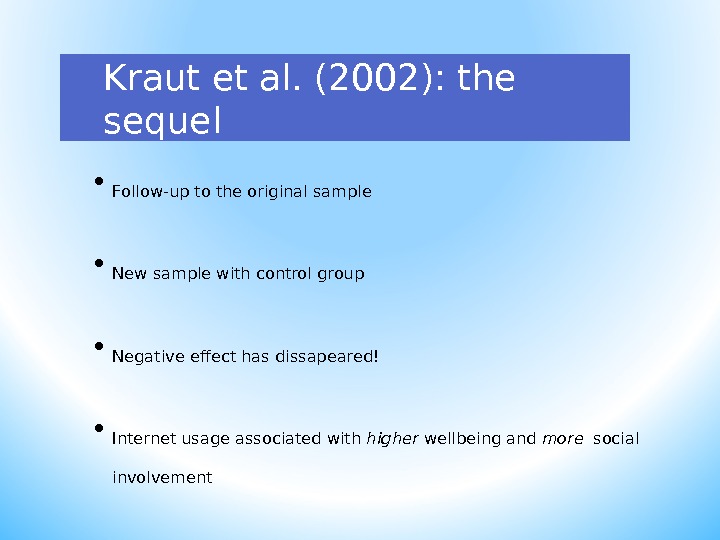
Kraut et al. (2002): the sequel • Follow-up to the original sample • New sample with control group • Negative effect has dissapeared! • Internet usage associated with higher wellbeing and more social involvement
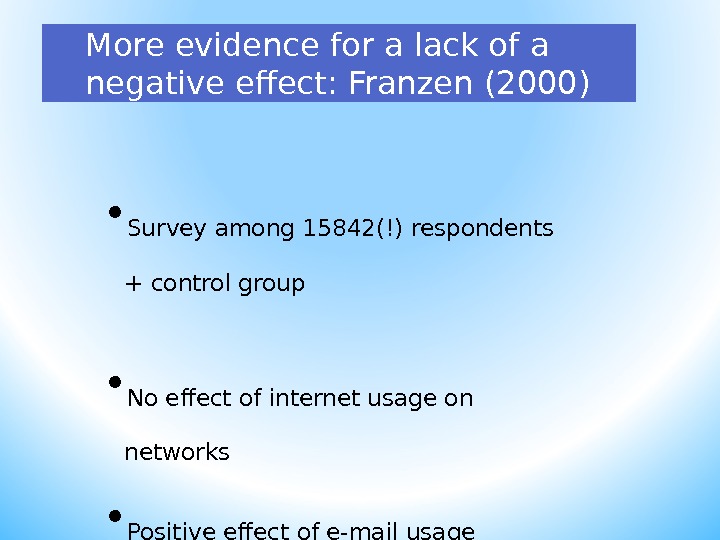
More evidence for a lack of a negative effect: Franzen (2000) • Survey among 15842(!) respondents + control group • No effect of internet usage on networks • Positive effect of e-mail usage
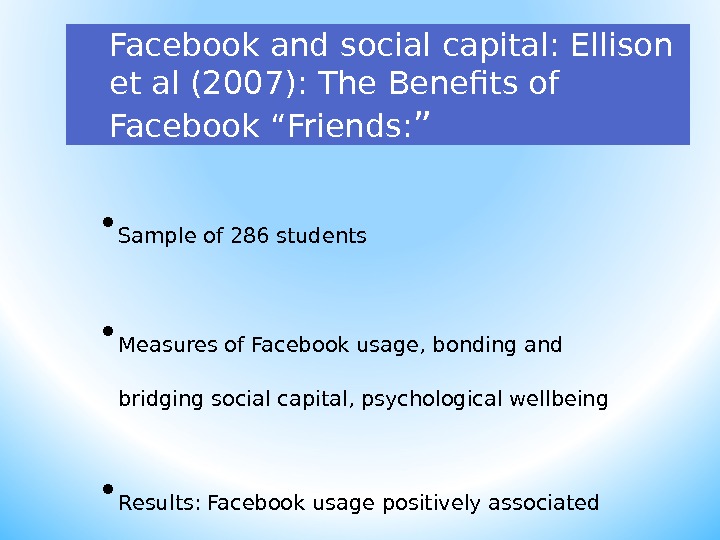
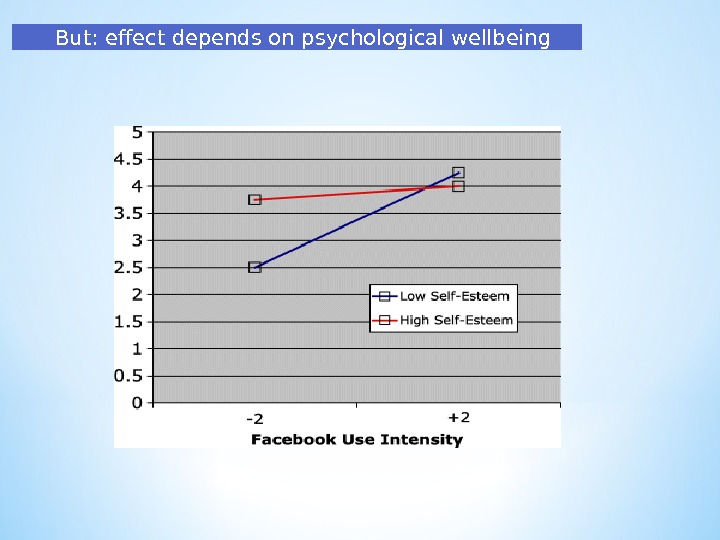
Facebook and social capital: Ellison et al (2007): The Benefits of Facebook “ Friends: ” • Sample of 286 students • Measures of Facebook usage, bonding and bridging social capital, psychological wellbeing • Results: Facebook usage positively associated with social capital, especially bridging social capital
But: effect depends on psychological wellbeing
Recent meta-analysis over question on causality: Song et al. (2014) Does Facebook make us lonely? – A metaanalysis. Computers in Human Behavior, 36: 446 -452 Result : association between loneliness and facebook use However: in particular those who need support and feel lonely use facebook!
So, does internet make us lonel y ? • Debate on internet and loneliness echoes old debates about technology and society • Internet effects as a “ moving target” • Importance of continued research • Much research based on small samples and traditional research methods (surveys)
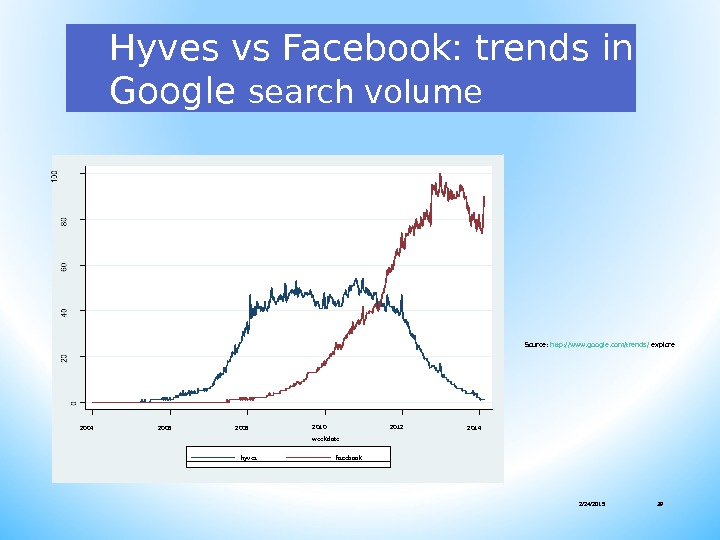
Example of large online networks research: Hyves • Hyves: Facebook-like Dutch online network platform. Highly popular until +/- 2010, now outcompeted by Facebook • Data collection: access via service provider (Hyves. nl), in 2010 • Data: Snapshot of the network, N≈ 10, 000 All (anonymous) individual profiles and “friendship” links between profiles Demographic information from profiles: gender, age, place of residence
Hyves vs Facebook: trends in Google search volume 2/24/2015 392004 2006 2008 2010 2012 weekdate 2014 hyves facebook Source: http: //www. google. com/trends/ explore
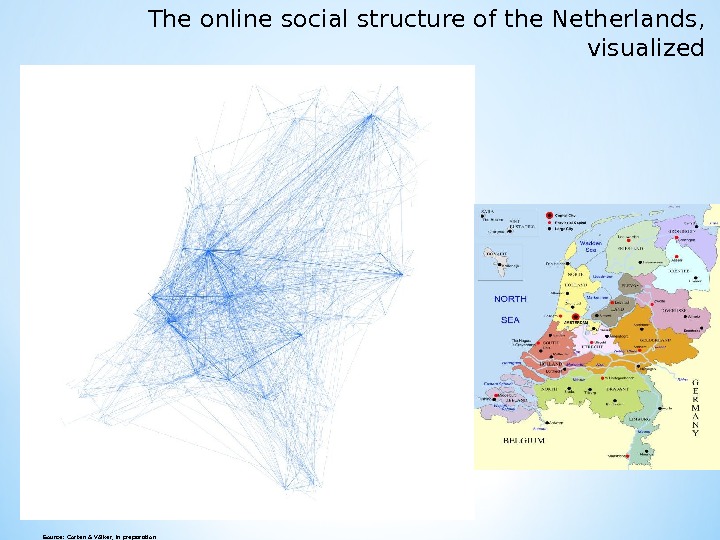
The online social structure of the Netherlands, visualized 2/24/201 5 Source: Corten & Völker, in preparation
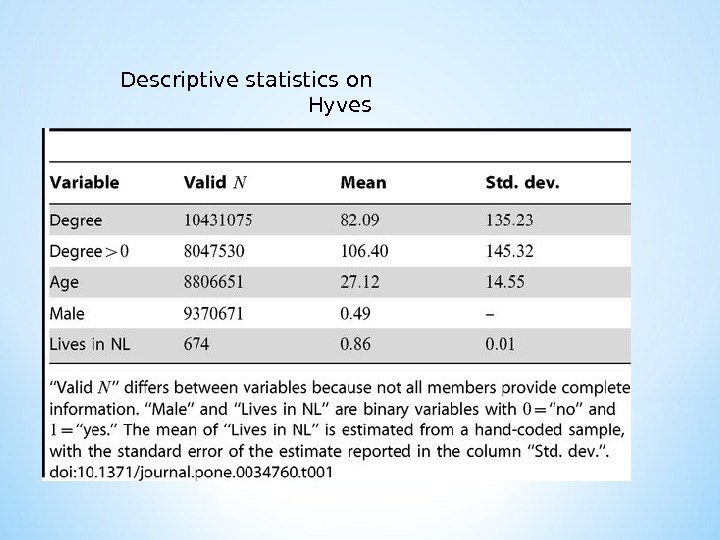
Descriptive statistics on Hyves
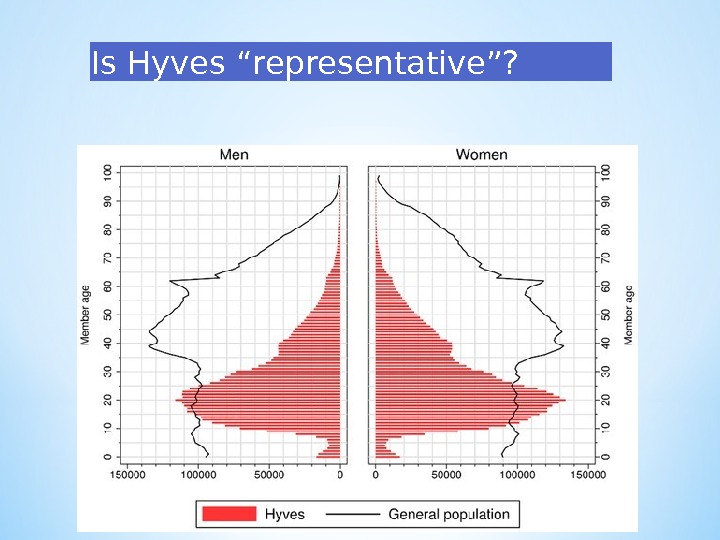
Is Hyves “ representative ”?
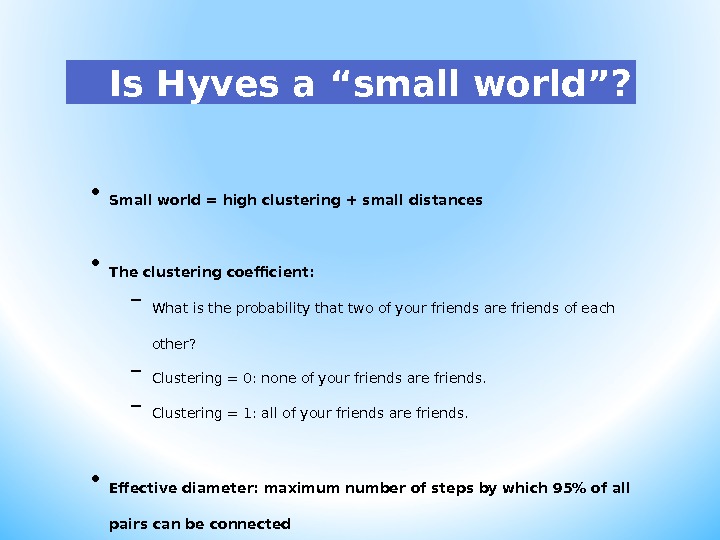
Is Hyves a “ small world ” ? • Small world = high clustering + small distances • The clustering coefficient: – What is the probability that two of your friends are friends of each other? – Clustering = 0: none of your friends are friends. – Clustering = 1: all of your friends are friends. • Effective diameter: maximum number of steps by which 95% of all pairs can be connected • If small world: clustering relatively large, diameter relatively small
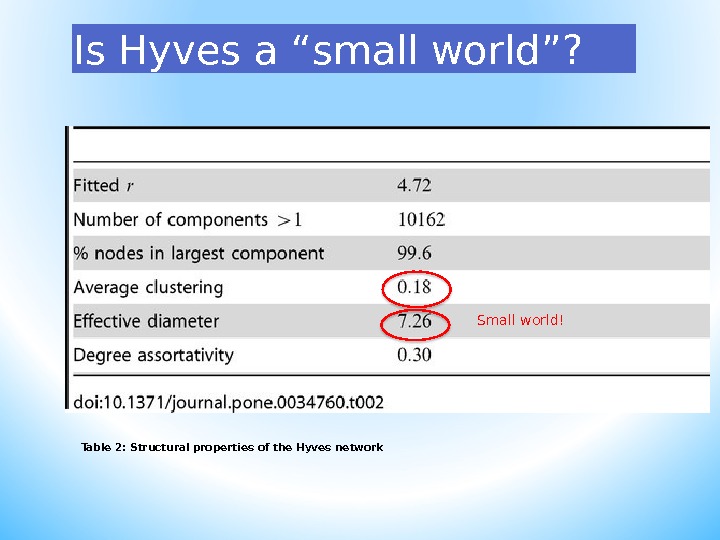
Is Hyves a “ small world ” ? Table 2: Structural properties of the Hyves network Small world!
Some conclusions on Hyves is not representative, but almost the entire young population of the Netherlands is (was) covered Hyves is a small world. Information will spread quickly! Hyves and Facebook have similar structures. Are the same mechanisms driving the evolution of the network? Focus=local!
Ways to collect online network data • Public download (Twitter!) • Surveys • Automated web “ scraping ” • Download profiles from a fixed population • Arrange direct access to data via service provider • Online experiments
Problems in online networks research • Most data are the property of large companies • Collecting and analyzing extremely large datasets is difficult. Social scientists need to learn some skills from computer science. • Ethical problems of collecting data. Is it OK to use “public” data for research? Is it OK to use anonymized private data for research? • Online social networks are a “moving target” (case in point: Hyves) • Online data sometimes hard to interpret. Do participants provide truthful information? How active are participants? • What is the link between online networks and offline networks and behavior? many new research questions!
Concluding remarks Prediction: within 10 years, the majority of empirical sociology will be using data on online behavior Sociologists need to develop new skills. Every research- oriented student should learn how to program We know very little about the mechanisms behind large online networks. Lots of open research questions! Network studies will stay!
THANKS!!!! b. volker@uva. nl