
Презентация princ-ch04-presentation


- Размер: 2 Mегабайта
- Количество слайдов: 63
Описание презентации Презентация princ-ch04-presentation по слайдам
© 2009 South-Western, a part of Cengage Learning, all rights reserved. C H A P T E R The Market Forces of Supply and Demand E conomics P R I N C I P L E S O F N. Gregory Mankiw Premium Power. Point Slides by Ron Cronovich
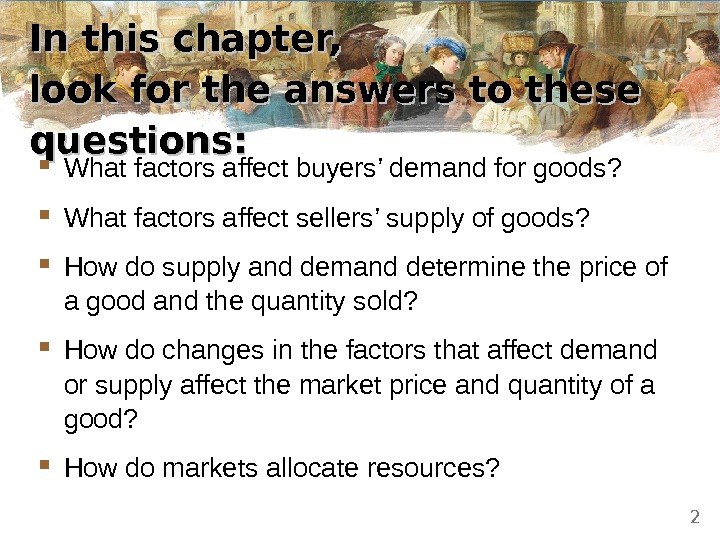
In this chapter, look for the answers to these questions: What factors affect buyers’ demand for goods? What factors affect sellers’ supply of goods? How do supply and demand determine the price of a good and the quantity sold? How do changes in the factors that affect demand or supply affect the market price and quantity of a good? How do markets allocate resources?
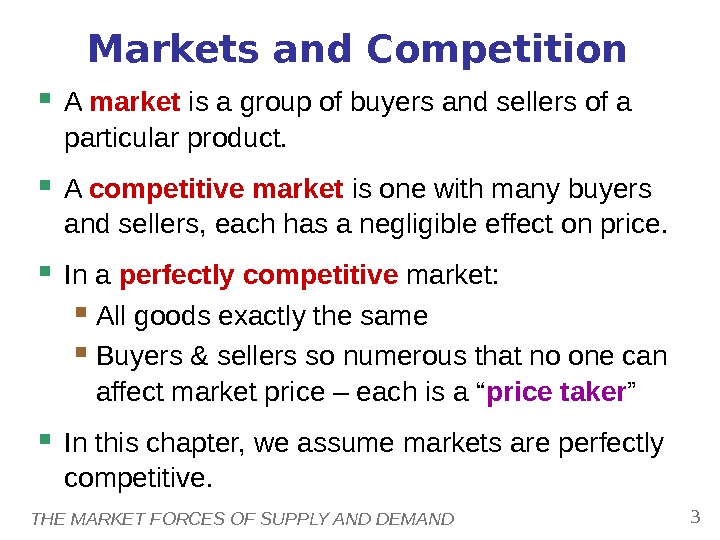
THE MARKET FORCES OF SUPPLY AND DEMAND 3 Markets and Competition A market is a group of buyers and sellers of a particular product. A competitive market is one with many buyers and sellers, each has a negligible effect on price. In a perfectly competitive market: All goods exactly the same Buyers & sellers so numerous that no one can affect market price – each is a “ price taker ” In this chapter, we assume markets are perfectly competitive.
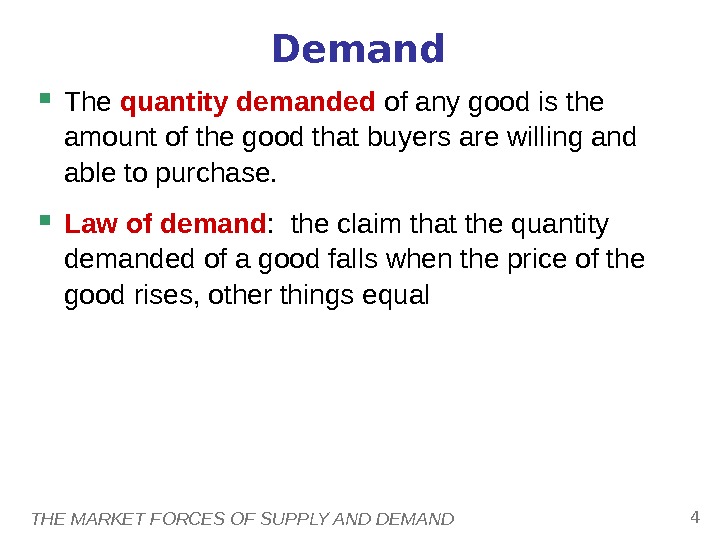
THE MARKET FORCES OF SUPPLY AND DEMAND 4 Demand The quantity demanded of any good is the amount of the good that buyers are willing and able to purchase. Law of demand : the claim that the quantity demanded of a good falls when the price of the good rises, other things equal
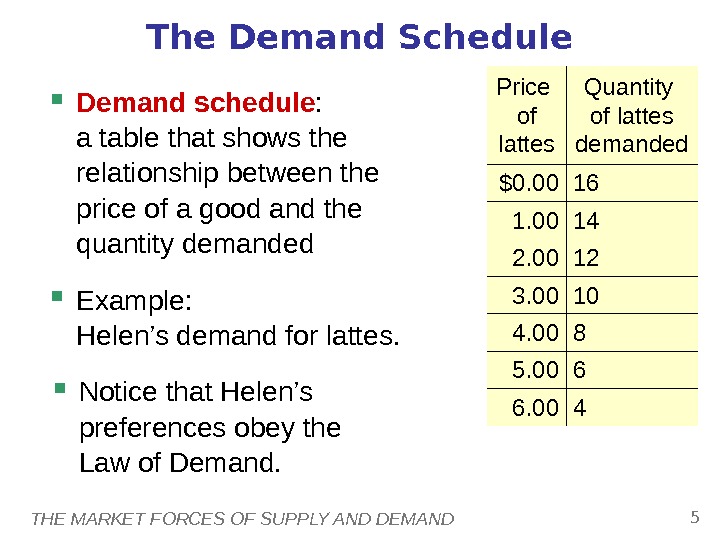
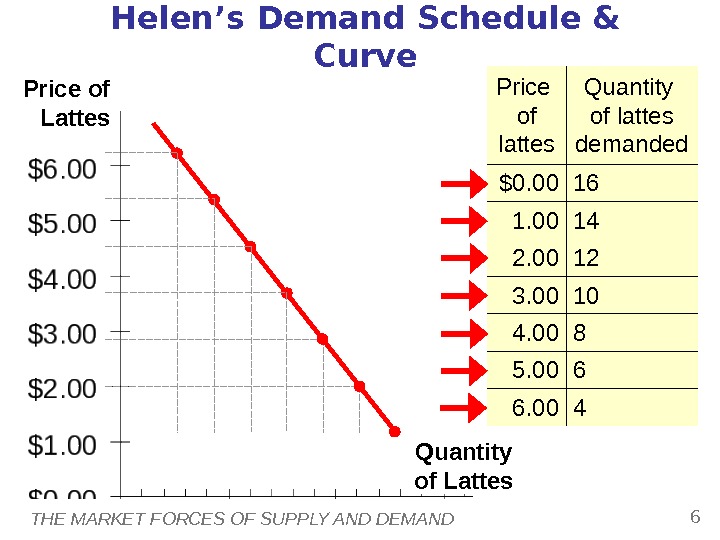
THE MARKET FORCES OF SUPPLY AND DEMAND 5 The Demand Schedule Demand schedule : a table that shows the relationship between the price of a good and the quantity demanded Example: Helen’s demand for lattes. Price of lattes Quantity of lattes demanded $0. 00 16 1. 00 14 2. 00 12 3. 00 10 4. 00 8 5. 00 6 6. 00 4 Notice that Helen’s preferences obey the Law of Demand.
THE MARKET FORCES OF SUPPLY AND DEMAND 6 Price of Lattes Quantity of Lattes. Helen’s Demand Schedule & Curve Price of lattes Quantity of lattes demanded $0. 00 16 1. 00 14 2. 00 12 3. 00 10 4. 00 8 5. 00 6 6.
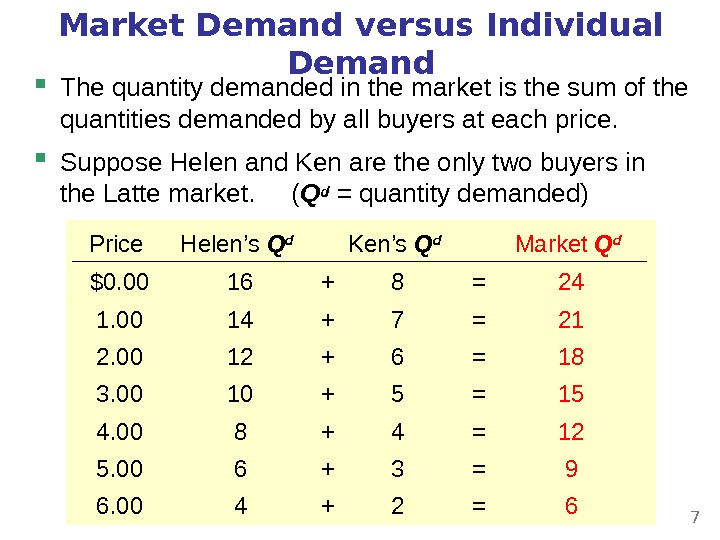
Market Demand versus Individual Demand The quantity demanded in the market is the sum of the quantities demanded by all buyers at each price. Suppose Helen and Ken are the only two buyers in the Latte market. ( Qd = quantity demanded) 46810 1214 16 Helen’s Q d 234 5678 Ken’s Q d ++++ ==== 691215+ = 18+ = 21+ = 24 Market Q d $0. 00 6. 005. 004. 003. 00 2. 001. 00 Price
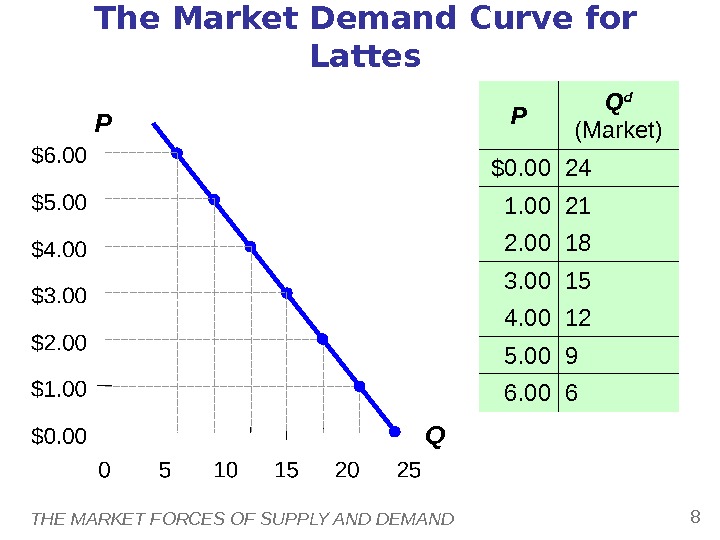
THE MARKET FORCES OF SUPPLY AND DEMAND 8 P QThe Market Demand Curve for Lattes P Q d (Market) $0. 00 24 1. 00 21 2. 00 18 3. 00 15 4. 00 12 5. 00 9 6.
THE MARKET FORCES OF SUPPLY AND DEMAND 9 Demand Curve Shifters The demand curve shows how price affects quantity demanded, other things being equal. These “other things” are non-price determinants of demand ( i. e. , things that determine buyers’ demand for a good, other than the good’s price). Changes in them shift the D curve…
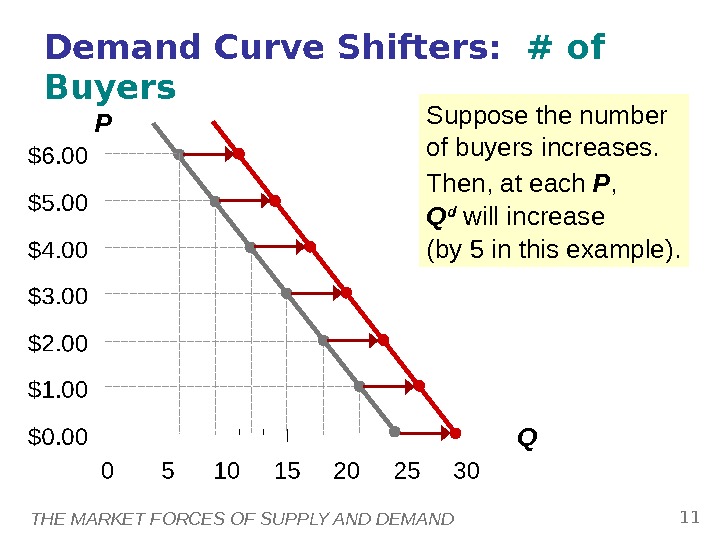
THE MARKET FORCES OF SUPPLY AND DEMAND 10 Demand Curve Shifters: # of Buyers Increase in # of buyers increases quantity demanded at each price, shifts D curve to the right.
THE MARKET FORCES OF SUPPLY AND DEMAND 11 P QSuppose the number of buyers increases. Then, at each P , Q d will increase (by 5 in this example). Demand Curve Shifters: # of Buyers
THE MARKET FORCES OF SUPPLY AND DEMAND 12 Demand for a normal good is positively related to income. Increase in income causes increase in quantity demanded at each price, shifts D curve to the right. (Demand for an inferior good is negatively related to income. An increase in income shifts D curves for inferior goods to the left. ) Demand Curve Shifters: Income
THE MARKET FORCES OF SUPPLY AND DEMAND 13 Two goods are substitutes if an increase in the price of one causes an increase in demand for the other. Example: pizza and hamburgers. An increase in the price of pizza increases demand for hamburgers, shifting hamburger demand curve to the right. Other examples: Coke and Pepsi, laptops and desktop computers, CDs and music downloads Demand Curve Shifters: Prices of Related Goods
THE MARKET FORCES OF SUPPLY AND DEMAND 14 Two goods are complements if an increase in the price of one causes a fall in demand for the other. Example: computers and software. If price of computers rises, people buy fewer computers, and therefore less software. Software demand curve shifts left. Other examples: college tuition and textbooks, bagels and cream cheese, eggs and bacon. Demand Curve Shifters: Prices of Related Goods
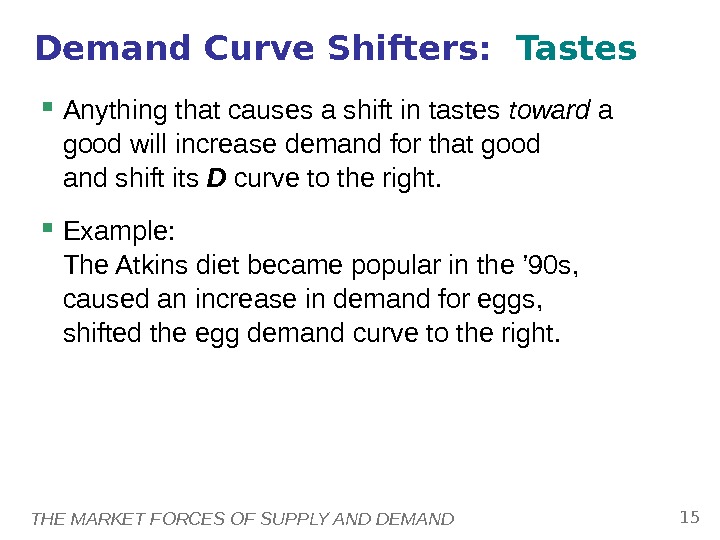
THE MARKET FORCES OF SUPPLY AND DEMAND 15 Anything that causes a shift in tastes toward a good will increase demand for that good and shift its D curve to the right. Example: The Atkins diet became popular in the ’ 90 s, caused an increase in demand for eggs, shifted the egg demand curve to the right. Demand Curve Shifters: Tastes
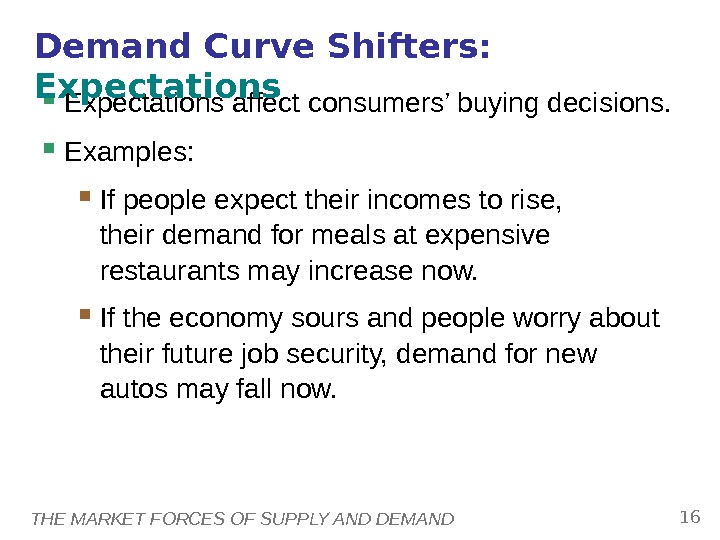
THE MARKET FORCES OF SUPPLY AND DEMAND 16 Expectations affect consumers’ buying decisions. Examples: If people expect their incomes to rise, their demand for meals at expensive restaurants may increase now. If the economy sours and people worry about their future job security, demand for new autos may fall now. Demand Curve Shifters: Expectations
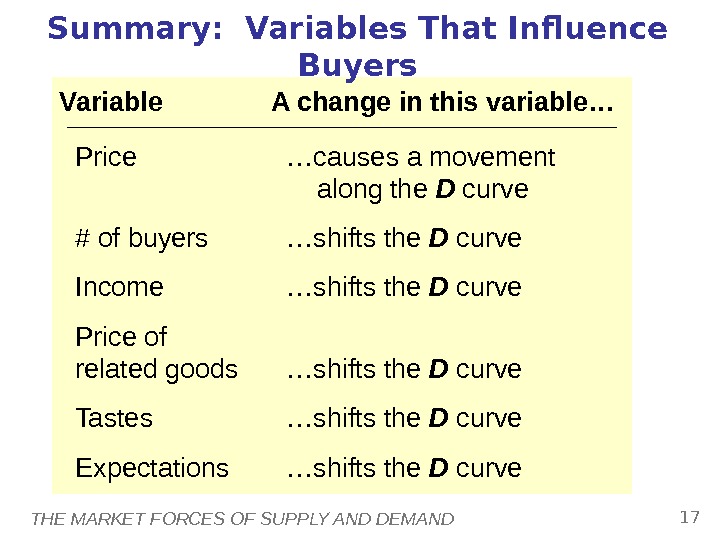
THE MARKET FORCES OF SUPPLY AND DEMAND 17 Summary: Variables That Influence Buyers Variable A change in this variable… Price …causes a movement along the D curve # of buyers …shifts the D curve Income …shifts the D curve Price of related goods …shifts the D curve Tastes …shifts the D curve Expectations …shifts the D curve
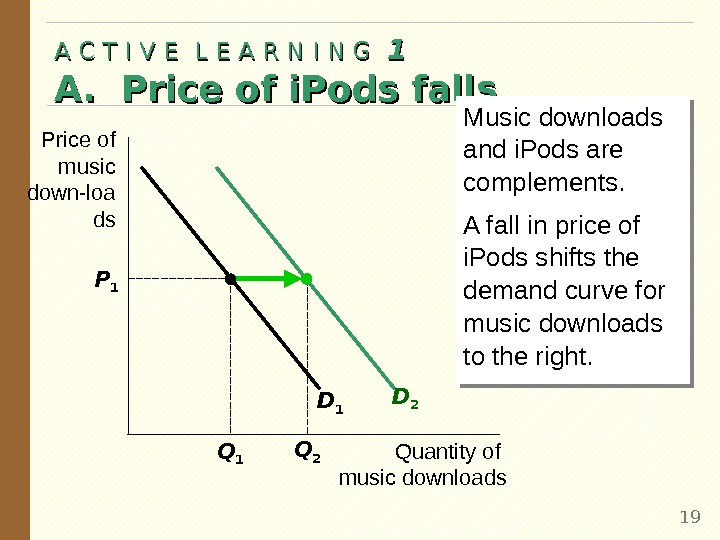
A. The price of i. Pods falls B. The price of music downloads falls C. The price of CDs falls. A C T I V E L E A R N I N G 11 Demand Curve 18 Draw a demand curve for music downloads. What happens to it in each of the following scenarios? Why?
A C T I V E L E A R N I N G 11 A. Price of i. Pods falls 19 Q 2 Price of music down-loa ds Quantity of music downloads. D 1 D 2 P 1 Q 1 Music downloads and i. Pods are complements. A fall in price of i. Pods shifts the demand curve for music downloads to the right.
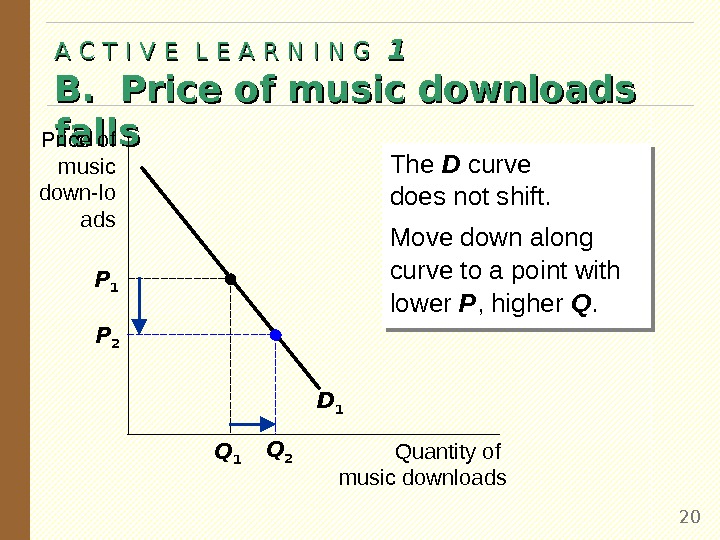
A C T I V E L E A R N I N G 11 B. Price of music downloads falls 20 The D curve does not shift. Move down along curve to a point with lower P , higher Q. Price of music down-lo ads Quantity of music downloads. D 1 P 1 Q 2 P
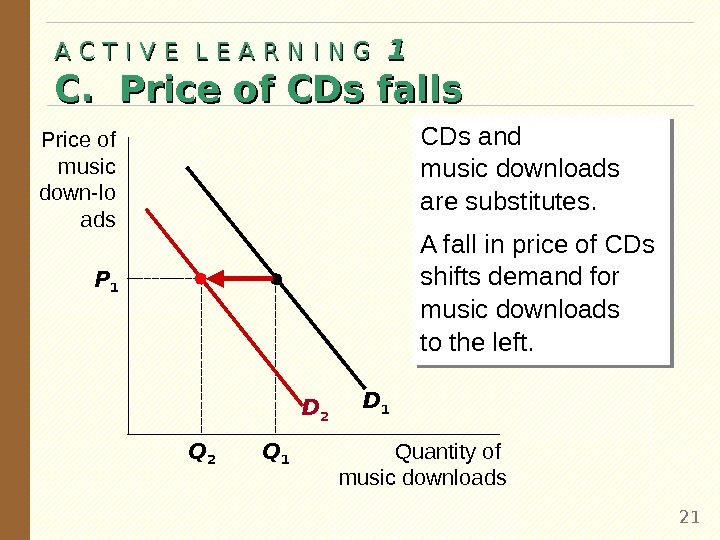
A C T I V E L E A R N I N G 11 C. Price of CDs falls 21 P 1 Q 1 CDs and music downloads are substitutes. A fall in price of CDs shifts demand for music downloads to the left. Price of music down-lo ads Quantity of music downloads D 1 D 2 Q
THE MARKET FORCES OF SUPPLY AND DEMAND 22 Supply The quantity supplied of any good is the amount that sellers are willing and able to sell. Law of supply : the claim that the quantity supplied of a good rises when the price of the good rises, other things equal
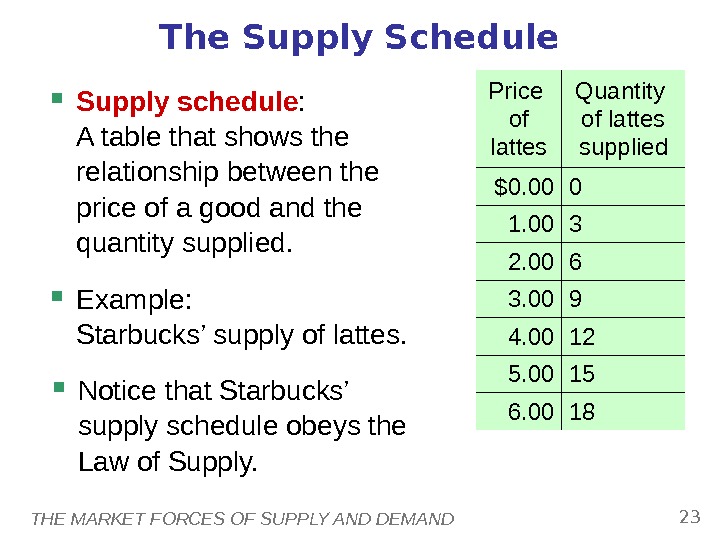
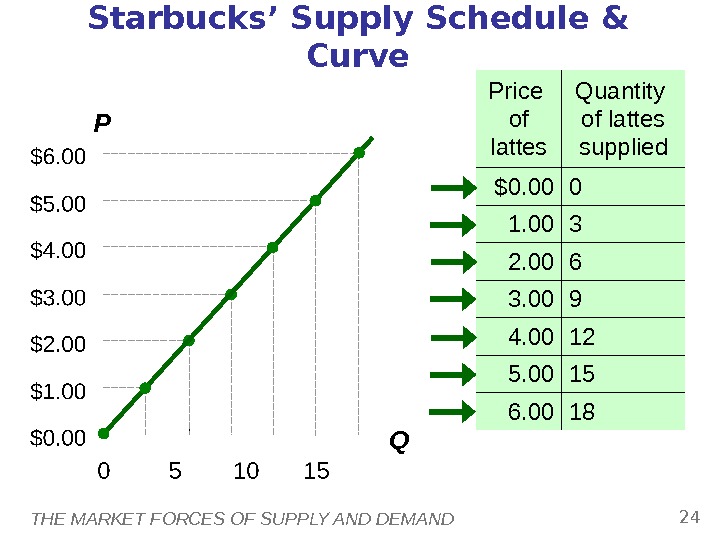
THE MARKET FORCES OF SUPPLY AND DEMAND 23 The Supply Schedule Supply schedule : A table that shows the relationship between the price of a good and the quantity supplied. Example: Starbucks’ supply of lattes. Notice that Starbucks’ supply schedule obeys the Law of Supply. Price of lattes Quantity of lattes supplied $0. 00 0 1. 00 3 2. 00 6 3. 00 9 4. 00 12 5. 00 15 6.
THE MARKET FORCES OF SUPPLY AND DEMAND 24 Starbucks’ Supply Schedule & Curve Price of lattes Quantity of lattes supplied $0. 00 0 1. 00 3 2. 00 6 3. 00 9 4. 00 12 5. 00 15 6. 00 18 P Q
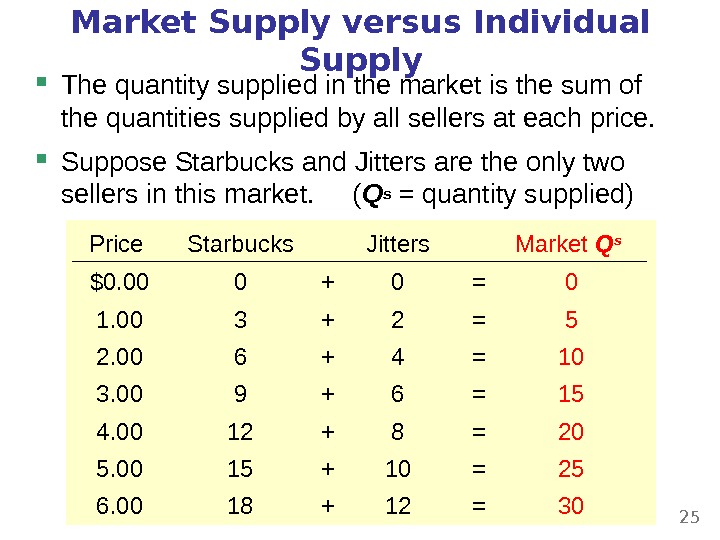
Market Supply versus Individual Supply The quantity supplied in the market is the sum of the quantities supplied by all sellers at each price. Suppose Starbucks and Jitters are the only two sellers in this market. ( Qs = quantity supplied) 18 1512 9630 Starbucks 1210 8 64 20 Jitters ++++ ==== 30 252015+ = 10+ = 5+ = 0 Market Q s $0. 00 6. 005. 004. 003. 00 2. 001. 00 Price
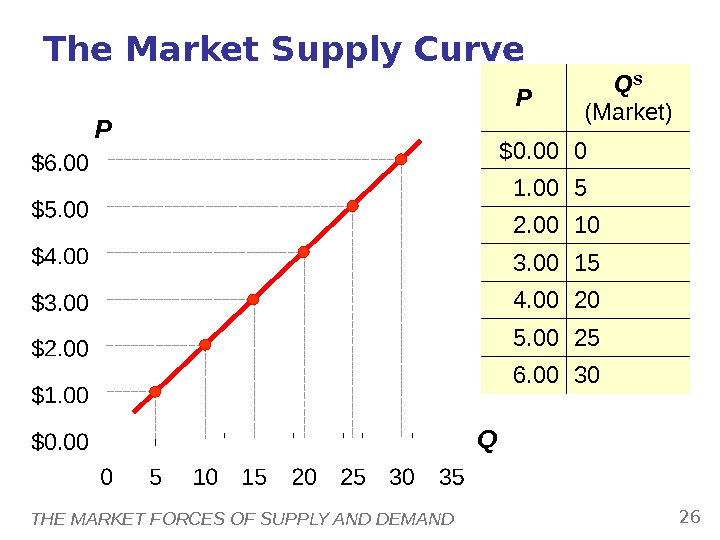
THE MARKET FORCES OF SUPPLY AND DEMAND 26 P QThe Market Supply Curve P Q S (Market) $0. 00 0 1. 00 5 2. 00 10 3. 00 15 4. 00 20 5. 00 25 6.
THE MARKET FORCES OF SUPPLY AND DEMAND 27 Supply Curve Shifters The supply curve shows how price affects quantity supplied, other things being equal. These “other things” are non-price determinants of supply. Changes in them shift the S curve…
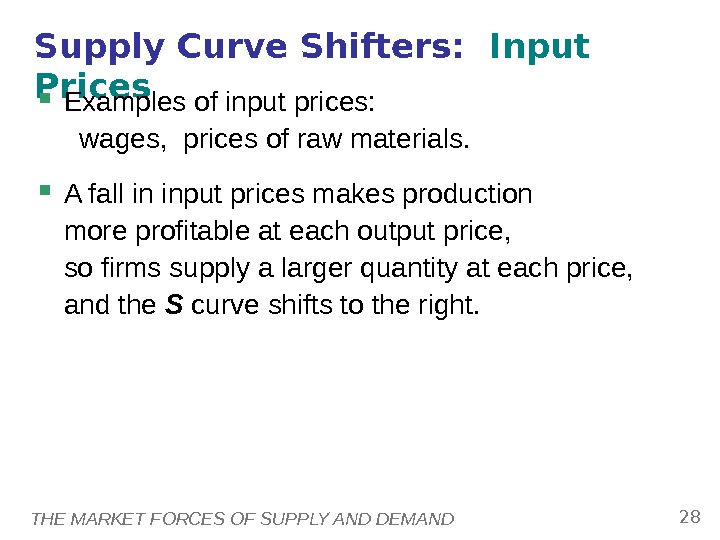
THE MARKET FORCES OF SUPPLY AND DEMAND 28 Supply Curve Shifters: Input Prices Examples of input prices: wages, prices of raw materials. A fall in input prices makes production more profitable at each output price, so firms supply a larger quantity at each price, and the S curve shifts to the right.
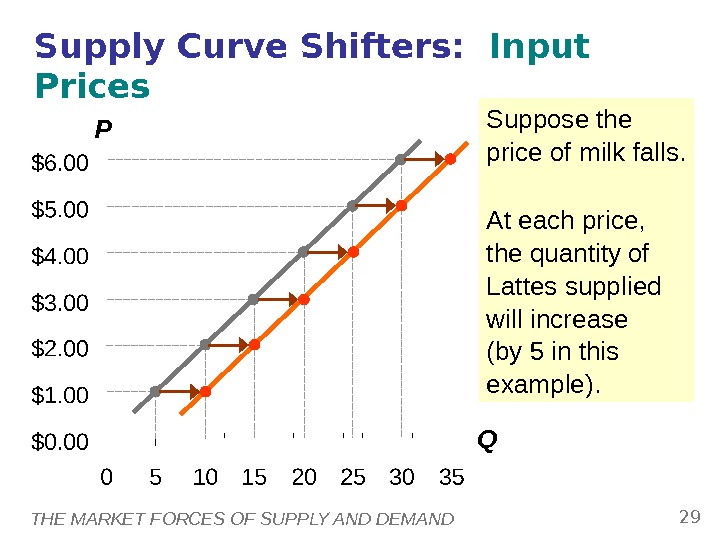
THE MARKET FORCES OF SUPPLY AND DEMAND 29 P Q Suppose the price of milk falls. At each price, the quantity of Lattes supplied will increase (by 5 in this example). Supply Curve Shifters: Input Prices
THE MARKET FORCES OF SUPPLY AND DEMAND 30 Supply Curve Shifters: Technology determines how much inputs are required to produce a unit of output. A cost-saving technological improvement has the same effect as a fall in input prices, shifts S curve to the right.
THE MARKET FORCES OF SUPPLY AND DEMAND 31 Supply Curve Shifters: # of Sellers An increase in the number of sellers increases the quantity supplied at each price, shifts S curve to the right.
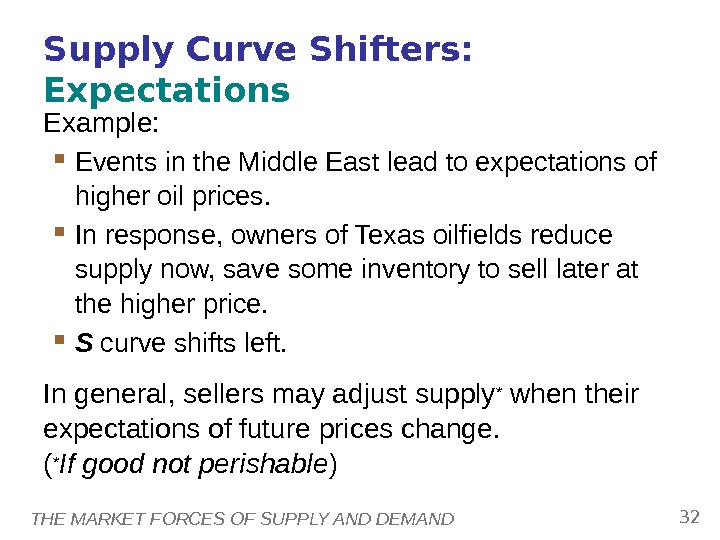
THE MARKET FORCES OF SUPPLY AND DEMAND 32 Supply Curve Shifters: Expectations Example: Events in the Middle East lead to expectations of higher oil prices. In response, owners of Texas oilfields reduce supply now, save some inventory to sell later at the higher price. S curve shifts left. In general, sellers may adjust supply* when their expectations of future prices change. ( * If good not perishable )
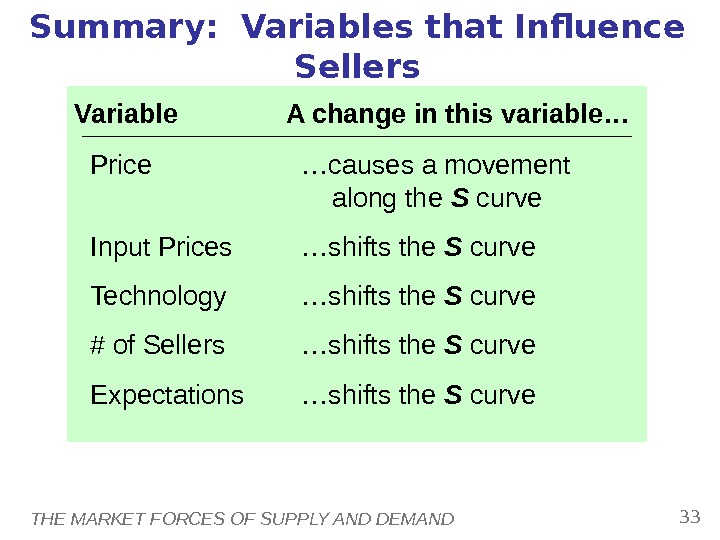
THE MARKET FORCES OF SUPPLY AND DEMAND 33 Summary: Variables that Influence Sellers Variable A change in this variable… Price …causes a movement along the S curve Input Prices …shifts the S curve Technology …shifts the S curve # of Sellers …shifts the S curve Expectations …shifts the S curve
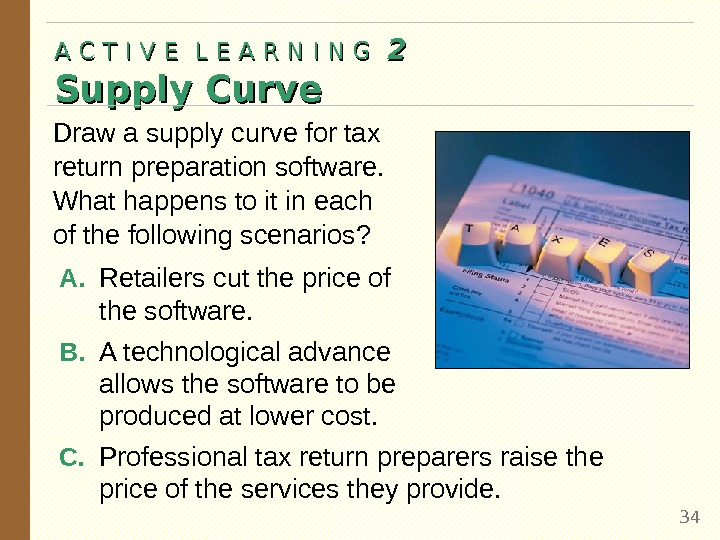
A C T I V E L E A R N I N G 22 Supply Curve 34 Draw a supply curve for tax return preparation software. What happens to it in each of the following scenarios? A. Retailers cut the price of the software. B. A technological advance allows the software to be produced at lower cost. C. Professional tax return preparers raise the price of the services they provide.
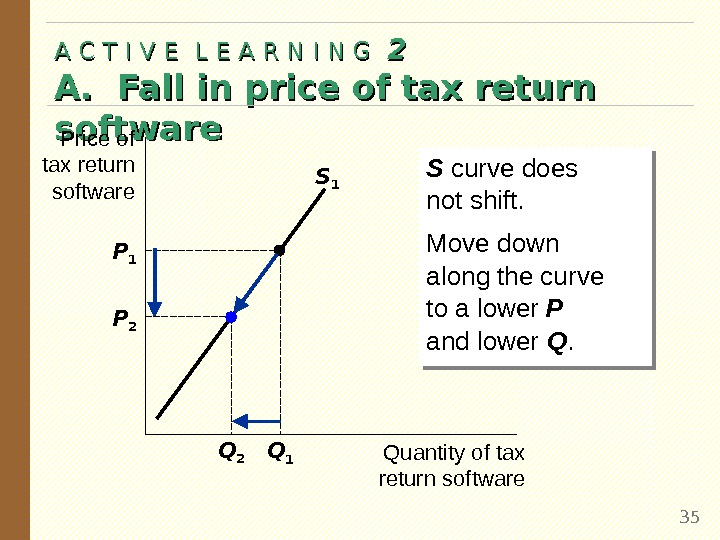
A C T I V E L E A R N I N G 22 A. Fall in price of tax return software 35 S curve does not shift. Move down along the curve to a lower P and lower Q. Price of tax return software Quantity of tax return software. S 1 P 1 Q 1 Q 2 P
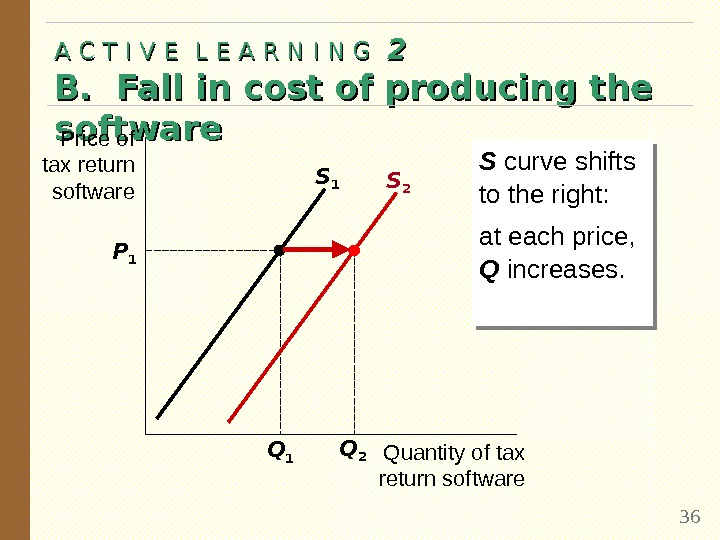
A C T I V E L E A R N I N G 22 B. Fall in cost of producing the software 36 S curve shifts to the right: at each price, Q increases. Price of tax return software Quantity of tax return software. S 1 P 1 Q 1 S 2 Q
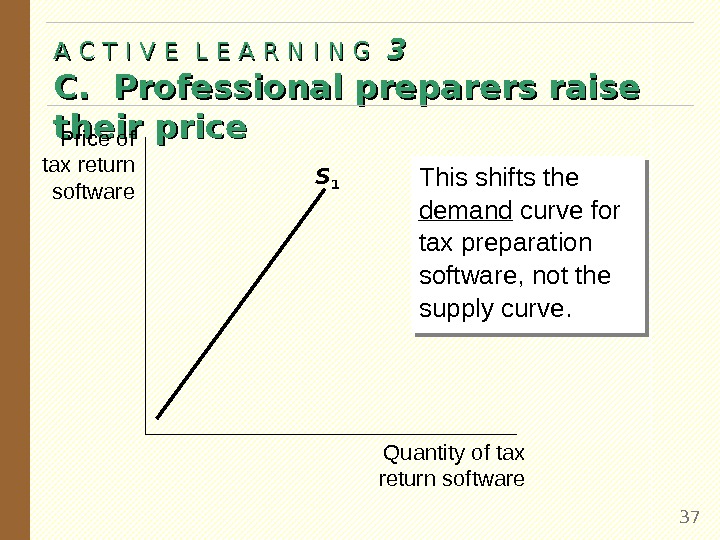
A C T I V E L E A R N I N G 33 C. Professional preparers raise their price 37 This shifts the demand curve for tax preparation software, not the supply curve. Price of tax return software Quantity of tax return software. S
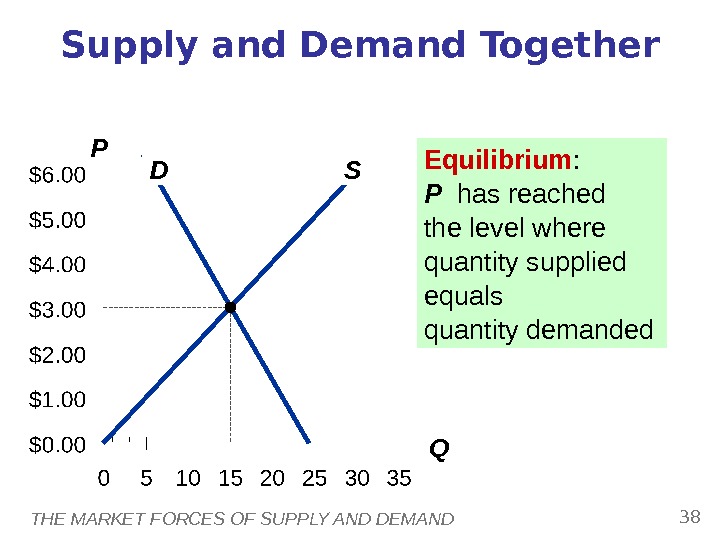
THE MARKET FORCES OF SUPPLY AND DEMAND 38 P QSupply and Demand Together D S Equilibrium : P has reached the level where quantity supplied equals quantity demanded
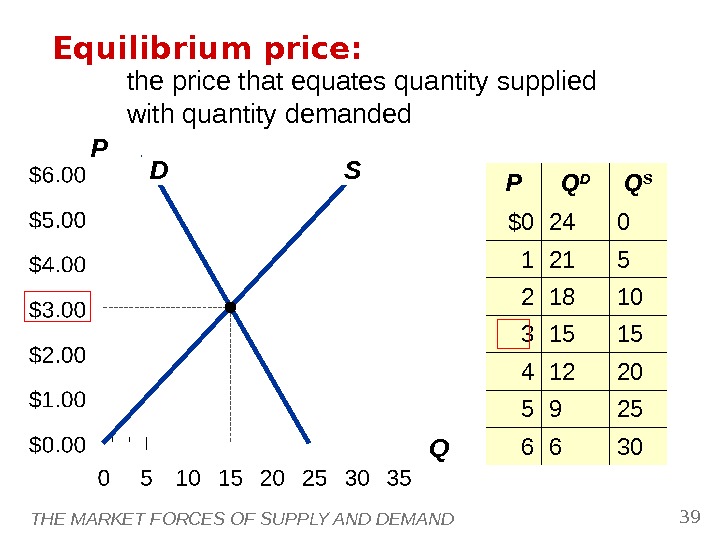
THE MARKET FORCES OF SUPPLY AND DEMAND 39 D SP QEquilibrium price: P Q D Q S $0 24 0 1 21 5 2 18 10 3 15 15 4 12 20 5 9 25 6 6 30 the price that equates quantity supplied with quantity demanded
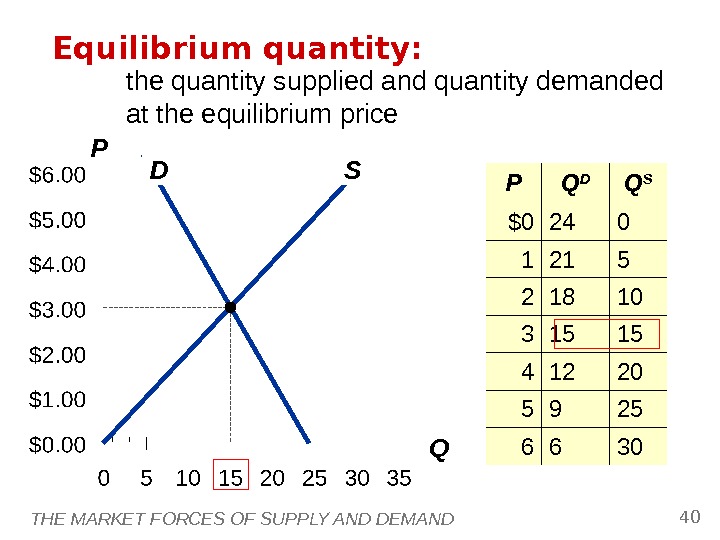
THE MARKET FORCES OF SUPPLY AND DEMAND 40 D SP QEquilibrium quantity: P Q D Q S $0 24 0 1 21 5 2 18 10 3 15 15 4 12 20 5 9 25 6 6 30 the quantity supplied and quantity demanded at the equilibrium price
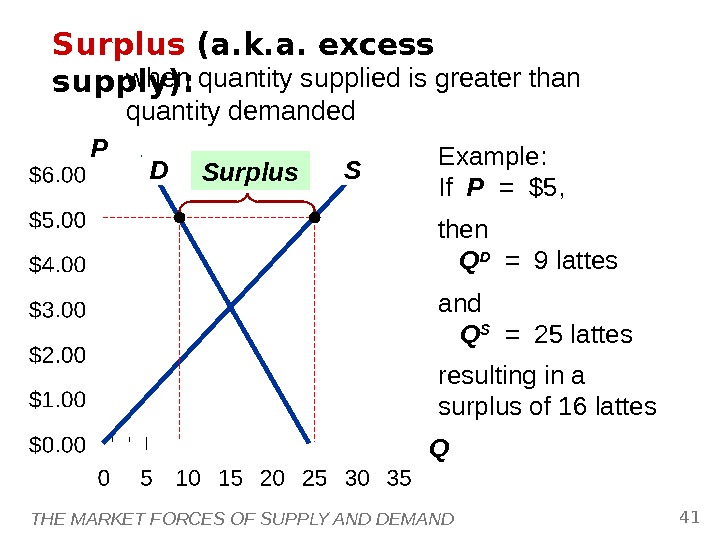
THE MARKET FORCES OF SUPPLY AND DEMAND 41 P QD SSurplus (a. k. a. excess supply): when quantity supplied is greater than quantity demanded Surplus Example: If P = $5, then Q D = 9 lattes and Q S = 25 lattes resulting in a surplus of 16 lattes
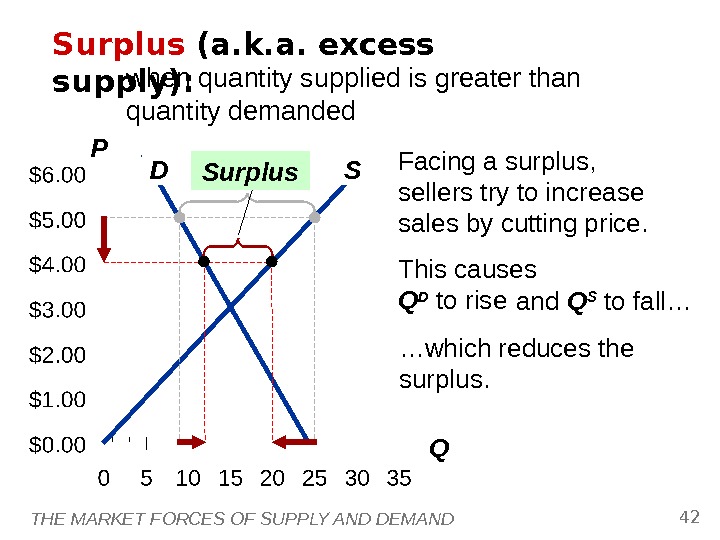
THE MARKET FORCES OF SUPPLY AND DEMAND 42 P QD SSurplus (a. k. a. excess supply): when quantity supplied is greater than quantity demanded Facing a surplus, sellers try to increase sales by cutting price. This causes Q D to rise. Surplus … which reduces the surplus. and Q S to fall…
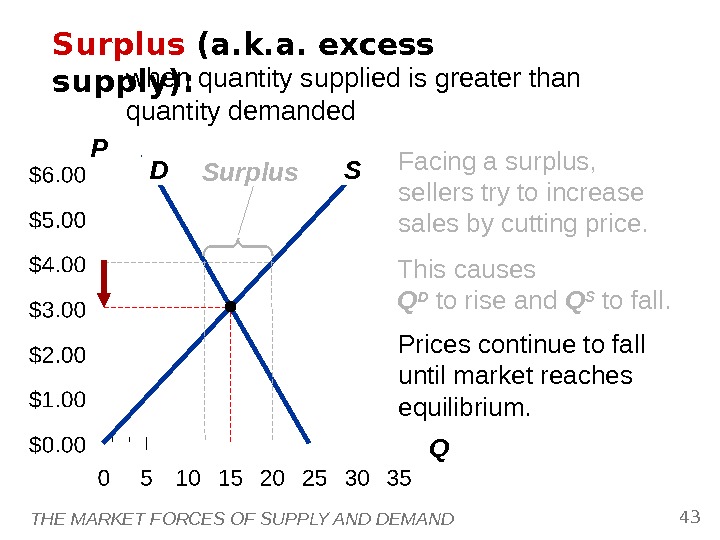
THE MARKET FORCES OF SUPPLY AND DEMAND 43 P QD SSurplus (a. k. a. excess supply): when quantity supplied is greater than quantity demanded Facing a surplus, sellers try to increase sales by cutting price. This causes Q D to rise and Q S to fall. Surplus Prices continue to fall until market reaches equilibrium.
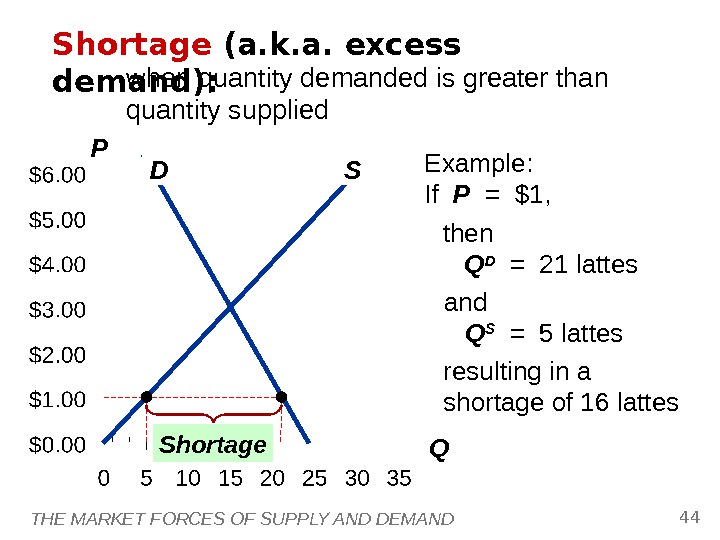
THE MARKET FORCES OF SUPPLY AND DEMAND 44 P QD SShortage (a. k. a. excess demand): when quantity demanded is greater than quantity supplied Example: If P = $1, then Q D = 21 lattes and Q S = 5 lattes resulting in a shortage of 16 lattes Shortage
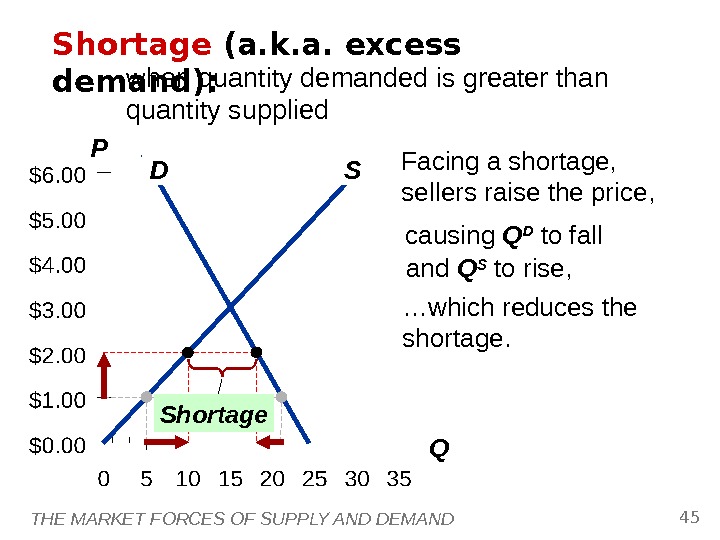
THE MARKET FORCES OF SUPPLY AND DEMAND 45 P QD SShortage (a. k. a. excess demand): when quantity demanded is greater than quantity supplied Facing a shortage, sellers raise the price, causing Q D to fall … which reduces the shortage. and Q S to rise, Shortage
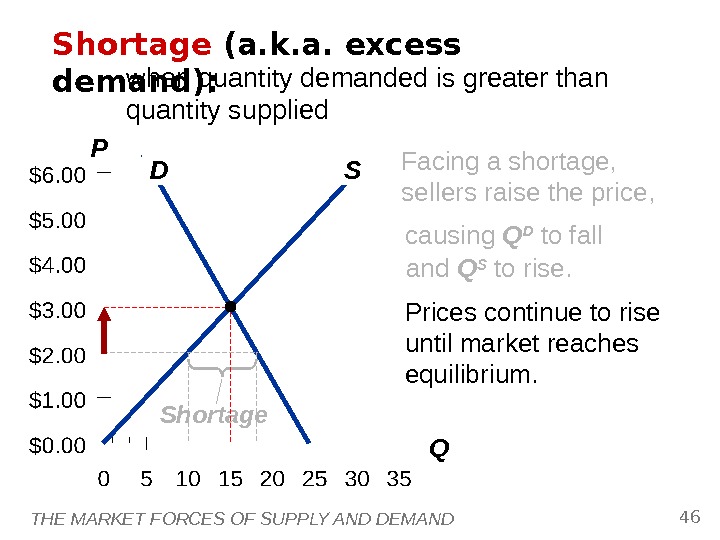
THE MARKET FORCES OF SUPPLY AND DEMAND 46 P QD SShortage (a. k. a. excess demand): when quantity demanded is greater than quantity supplied Facing a shortage, sellers raise the price, causing Q D to fall and Q S to rise. Shortage Prices continue to rise until market reaches equilibrium.
THE MARKET FORCES OF SUPPLY AND DEMAND 47 Three Steps to Analyzing Changes in Eq’m To determine the effects of any event, 1. Decide whether event shifts S curve, D curve, or both. 2. Decide in which direction curve shifts. 3. Use supply-demand diagram to see how the shift changes eq’m P and Q.
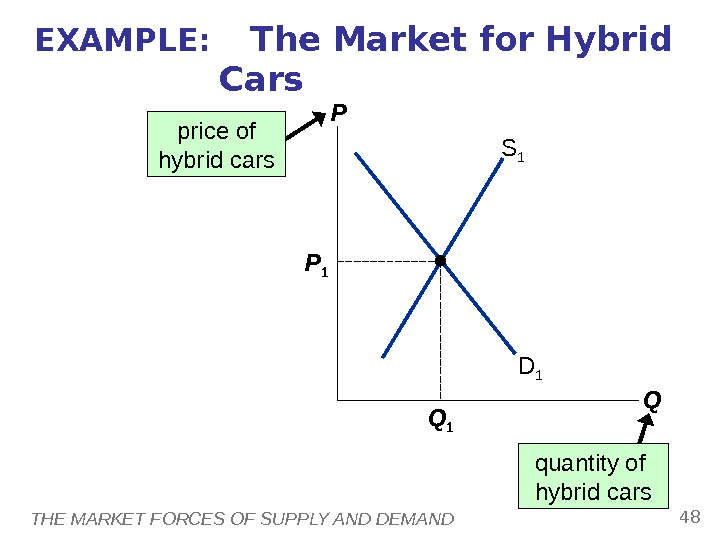
THE MARKET FORCES OF SUPPLY AND DEMAND 48 EXAMPLE: The Market for Hybrid Cars P QD 1 S 1 P 1 Q 1 price of hybrid cars quantity of hybrid cars
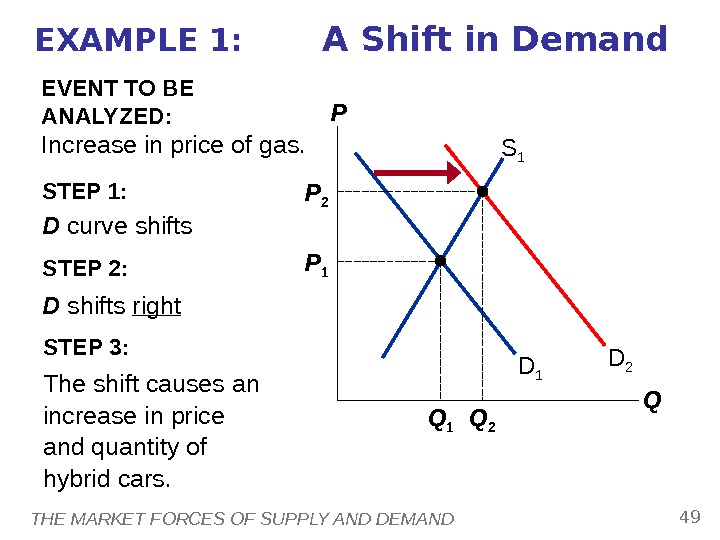
THE MARKET FORCES OF SUPPLY AND DEMAND 49 STEP 1: D curve shifts because price of gas affects demand for hybrids. S curve does not shift, because price of gas does not affect cost of producing hybrids. STEP 2: D shifts right because high gas price makes hybrids more attractive relative to other cars. EXAMPLE 1: A Shift in Demand EVENT TO BE ANALYZED: Increase in price of gas. P QD 1 S 1 P 1 Q 1 D 2 P 2 Q 2 STEP 3: The shift causes an increase in price and quantity of hybrid cars.
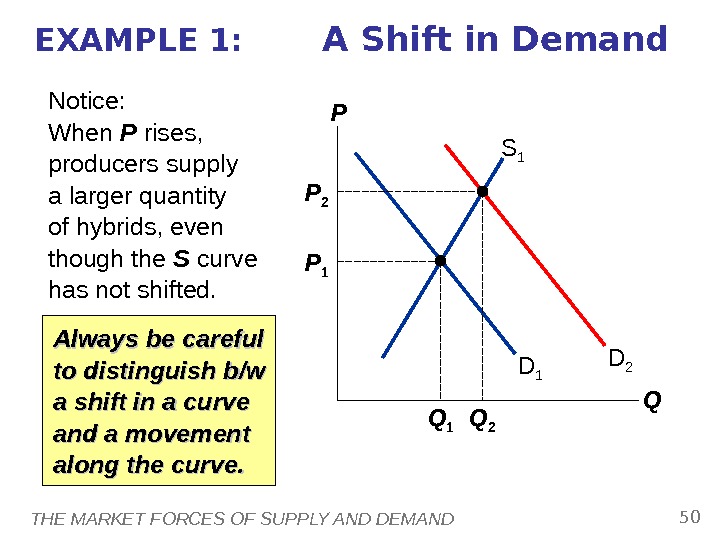
THE MARKET FORCES OF SUPPLY AND DEMAND 50 EXAMPLE 1: A Shift in Demand P QD 1 S 1 P 1 Q 1 D 2 P 2 Q 2 Notice: When P rises, producers supply a larger quantity of hybrids, even though the S curve has not shifted. Always be careful to distinguish b/w a shift in a curve and a movement along the curve.
Terms for Shift vs. Movement Along Curve Change in supply: a shift in the S curve occurs when a non-price determinant of supply changes (like technology or costs) Change in the quantity supplied: a movement along a fixed S curve occurs when P changes Change in demand: a shift in the D curve occurs when a non-price determinant of demand changes (like income or # of buyers) Change in the quantity demanded: a movement along a fixed D curve occurs when P changes
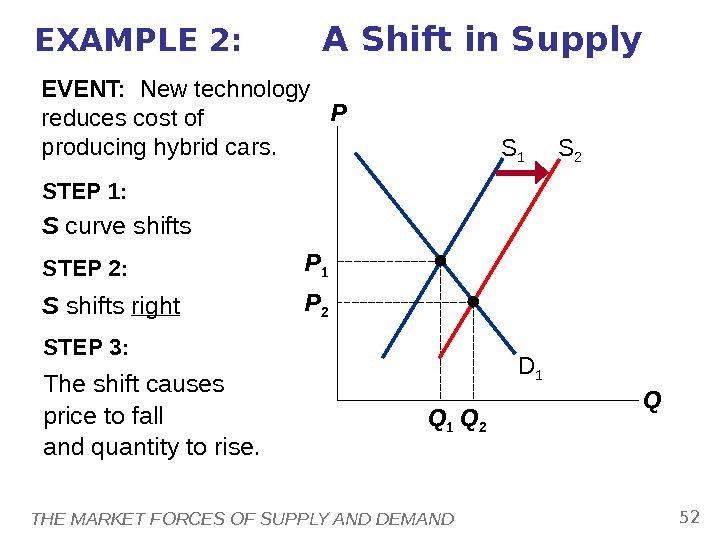
THE MARKET FORCES OF SUPPLY AND DEMAND 52 STEP 1: S curve shifts because event affects cost of production. D curve does not shift, because production technology is not one of the factors that affect demand. STEP 2: S shifts right because event reduces cost, makes production more profitable at any given price. EXAMPLE 2: A Shift in Supply P QD 1 S 1 P 1 Q 1 S 2 P 2 Q 2 EVENT: New technology reduces cost of producing hybrid cars. STEP 3: The shift causes price to fall and quantity to rise.
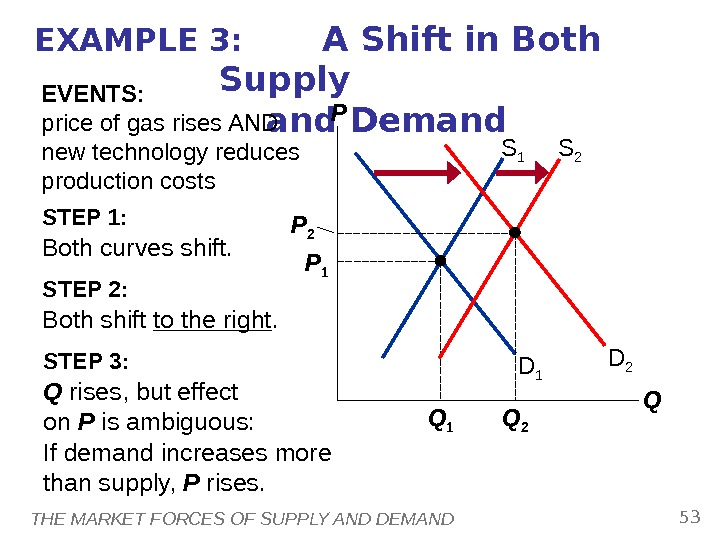
THE MARKET FORCES OF SUPPLY AND DEMAND 53 EXAMPLE 3: A Shift in Both Supply and Demand P QD 1 S 1 P 1 Q 1 S 2 D 2 P 2 Q 2 EVENTS: price of gas rises AND new technology reduces production costs STEP 1: Both curves shift. STEP 2: Both shift to the right. STEP 3: Q rises, but effect on P is ambiguous: If demand increases more than supply, P rises.
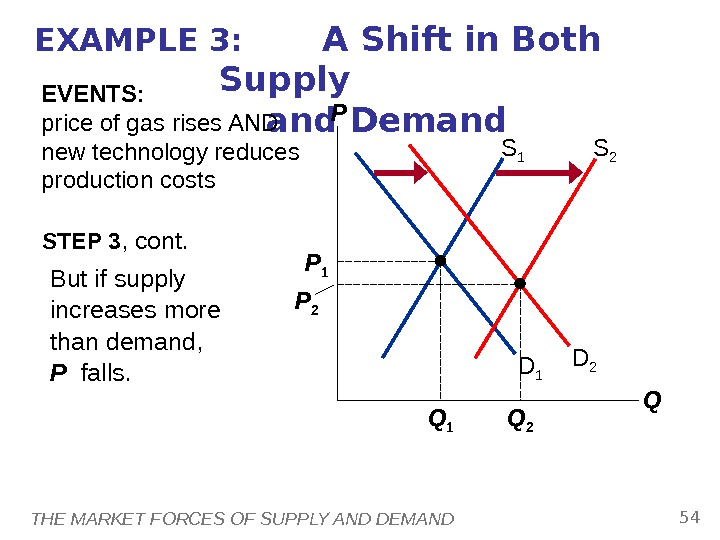
THE MARKET FORCES OF SUPPLY AND DEMAND 54 EXAMPLE 3: A Shift in Both Supply and Demand STEP 3 , cont. P QD 1 S 1 P 1 Q 1 S 2 D 2 P 2 Q 2 EVENTS: price of gas rises AND new technology reduces production costs But if supply increases more than demand, P falls.
A C T I V E L E A R N I N G 33 Shifts in supply and demand 55 Use three-step method to analyze the effects of each event on the equilibrium price and quantity of music downloads. Event A: A fall in the price of CDs Event B: Sellers of music downloads negotiate a reduction in the royalties they must pay for each song they sell. Event C: Events A and B both occur.
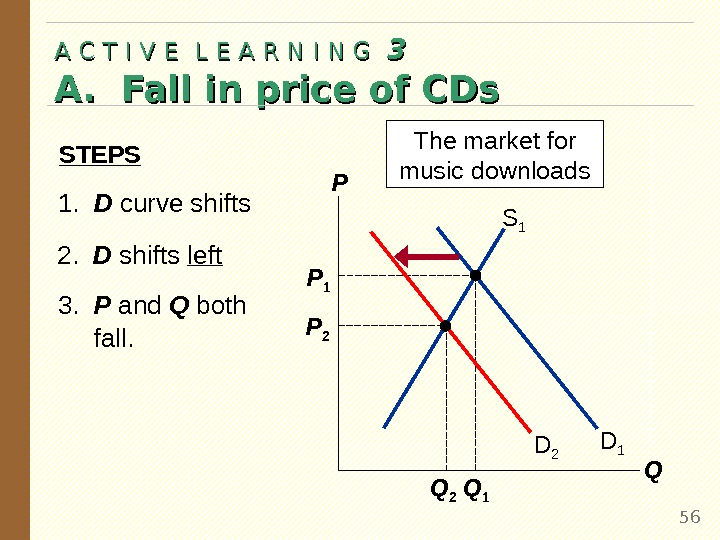
A C T I V E L E A R N I N G 33 A. Fall in price of CDs 562. D shifts left P QD 1 S 1 P 1 Q 1 D 2 The market for music downloads P 2 Q 21. D curve shifts 3. P and Q both fall. STEPS
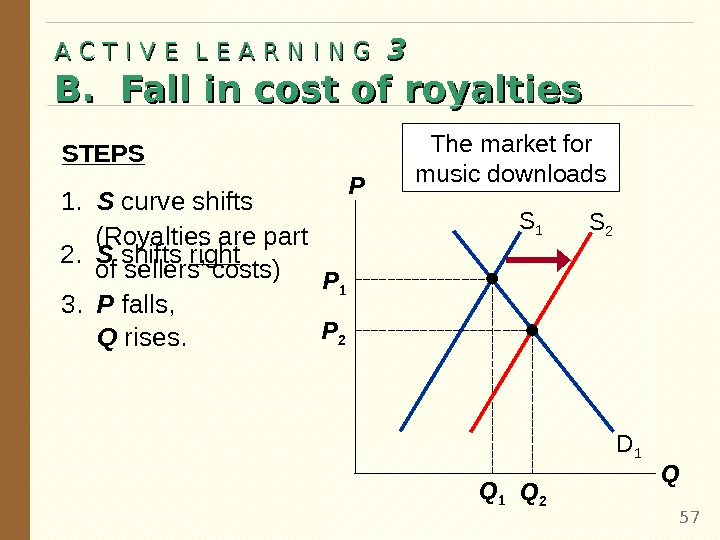
A C T I V E L E A R N I N G 33 B. Fall in cost of royalties 57 P QD 1 S 1 P 1 Q 1 S 2 The market for music downloads Q 2 P 21. S curve shifts 2. S shifts right 3. P falls, Q rises. STEPS (Royalties are part of sellers’ costs)
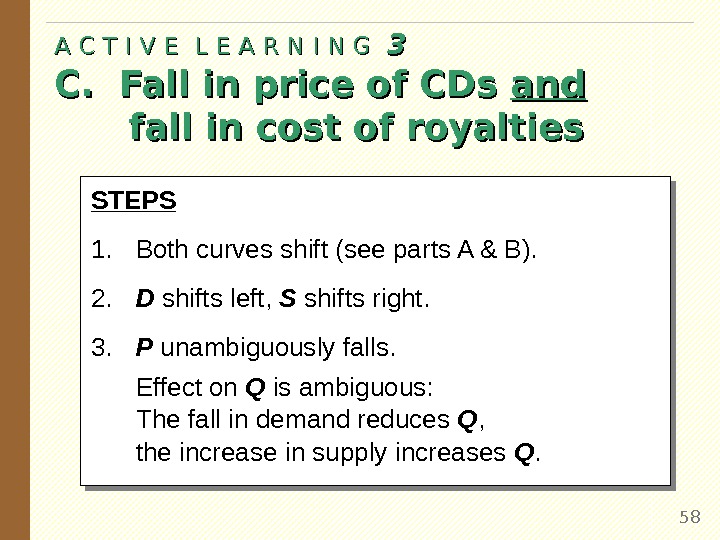
A C T I V E L E A R N I N G 33 C. Fall in price of CDs andand fall in cost of royalties 58 STEPS 1. Both curves shift (see parts A & B). 2. D shifts left, S shifts right. 3. P unambiguously falls. Effect on Q is ambiguous: The fall in demand reduces Q , the increase in supply increases Q.
THE MARKET FORCES OF SUPPLY AND DEMAND 59 CONCLUSION: How Prices Allocate Resources One of the Ten Principles from Chapter 1: Markets are usually a good way to organize economic activity. In market economies, prices adjust to balance supply and demand. These equilibrium prices are the signals that guide economic decisions and thereby allocate scarce resources.
CHAPTER SUMMARY A competitive market has many buyers and sellers, each of whom has little or no influence on the market price. Economists use the supply and demand model to analyze competitive markets. The downward-sloping demand curve reflects the Law of Demand, which states that the quantity buyers demand of a good depends negatively on the good’s price.
CHAPTER SUMMARY Besides price, demand depends on buyers’ incomes, tastes, expectations, the prices of substitutes and complements, and number of buyers. If one of these factors changes, the D curve shifts. The upward-sloping supply curve reflects the Law of Supply, which states that the quantity sellers supply depends positively on the good’s price. Other determinants of supply include input prices, technology, expectations, and the # of sellers. Changes in these factors shift the S curve.
CHAPTER SUMMARY The intersection of S and D curves determines the market equilibrium. At the equilibrium price, quantity supplied equals quantity demanded. If the market price is above equilibrium, a surplus results, which causes the price to fall. If the market price is below equilibrium, a shortage results, causing the price to rise.
CHAPTER SUMMARY We can use the supply-demand diagram to analyze the effects of any event on a market: First, determine whether the event shifts one or both curves. Second, determine the direction of the shifts. Third, compare the new equilibrium to the initial one. In market economies, prices are the signals that guide economic decisions and allocate scarce resources.