Презентация presentation project management 1















- Размер: 1.7 Mегабайта
- Количество слайдов: 51
Описание презентации Презентация presentation project management 1 по слайдам
 PROVISIONAL GLOBAL BUSINESS AND FINANCIAL ENVIRONMENT Project Management October 2014 part 1 Robin Matthews Professor of International Business Kingston University Business School London JM Keynes Professor of Management Academy of National Economy Moscow Further papers by robin Matthews can be found at http: //robindcmatthews. com http: //www. tcib. org. uk/about. html. Also http: //kpp-russia. ru and http: //www. russtrategy. ru. http: //kingston. ac. uk/CIPB. php 1 robindcmatthews
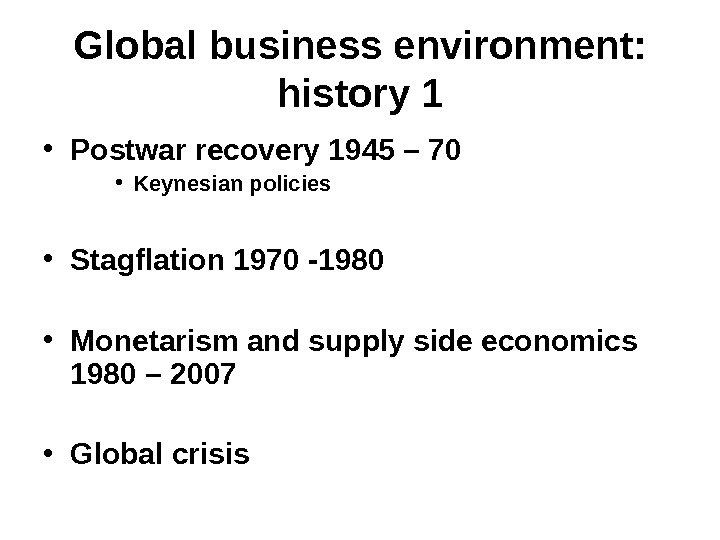
 Global business environment: history 1 • Postwar recovery 1945 – 70 • Keynesian policies • Stagflation 1970 -1980 • Monetarism and supply side economics 1980 – 2007 • Global crisis
 Fundamentals managing projects 1 Firms as collections of projects 3 robindcmatthews
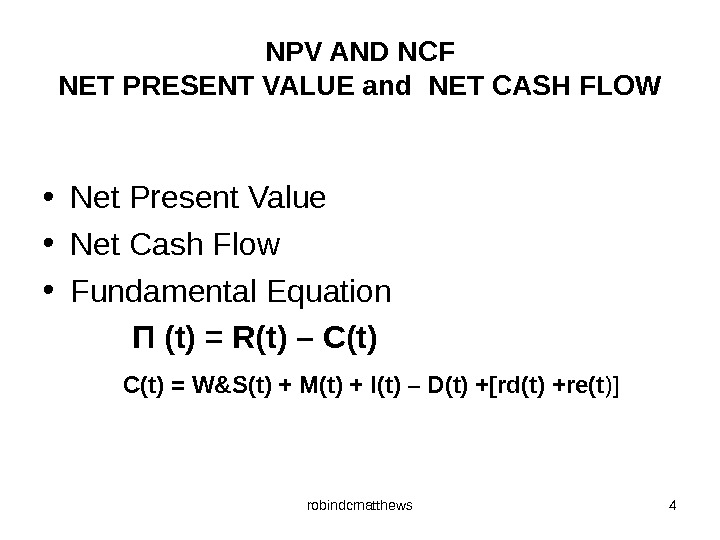
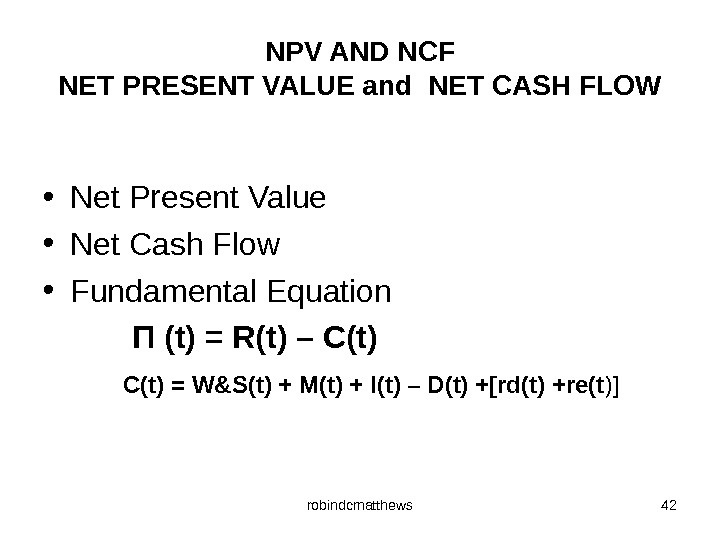
 NPV AND NCF NET PRESENT VALUE and NET CASH FLOW • Net Present Value • Net Cash Flow • Fundamental Equation П (t) = R(t) – C(t) = W&S(t) + M(t) + I(t) – D(t) +[rd(t) +re(t )] robindcmatthews
 Fundamentals managing projects 2 Integrating the real and financial sectors 5 robindcmatthews
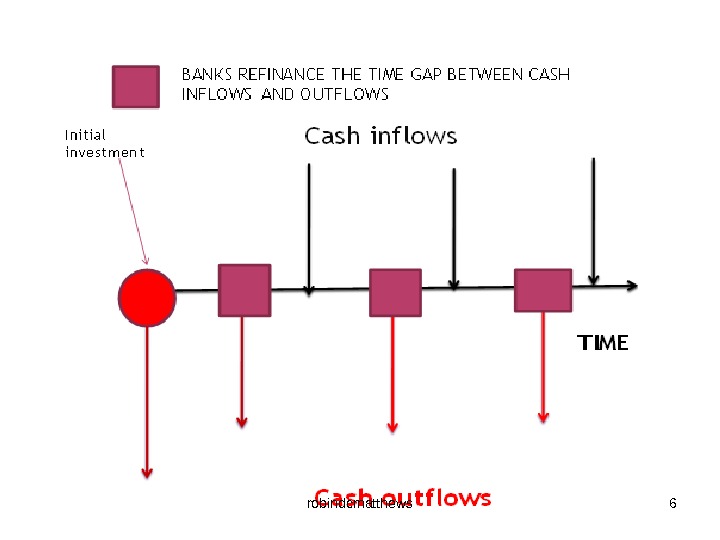
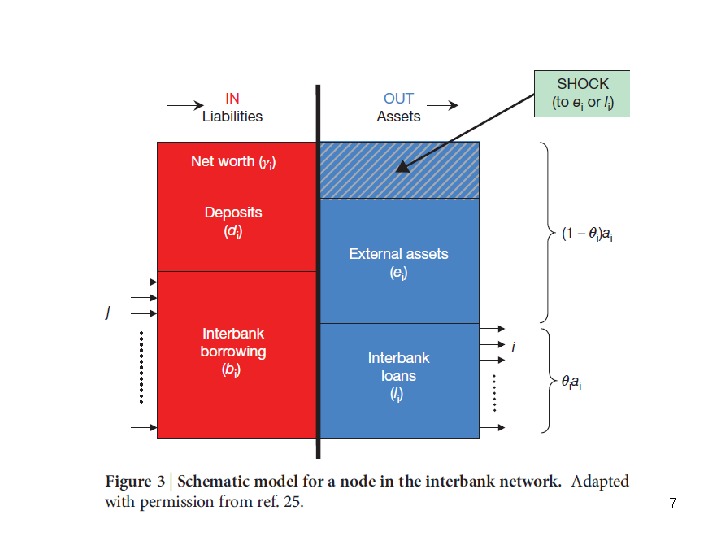
 6 robindcmatthews
 7 robindcmatthews
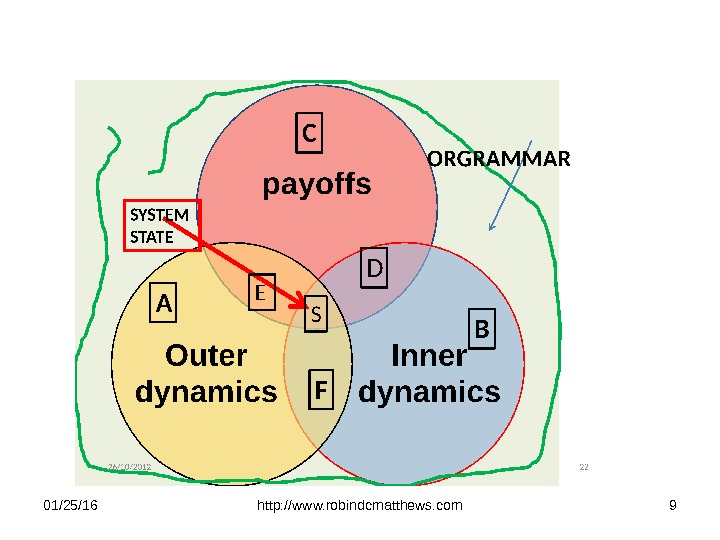
 robindcmatthews 8 Meta Model
 01/25/16 http: //www. robindcmatthews. com
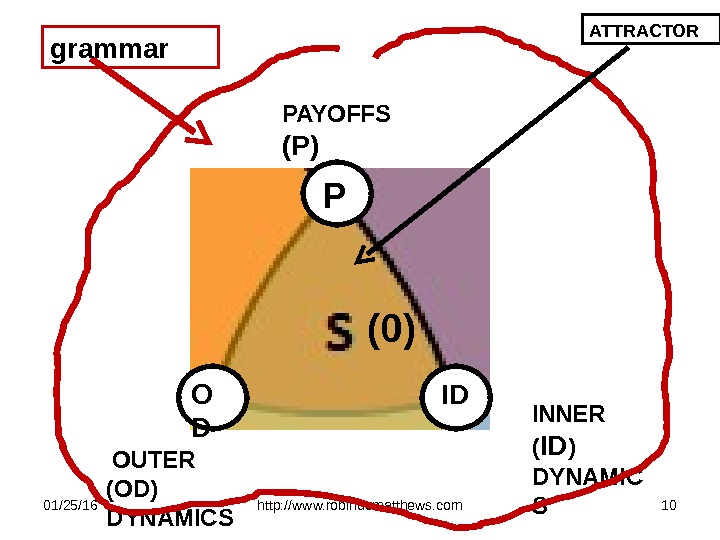
 01/25/16 http: //www. robindcmatthews. com 10 PAYOFFS (P) OUTER (OD) DYNAMICS P IOO DO O P O D INNER ( ID ) DYNAMIC SID(0)grammar ATTRACTOR
 robindcmatthews 11 Project Management October 2014 part
 networks Synergies and feeedback 12 robindcmatthews. Project Management October 2014 part
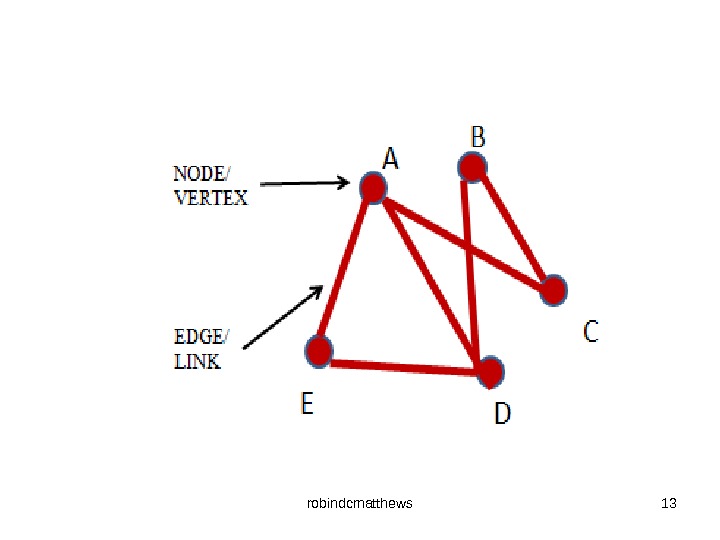
 13 robindcmatthews
 More complex networks robindcmatthews
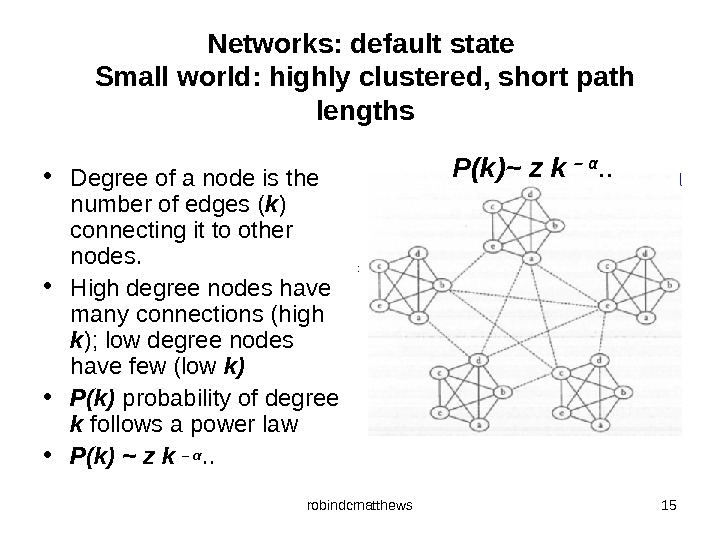
 Networks: default state Small world: highly clustered, short path lengths • Degree of a node is the number of edges ( k ) connecting it to other nodes. • High degree nodes have many connections (high k ); low degree nodes have few (low k) • P(k) probability of degree k follows a power law • P(k) ~ z k – α. . P(k)~ z k – α. . : 15 robindcmatthews
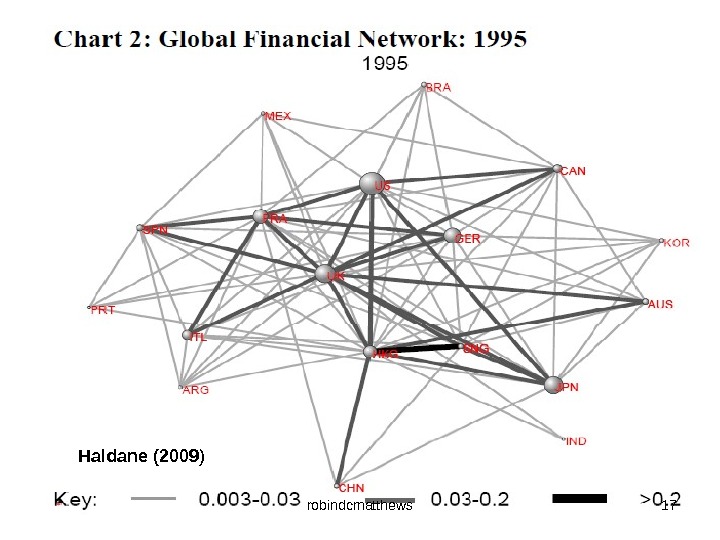
 Haldane (2009 ) 16 robindcmatthews
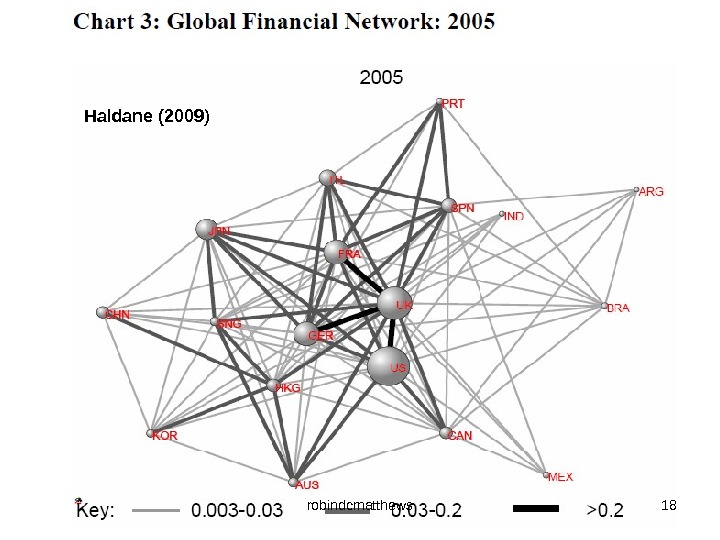
 Haldane (2009 ) 17 robindcmatthews
 Haldane (2009 ) 18 robindcmatthews
 The Crisis 2007 – 20012 The financial tower of Babel robindcmatthews 19 Project Management October 2014 part

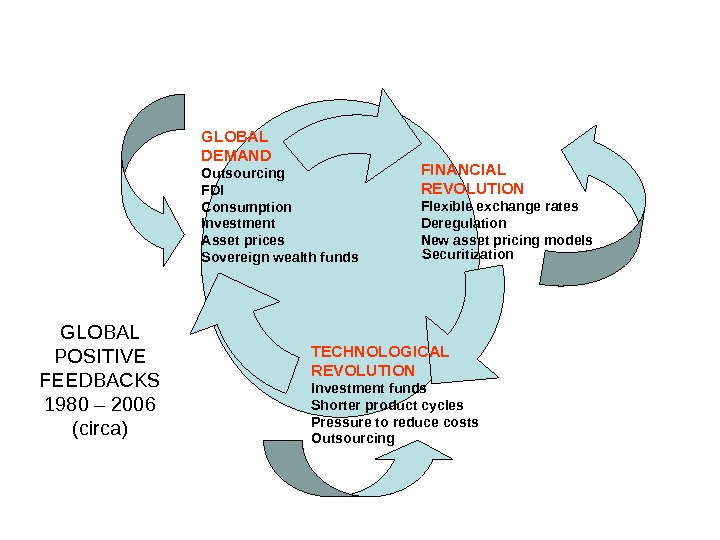
 FINANCIAL REVOLUTION Flexible exchange rates Deregulation New asset pricing models TECHNOLOGICAL REVOLUTION Investment funds Shorter product cycles Pressure to reduce costs Outsourcing. GLOBAL DEMAND Outsourcing FDI Consumption Investment Asset prices Sovereign wealth funds Securitization GLOBAL POSITIVE FEEDBACKS 1980 – 2006 (circa)
 CDO’s CDC’s CDW’S SWF’S SPV’’s SPE’s CONDUITS IPO’s PRIVATE EQUITY FUNDS HEDGE FUNDS DERIVATIVES/OPTIONS SHADOW BANKING SYSTEM REGULATED BANKING SYSTEM CORPORATE BONDS GOVERNMENT BONDS LIQUID ASSETS CASH regulatedunregulated. The financial tower of Babel: 21 ST century
 Causes of crises • Low interest rates • Savings glut • Financial innovation • Moral hazard • None of the above • All of the above • Samudaya (the second noble truth: thirst)
 Causes of the crisis? Low interest rates Savings glut Financial innovation Moral hazard Greed
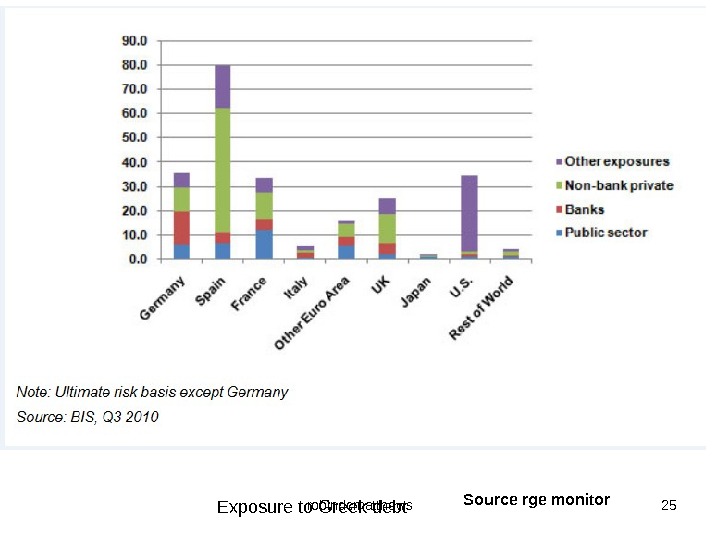
 Exposure to Greek debt Source rge monitor 25 robindcmatthews
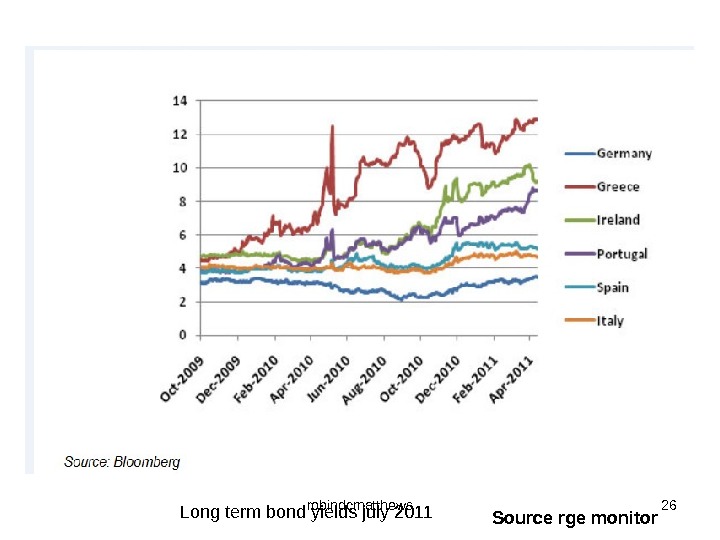
 Long term bond yields july 2011 Source rge monitor 26 robindcmatthews
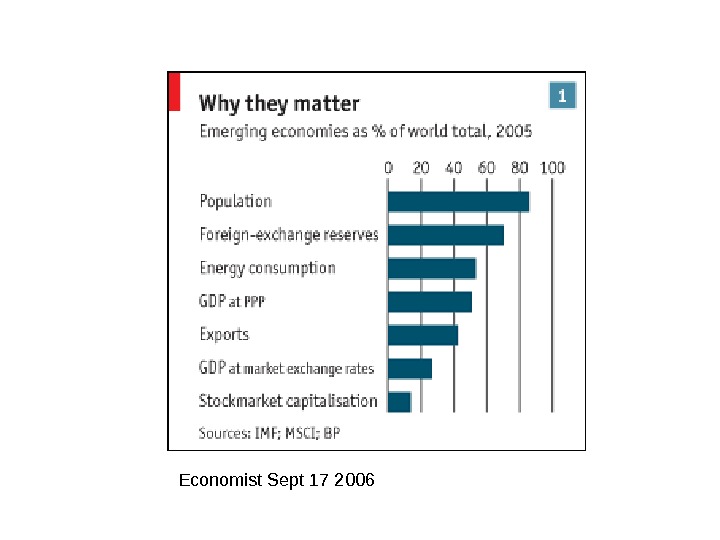
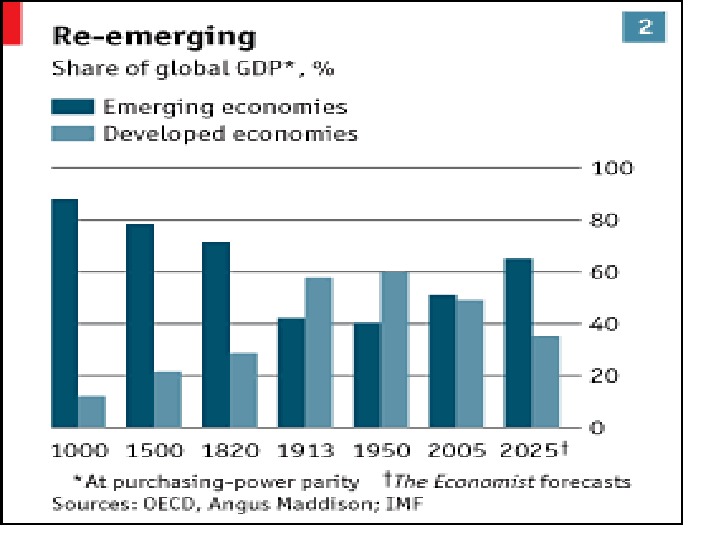
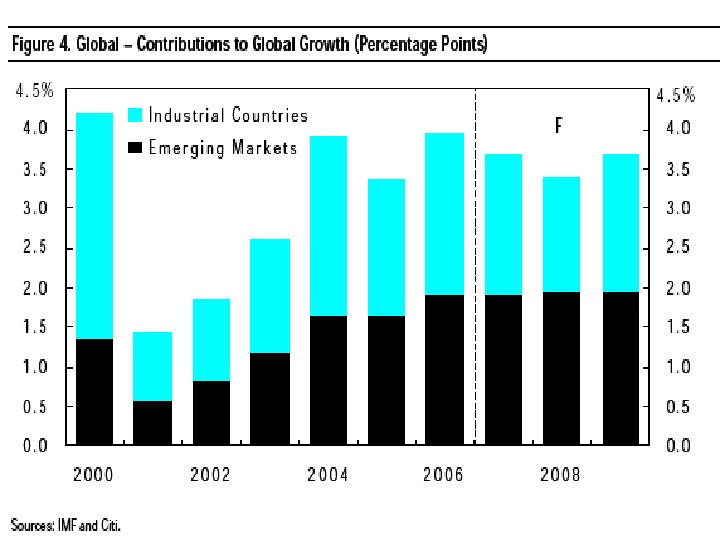
 Project Management October 2014 part 4 Emerging nations Back to the past
 Economist Sept


 Project Management October 2014 part 5 The environment Gaia or exploitation

 Project Management October 2014 part 6 Cryptic models Keynesian and monetarist
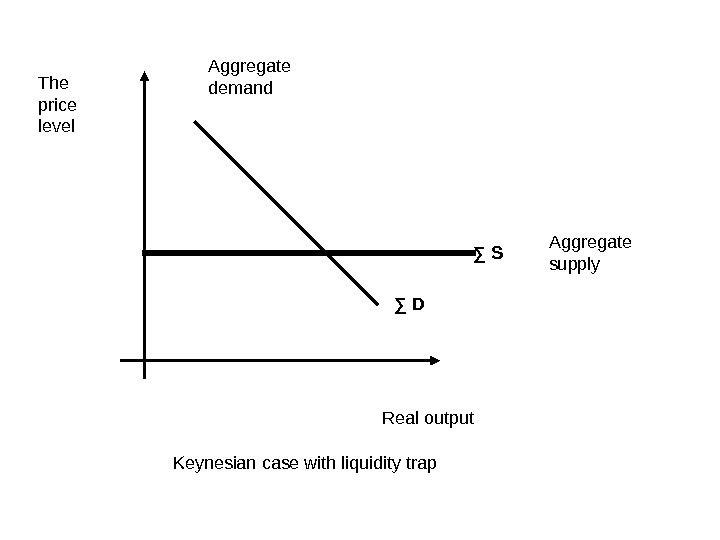
 The price level Real output. Aggregate demand Aggregate supply∑ S ∑ D Keynesian case with liquidity trap
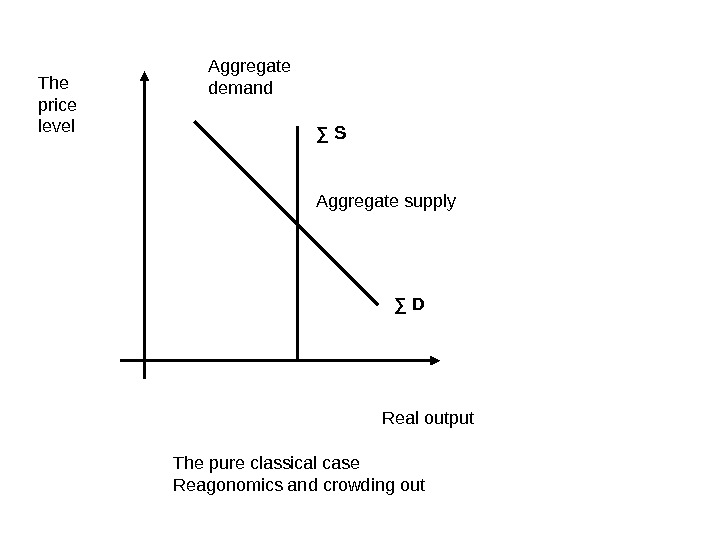
 The price level Real output. Aggregate demand Aggregate supply∑ S ∑ D The pure classical case Reagonomics and crowding out
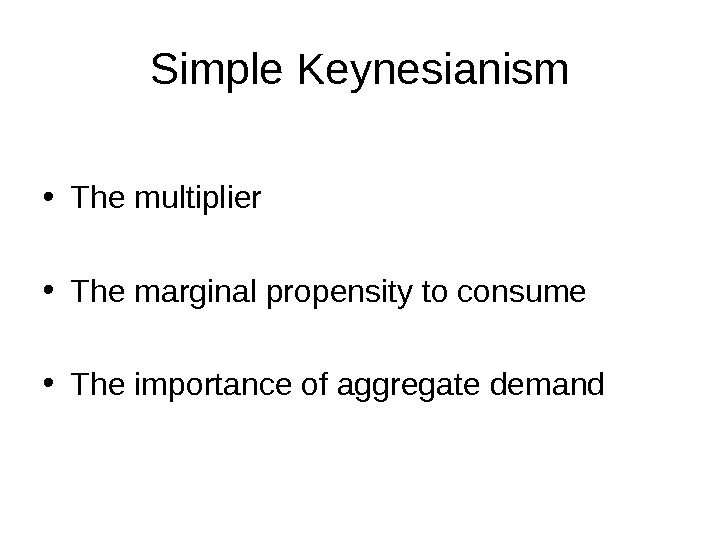
 Simple Keynesianism • The multiplier • The marginal propensity to consume • The importance of aggregate demand
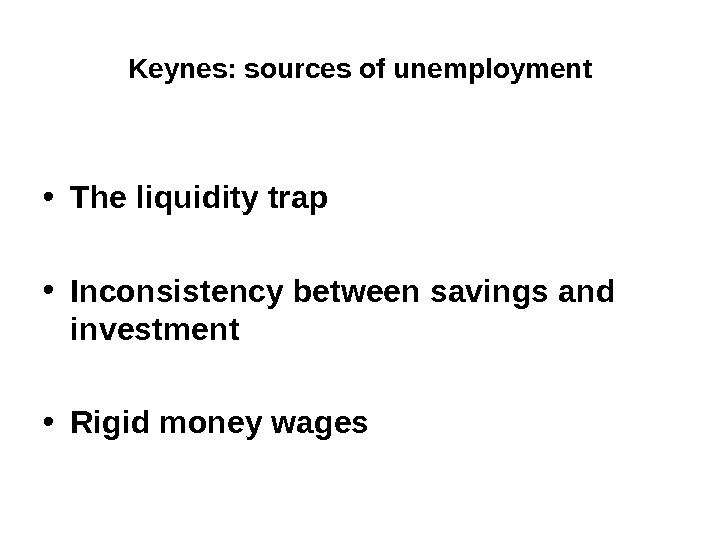
 Keynes: sources of unemployment • The liquidity trap • Inconsistency between savings and investment • Rigid money wages
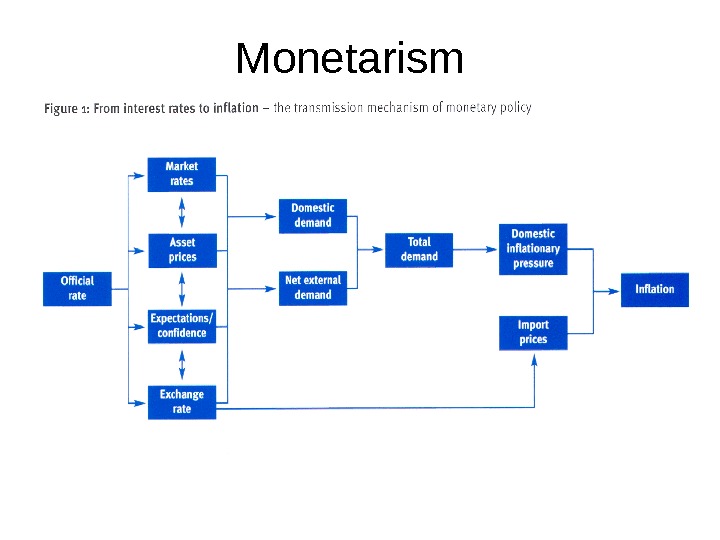
 Monetarism
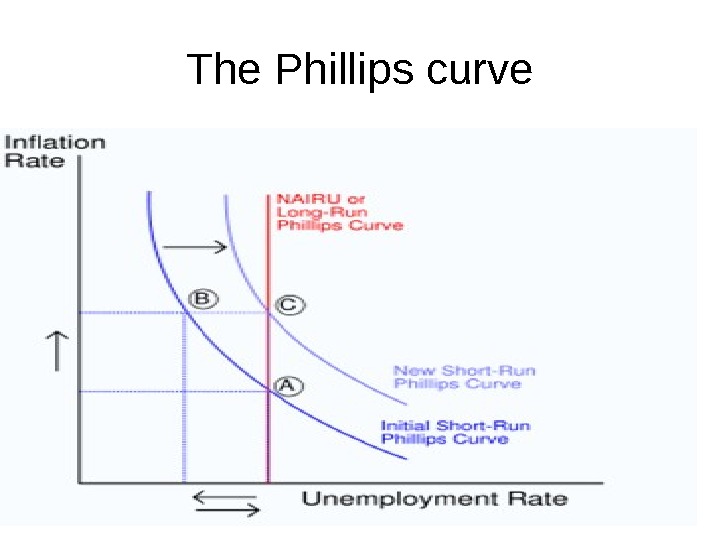
 The Phillips curve
 Project Management October 2014 part 7 Micro-foundations Costs Revenues Risk
 NPV AND NCF NET PRESENT VALUE and NET CASH FLOW • Net Present Value • Net Cash Flow • Fundamental Equation П (t) = R(t) – C(t) = W&S(t) + M(t) + I(t) – D(t) +[rd(t) +re(t )] robindcmatthews
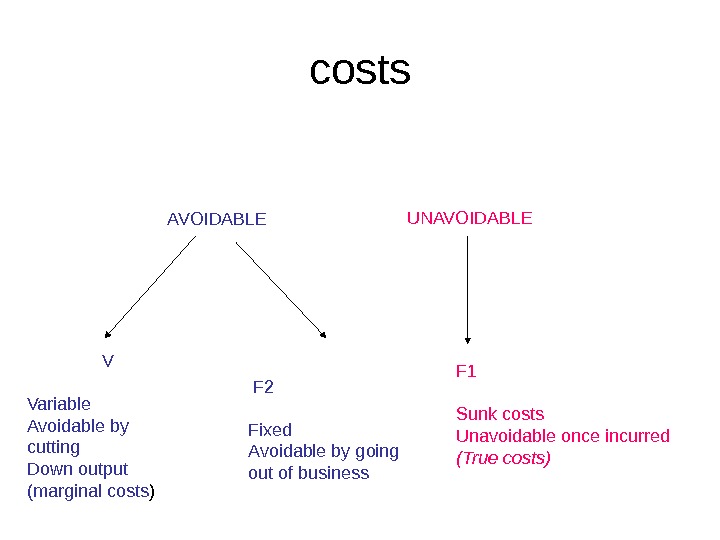
 costs AVOIDABLE UNAVOIDABLE F 1 Sunk costs Unavoidable once incurred (True costs) V Variable Avoidable by cutting Down output (marginal costs ) F 2 Fixed Avoidable by going out of business
 Scale and scope economies • Leveraging • Outsourcing • Restructuring
 Marketing segmentation
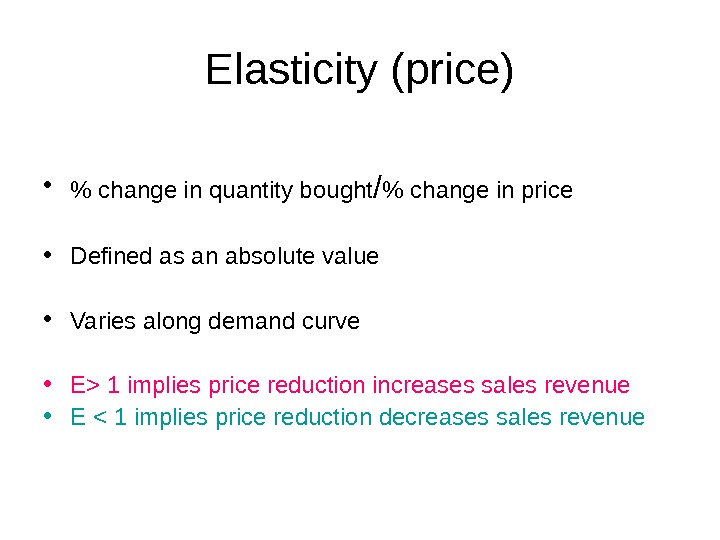
 Elasticity (price) • % change in quantity bought / % change in price • Defined as an absolute value • Varies along demand curve • E> 1 implies price reduction increases sales revenue • E < 1 implies price reduction decreases sales revenue
 Effect on sales revenue of price reduction Effect on sales revenue of a price increase Elastic Ep >1 Sales Revenue RISES Sales Revenue FALLS Inelastic Ep <1 Sales Revenue FALLS Sales Revenue RISES
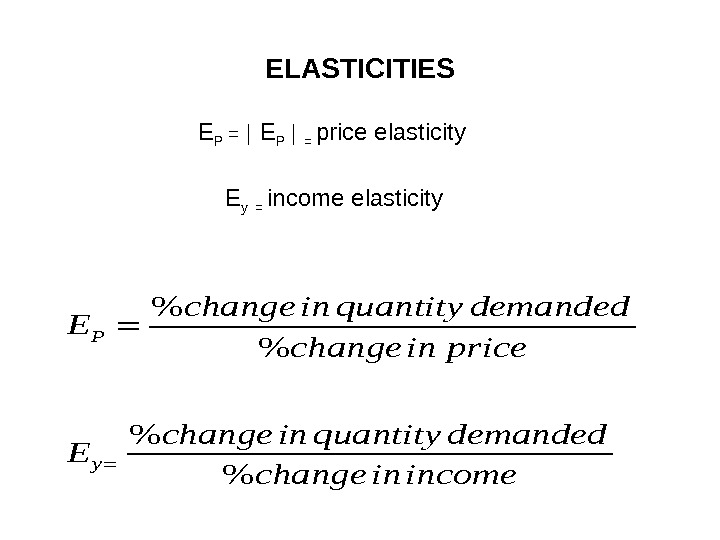
 ELASTICITIES% % P y change in quantity demanded E change in price change in quantity demanded E change in income E P = │ E P │ = price elasticity E y = income elasticity
 P y p dq E q dp y dq E q dy
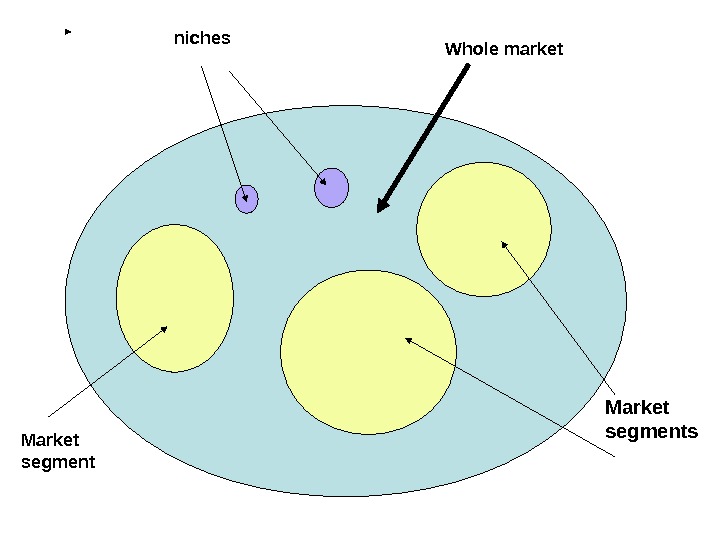
 niches Market segment Whole market
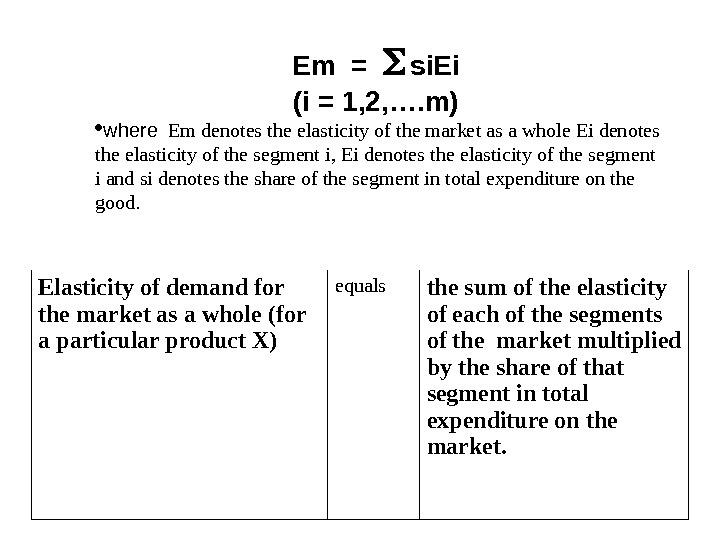
 Em = si. Ei (i = 1, 2, …. m) where Em denotes the elasticity of the market as a whole Ei denotes the elasticity of the segment i, Ei denotes the elasticity of the segment i and si denotes the share of the segment in total expenditure on the good. Elasticity of demand for the market as a whole (for a particular product X) equals the sum of the elasticity of each of the segments of the market multiplied by the share of that segment in total expenditure on the market.

