
Презентация по GC-1000S Mark II


- Размер: 22.7 Mегабайта
- Количество слайдов: 128
Описание презентации Презентация по GC-1000S Mark II по слайдам
1 ОАО Салаватнефтеоргсинтез Промышленный хроматограф GC 1000 M ark-II фирмы Yokogawa
2 ОАО Салаватнефтеоргсинтез
3 Будущее хроматографии Хроматограф GC 1000 Mark-II фирмы Yokogawa
4 GC 1000 Mark-II
5 Газовый Хроматография chromatos = = цвет graphein = = писать
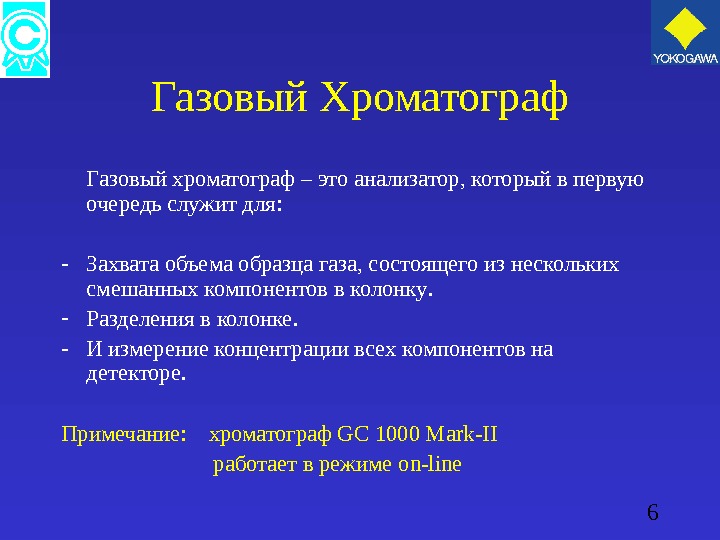
6 Газовый Хроматограф Газовый хроматограф – это анализатор, который в первую очередь служит для : — Захвата объема образца газа, состоящего из нескольких смешанных компонентов в колонку. — Разделения в колонке. — И измерение концентрации всех компонентов на детекторе. Примечание : хроматограф GC 1000 Mark-II работает в режиме on-line
7 Газовый хроматограф Промышленный газовый хроматограф состоит из : — Загрузочного устройства — Колонки — Детектора
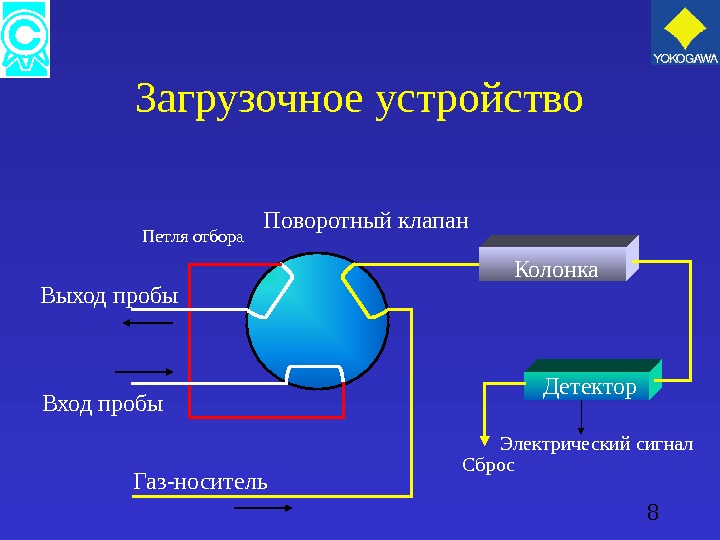
8 Загрузочное устройство Колонка Детектор Электрический сигнал Сброс. Вход пробы. Выход пробы Газ-носитель Поворотный клапан Петля отбора
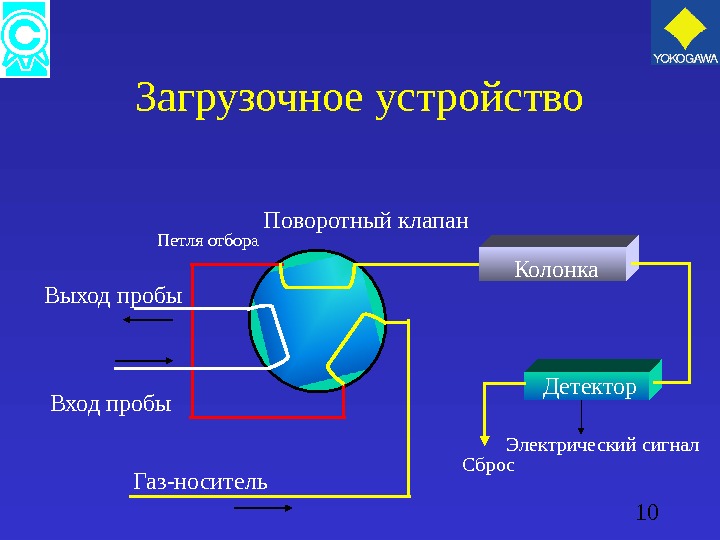
9 Загрузочное устройство • Отбор пробы осуществляется переключением загрузочного клапана. • Загрузочный клапан позволяет измеряемому газу пройти через петлю инъекции (доза). • При отборе, проба подхватывается газом-носителем и идет в колонку.
10 Загрузочное устройство Колонка Детектор Электрический сигнал Сброс. Вход пробы. Выход пробы Газ-носитель Поворотный клапан Петля отбора
11 Загрузочное устройство Есть два важных момента относительно загрузки пробы : — Постоянное значение температуры и давления. При отборе объем пробы должен быть постоянным. — Проба должна быть взята быстро и надежно. Обеспечить постоянное течение измеряемого газа по петле.
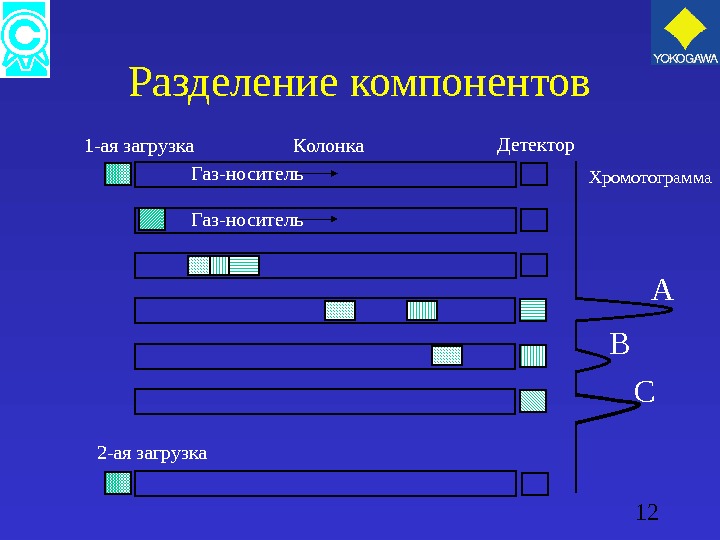
12 Разделение компонентов A B CХромотограмма. Колонка 1 -ая загрузка Газ-носитель 2 -ая загрузка Детектор
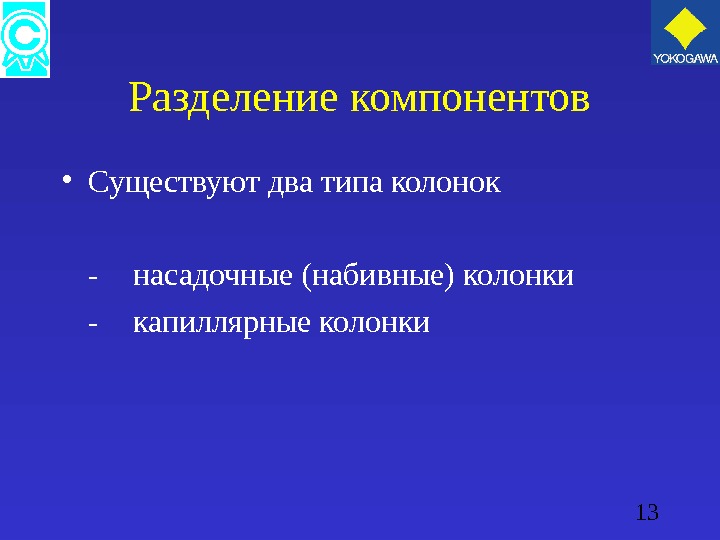
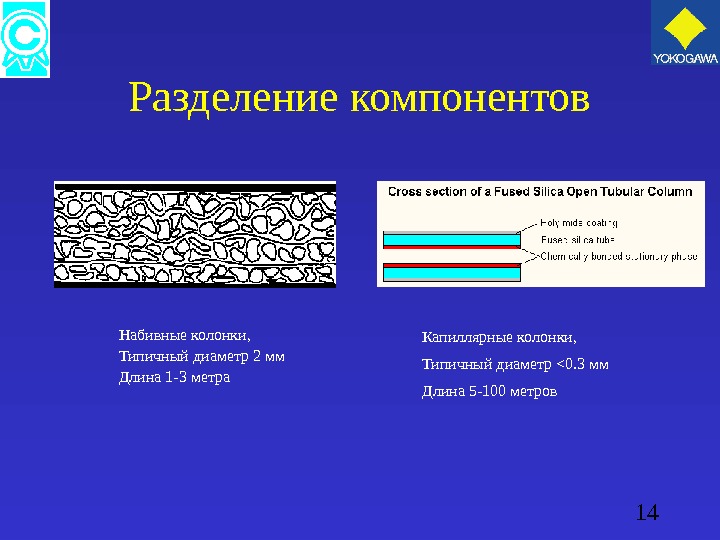
13 Разделение компонентов • Существуют два типа колонок — насадочные (набивные) колонки — капиллярные колонки
14 Разделение компонентов Капиллярные колонки , Типичный диаметр <0. 3 мм Длина 5 -100 метров Набивные колонки , Типичный диаметр 2 мм Длина 1 -3 метра
15 Набивные колонки Набивная колонка-наиболее распространенный вид колонки и изготавливается из нержавеющей трубки. Размер : диаметр 2 мм длина от 0, 2 до 2 м Неподвижная фаза : сорбент
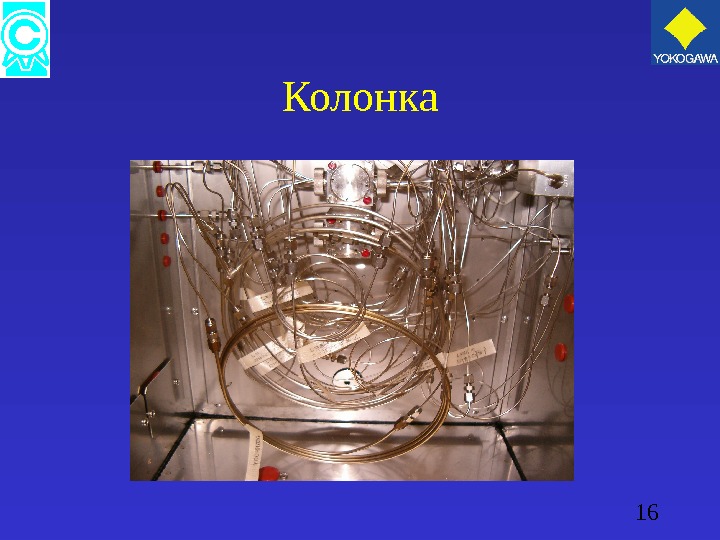
16 Колонка
17 Детектор После разделения в колонке компоненты направляются на детектор где определяется их концентрация. Хроматограф GC 1000 может оснащаться тремя типами детекторов : — Детектор по теплопроводности ( ДТП ). — Пламенно-ионизационный детектор ( ПИД ) — Пламенно-фотометрический детектор ( ПФД )
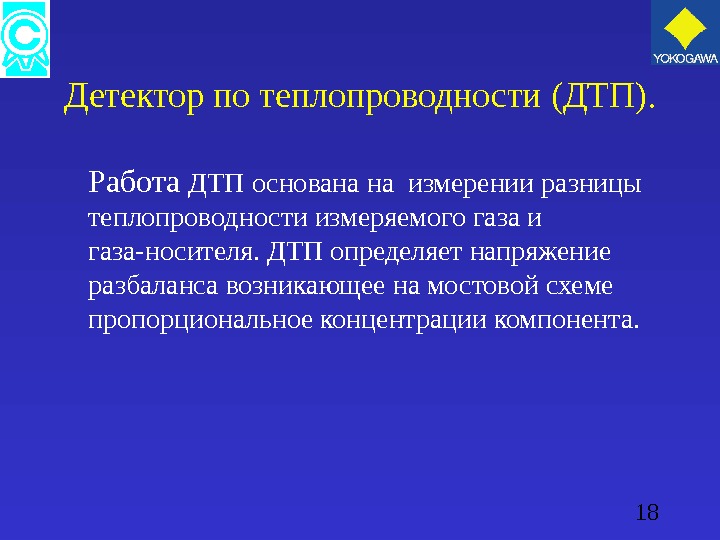
18 Детектор по теплопроводности ( ДТП ). Работа ДТП основана на измерении разницы теплопроводности измеряемого газа и газа-носителя. ДТП определяет напряжение разбаланса возникающее на мостовой схеме пропорциональное концентрации компонента.
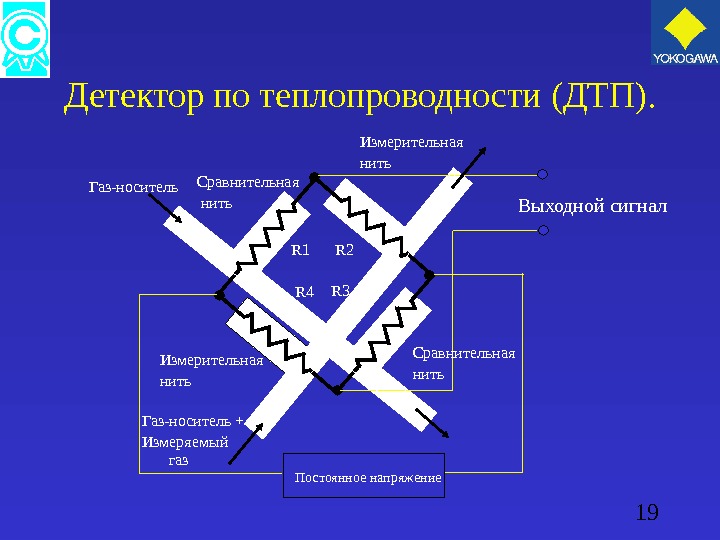
19 Детектор по теплопроводности ( ДТП ). Постоянное напряжение Выходной сигнал. Сравнительная нить Измерительная нить Сравнительная нить. Измерительная нить R 1 R 2 R 4 R 3 Газ-носитель + Измеряемый газ
20 Детектор по теплопроводности ( ДТП ).
21 Детектор по теплопроводности ( ДТП ).
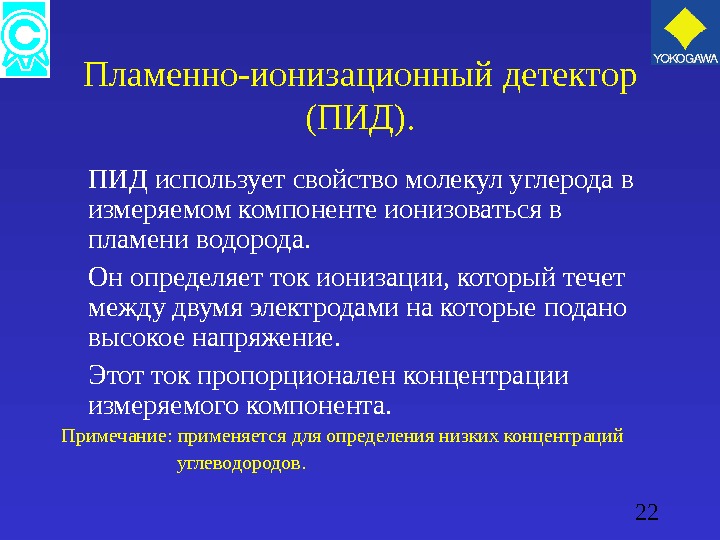
22 Пламенно-ионизационный детектор ( ПИД ). ПИД использует свойство молекул углерода в измеряемом компоненте ионизоваться в пламени водорода. Он определяет ток ионизации, который течет между двумя электродами на которые подано высокое напряжение. Этот ток пропорционален концентрации измеряемого компонента. Примечание : применяется для определения низких концентраций углеводородов.
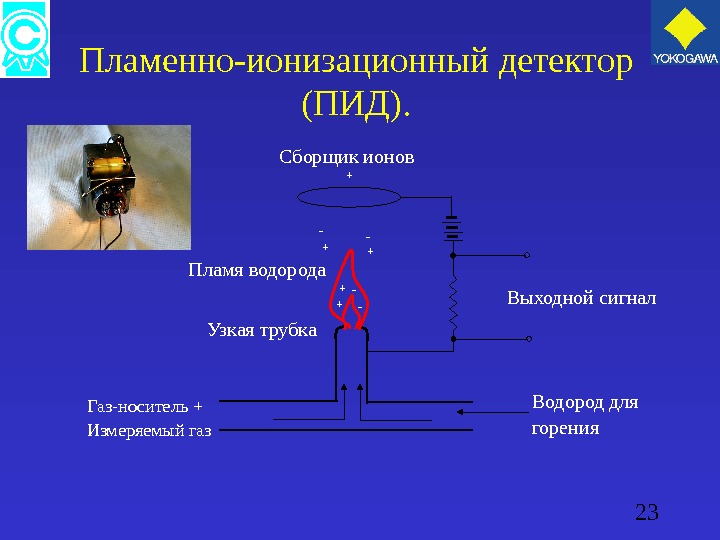
23 Пламенно-ионизационный детектор ( ПИД ). Пламя водорода Узкая трубка Газ-носитель + Измеряемый газ Водород для горения. Выходной сигнал+ ++ ++ — — -Сборщик ионов
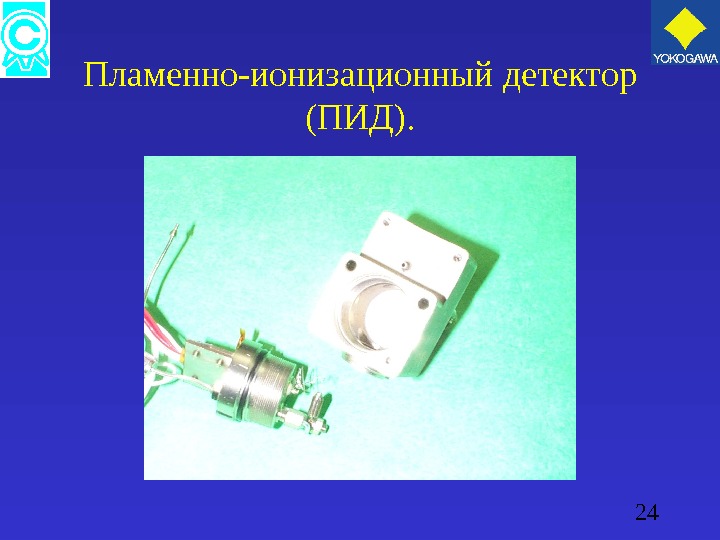
24 Пламенно-ионизационный детектор ( ПИД ).
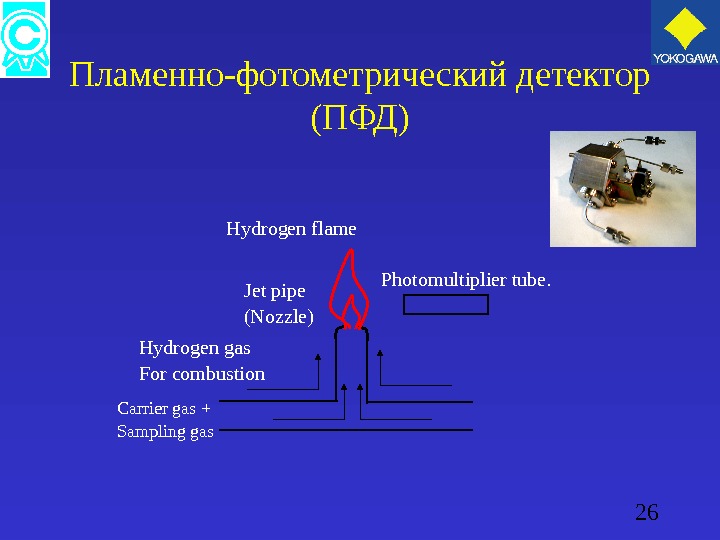
25 Flame photometric detector (FPD) The FPD is using a photometric detector. As the gas containing a sulfur component is let into the excess hydrogen flame, the component containing sulfur atoms is excited. The FPD detects the luminous intensity of the light emitted when this excited component return to its base state using multiplier phototube and converts it to a voltage.
26 Пламенно-фотометрический детектор ( ПФД ) Photomultiplier tube. Hydrogen flame Jet pipe (Nozzle) Hydrogen gas For combustion Carrier gas + Sampling gas
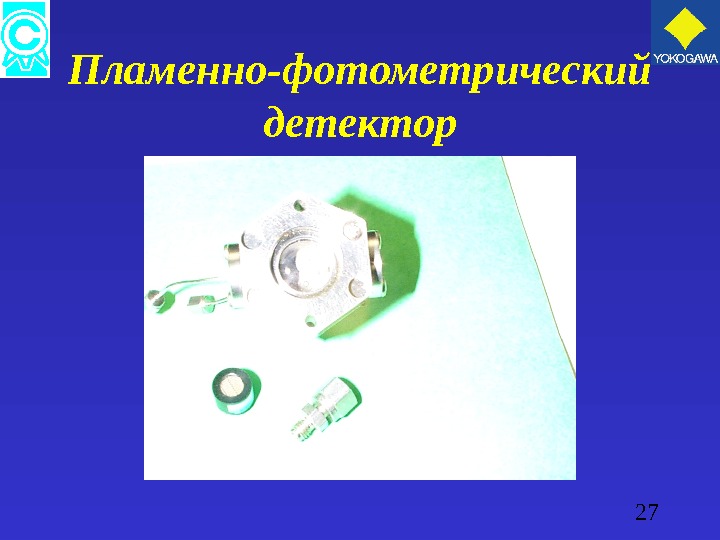
27 Пламенно-фотометрический детектор
28 1. Components and their Functions. The GC 1000 consist of the following items; 1. 1 Protection system. 1. 2 Electronic system. 1. 3 Pressure and flow control section. 1. 4 Isotherm oven. 1. 5 Valves
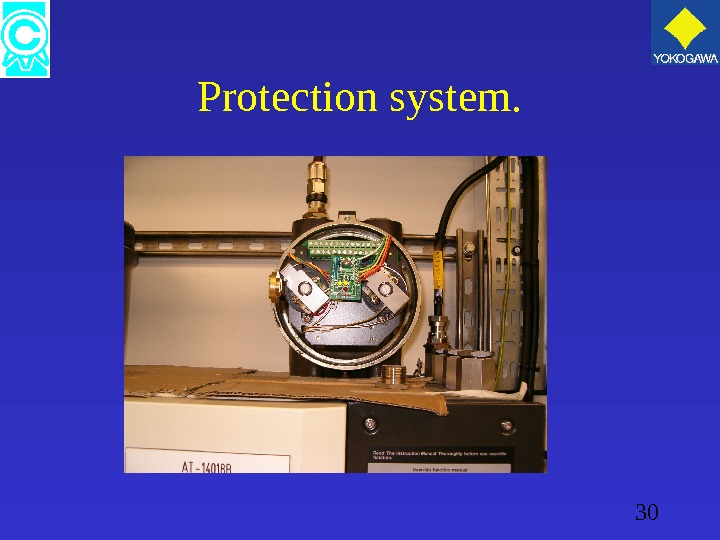
29 1. 1 Protection system. • Explosion proof construction with a built-in protection system. • Power relay, timer, override switch etc. are internal to the instrument. • System is monitoring
30 Protection system.
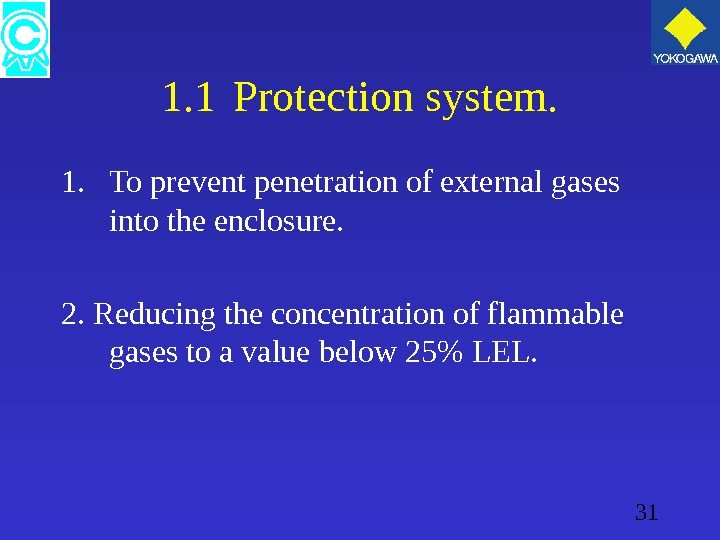
31 1. 1 Protection system. 1. To prevent penetration of external gases into the enclosure. 2. Reducing the concentration of flammable gases to a value below 25% LEL.
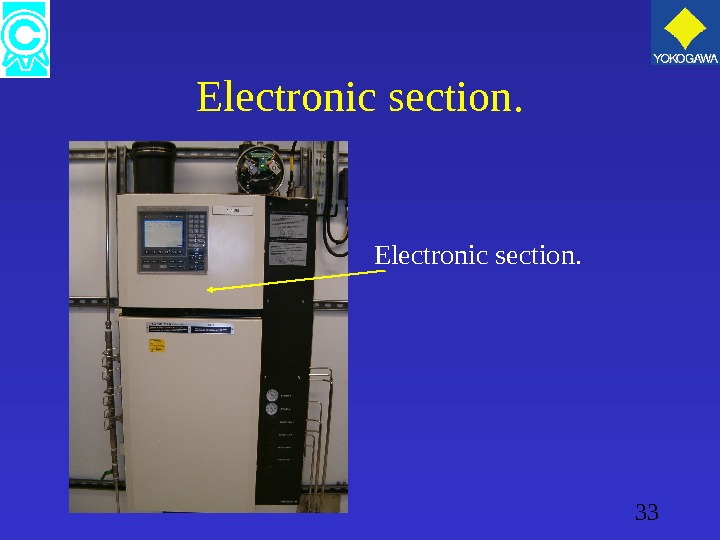
32 1. 2 Electronic section. • Pressurized protection/purge structure. • Control center of the GC; 1. Drives all valves. 2. Issues miscellaneous command signals for analysis sequence. 3. Direct key entry on the display for manually control.
33 Electronic section.
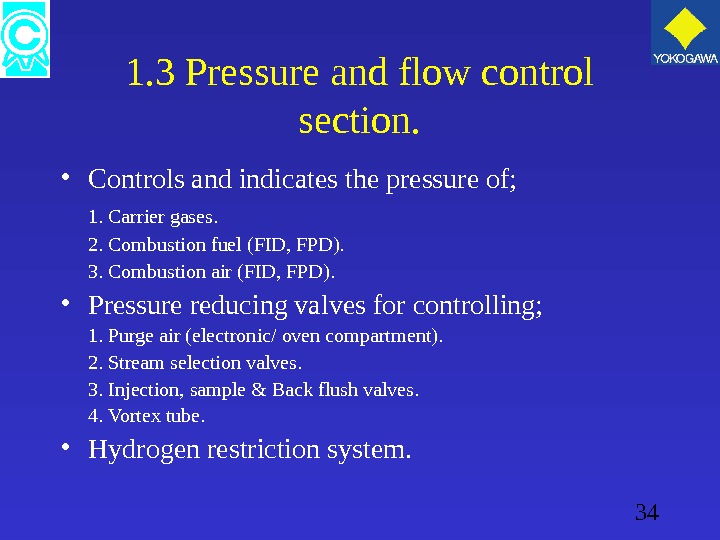
34 1. 3 Pressure and flow control section. • Controls and indicates the pressure of; 1. Carrier gases. 2. Combustion fuel (FID, FPD). 3. Combustion air (FID, FPD). • Pressure reducing valves for controlling; 1. Purge air (electronic/ oven compartment). 2. Stream selection valves. 3. Injection, sample & Back flush valves. 4. Vortex tube. • Hydrogen restriction system.
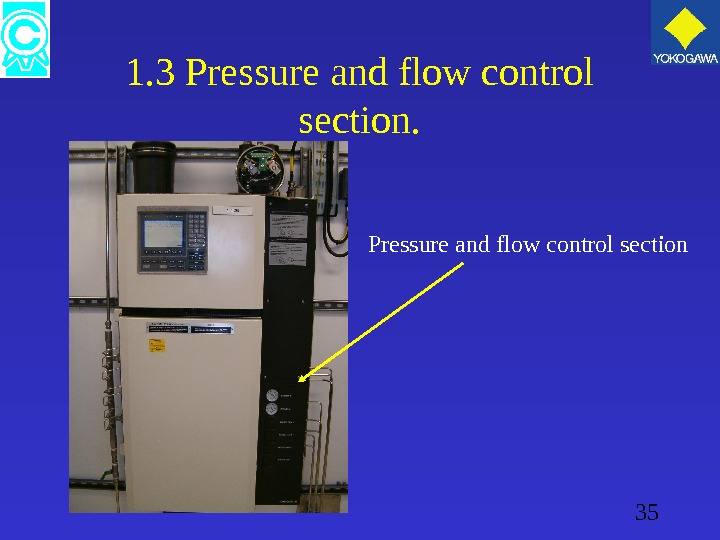
35 1. 3 Pressure and flow control section
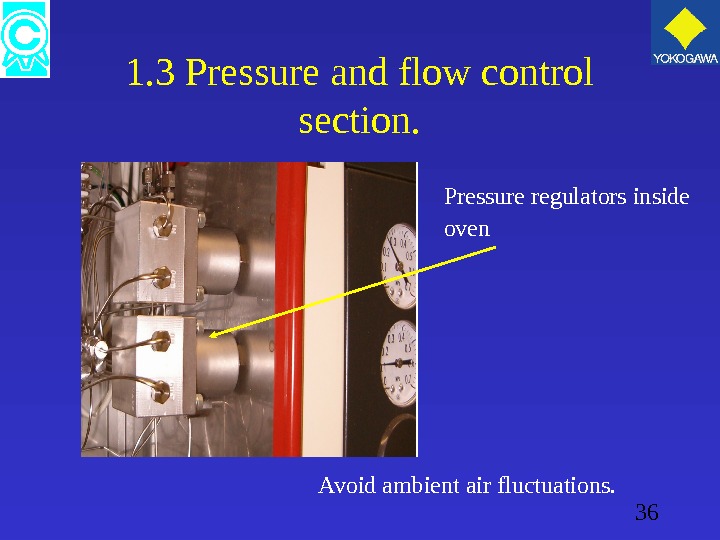
36 1. 3 Pressure and flow control section. Pressure regulators inside oven Avoid ambient air fluctuations.
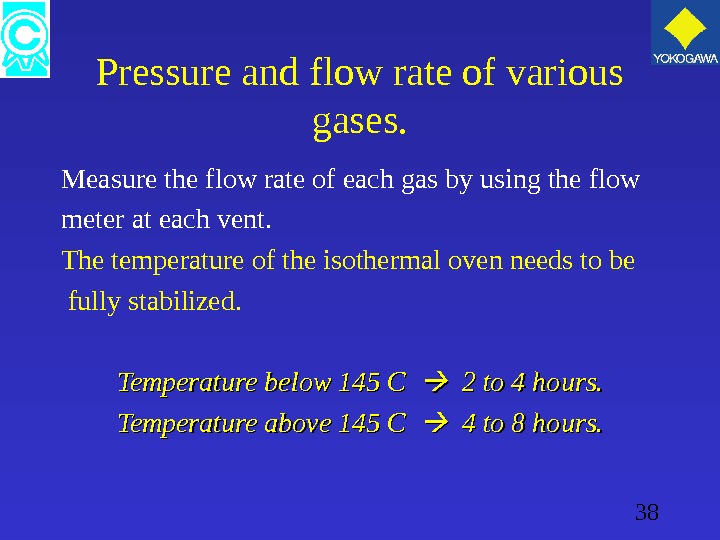
37 Pressure and flow rate of various gases. Normal analysis is impossible unless each gas is set to the specified value. Carrier gas, Combustion gas / air. Set the values shown in “ Operation condition set ”.
38 Pressure and flow rate of various gases. Measure the flow rate of each gas by using the flow meter at each vent. The temperature of the isothermal oven needs to be fully stabilized. Temperature below 145 C 2 to 4 hours. Temperature above 145 C 4 to 8 hours.
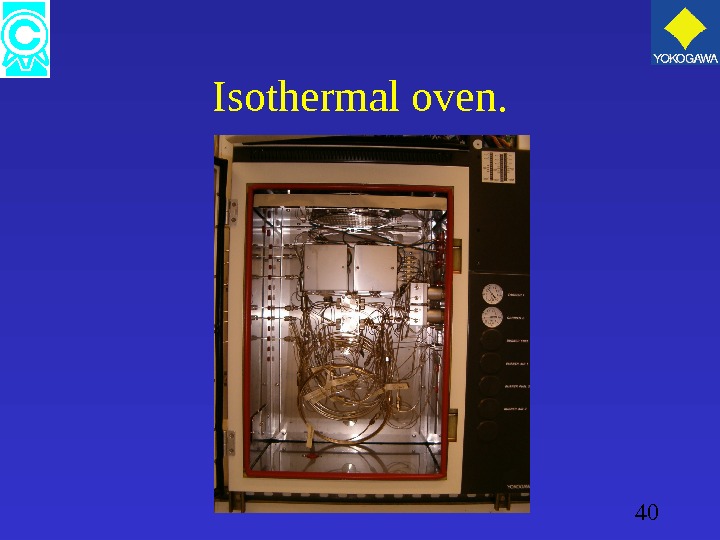
39 1. 4 Isothermal oven. • Pressurized protection / Purge structure. • Fixed temperature (one degree intervals). • Contains; 1. Sample & back flush valves. 2. Detectors. 3. Columns. 4. Restrictors.
40 Isothermal oven.
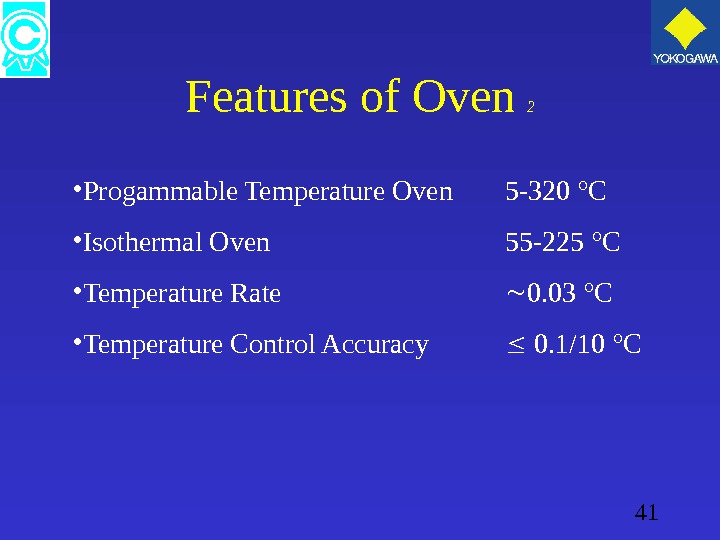
41 Features of Oven 2 • Progammable Temperature Oven 5 -320 °C • Isothermal Oven 55 -225 °C • Temperature Rate 0. 03 °C • Temperature Control Accuracy 0. 1/10 °
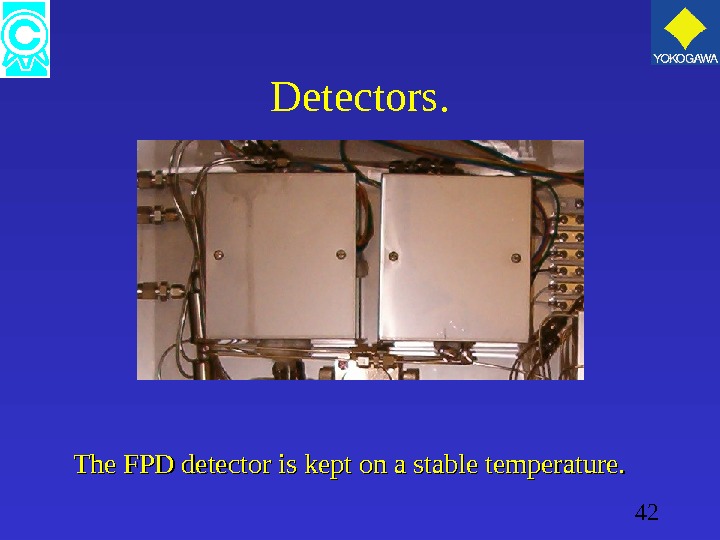
42 Detectors. The FPD detector is kept on a stable temperature.
43 1. 5 Valves. • Liquid Sampling Valve • Column Switching Valve • Stream valves.
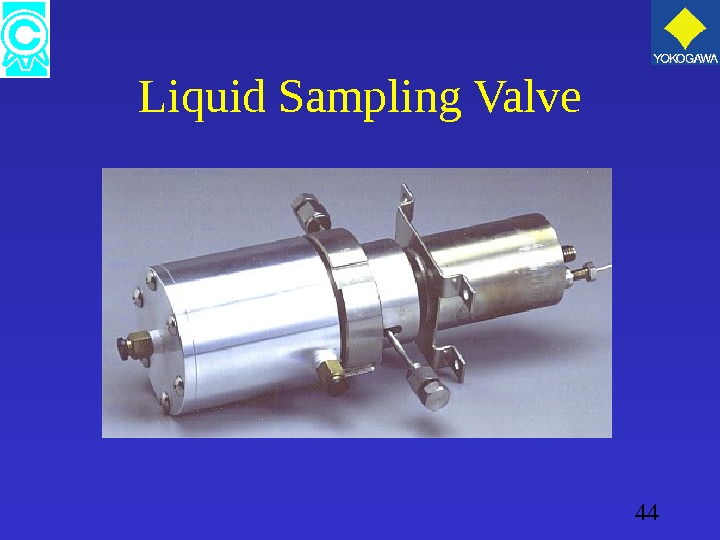
44 Liquid Sampling Valve
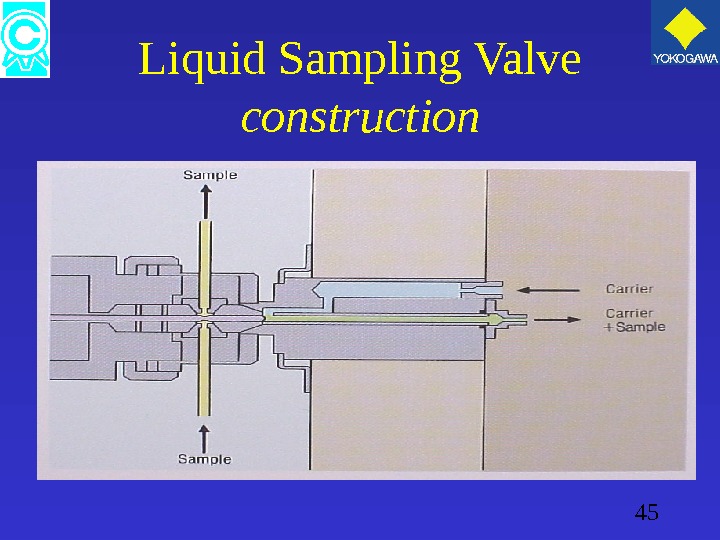
45 Liquid Sampling Valve construction
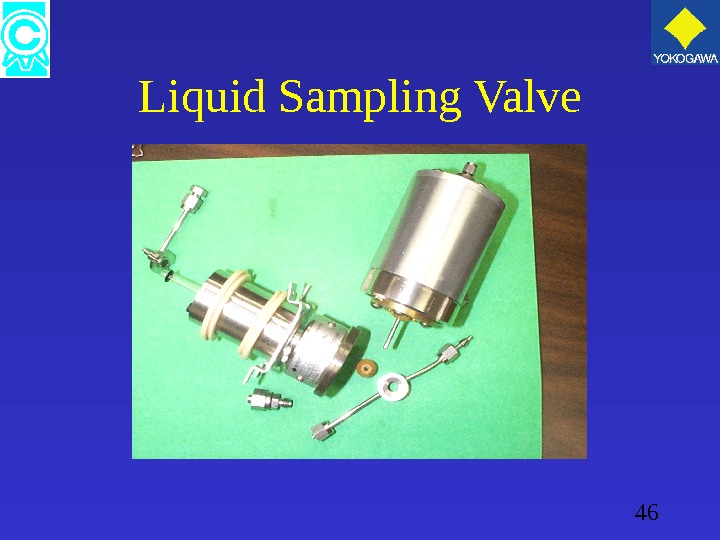
46 Liquid Sampling Valve
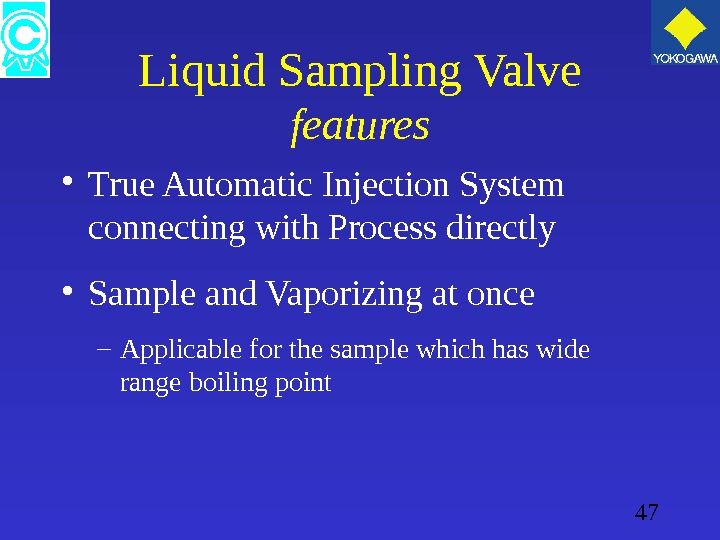
47 Liquid Sampling Valve features • True Automatic Injection System connecting with Process directly • Sample and Vaporizing at once – Applicable for the sample which has wide range boiling point
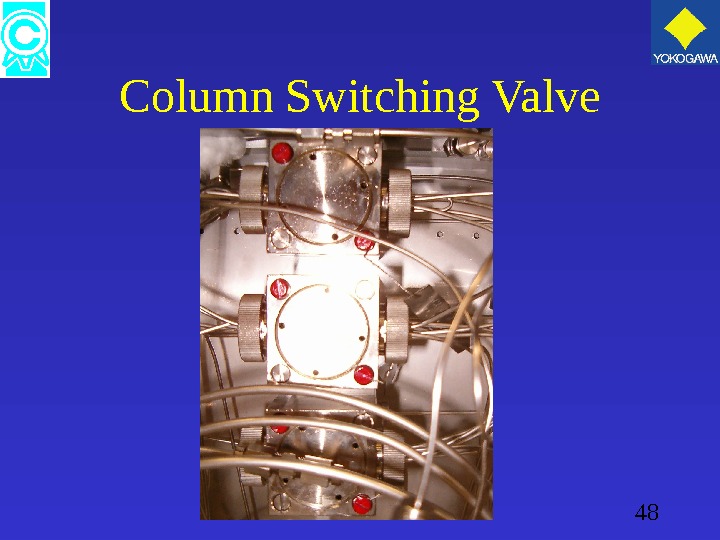
48 Column Switching Valve
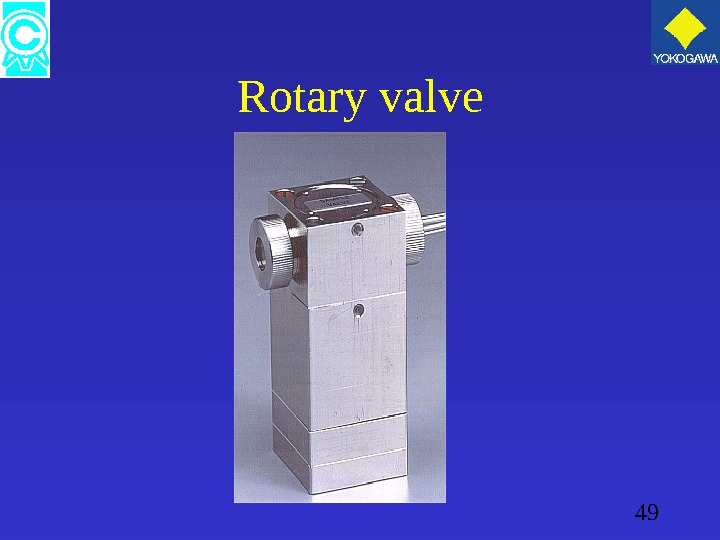
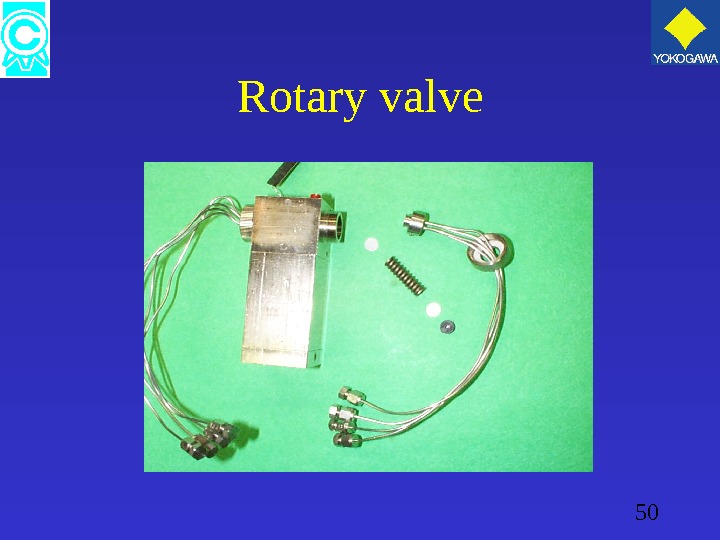
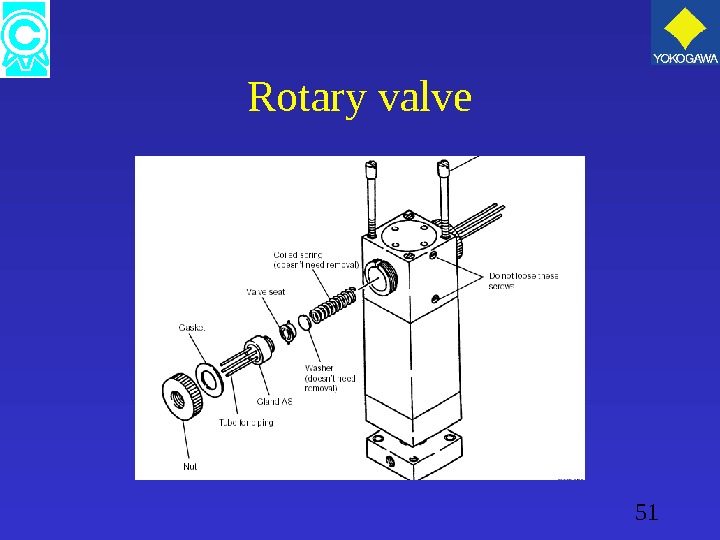
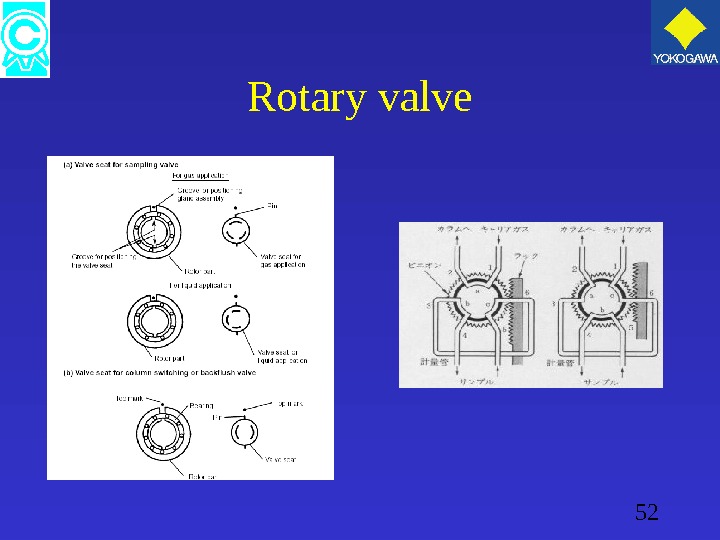
49 Rotary valve
50 Rotary valve
51 Rotary valve
52 Rotary valve
53 • Liquid injection valve > 50. 000 movements • Example: cycle time 10 minutes = 347 days • Rotary valve, injection- and column switching valve > 100. 000 movements. Long life valves recommend preventive replacements of seals Yokogawa Valves Strong Mechanical Design Technology
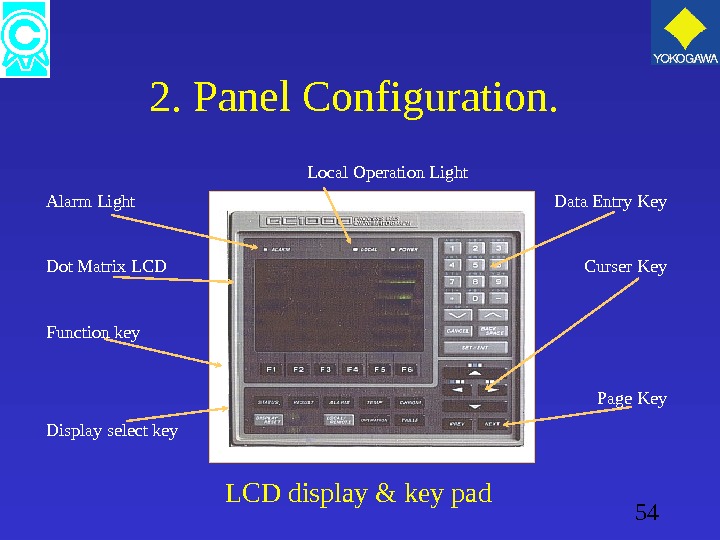
54 2. Panel Configuration. Alarm Light Dot Matrix LCD Function key Display select key Data Entry Key Curser Key Page Key. Local Operation Light LCD display & key pad
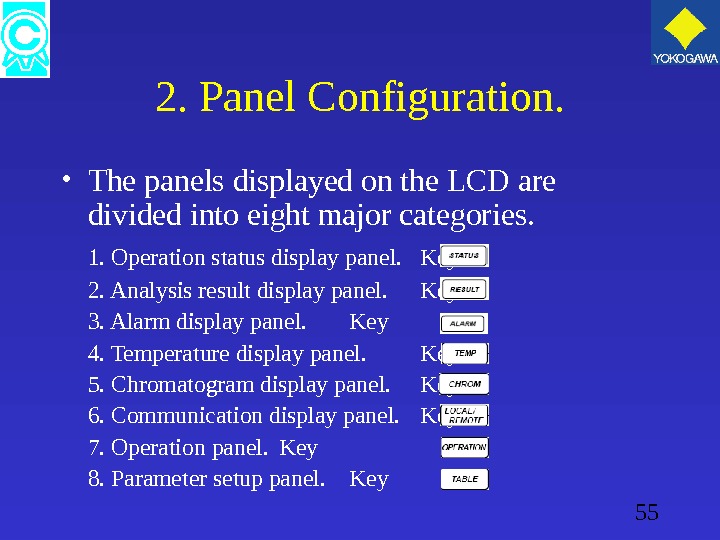
55 2. Panel Configuration. • The panels displayed on the LCD are divided into eight major categories. 1. Operation status display panel. Key 2. Analysis result display panel. Key 3. Alarm display panel. Key 4. Temperature display panel. Key 5. Chromatogram display panel. Key 6. Communication display panel. Key 7. Operation panel. Key 8. Parameter setup panel. Key
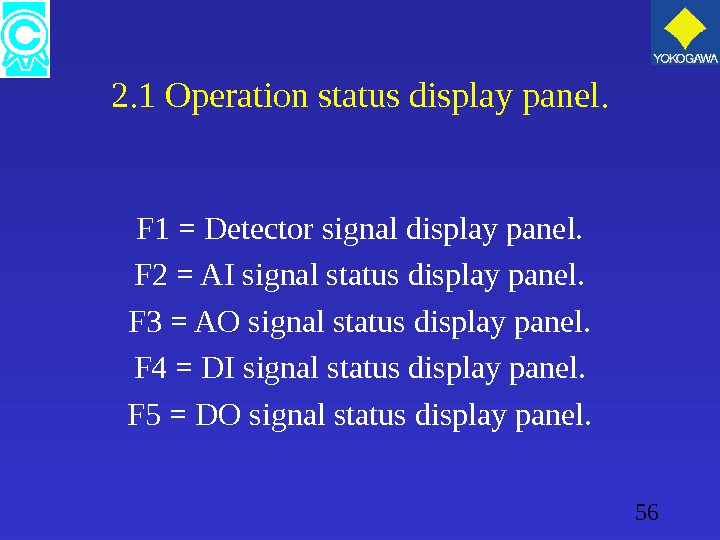
56 2. 1 Operation status display panel. F 1 = Detector signal display panel. F 2 = AI signal status display panel. F 3 = AO signal status display panel. F 4 = DI signal status display panel. F 5 = DO signal status display panel.
57 2. 1. 1 Detector signal display panel. Page 1: Detector 1 Page 2 : Detector
58 Detector signal display panel. • Input signal: Value obtained by A-D conversion of the detector’s analog signal • Filter signal: Value obtained by filtering the input signal with the value set as “filter const” in the detector signal settings and average with the value set as the “sample rate”. • Std deviation: The standard deviation of the last 20 input signals.
59 Detector signal display panel. • Flame level: FPD measures the flame temperature with a thermocouple and identifies flame on / off with this value. • Therm. signal: Output value of thermocouple. Flow rate carrier 50 ml/min 3 to 5 m. V
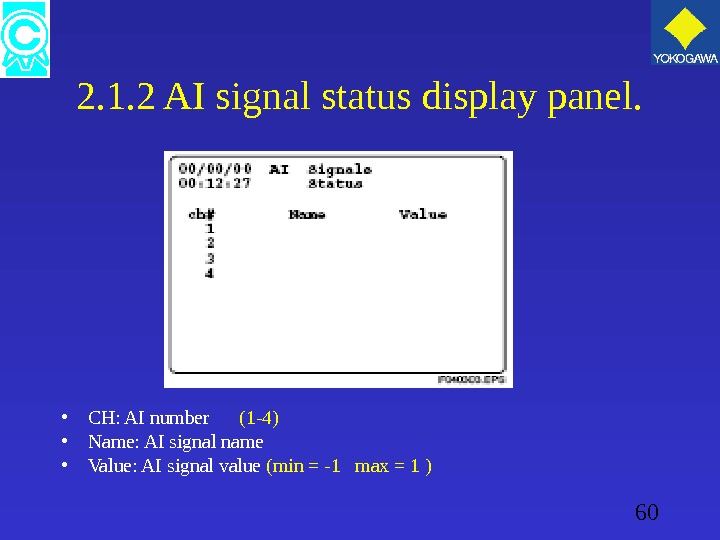
60 2. 1. 2 AI signal status display panel. • CH: AI number (1 -4) • Name: AI signal name • Value: AI signal value (min = -1 max = 1 )
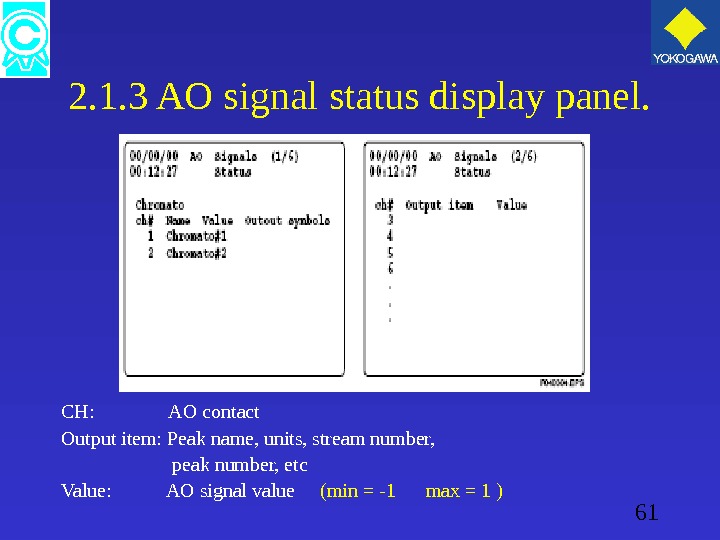
61 2. 1. 3 AO signal status display panel. CH: AO contact Output item: Peak name, units, stream number, peak number, etc Value: AO signal value (min = -1 max = 1 )
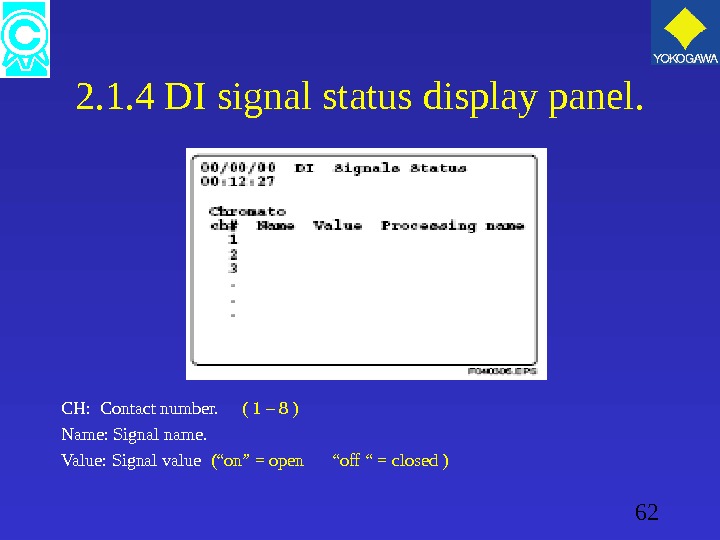
62 2. 1. 4 DI signal status display panel. CH: Contact number. ( 1 – 8 ) Name: Signal name. Value: Signal value (“on” = open “off “ = closed )
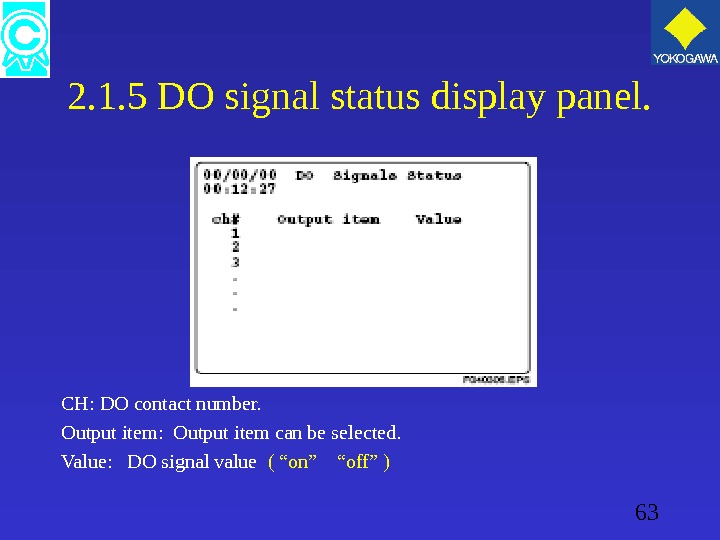
63 2. 1. 5 DO signal status display panel. CH: DO contact number. Output item: Output item can be selected. Value: DO signal value ( “on” “off” )
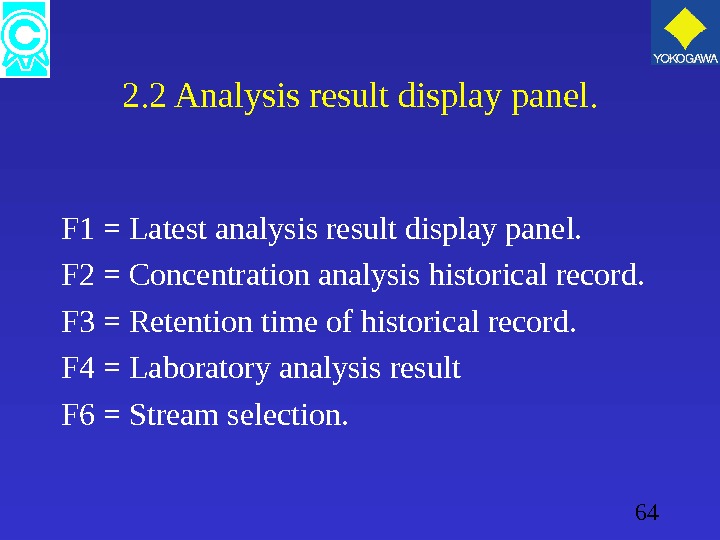
64 2. 2 Analysis result display panel. F 1 = Latest analysis result display panel. F 2 = Concentration analysis historical record. F 3 = Retention time of historical record. F 4 = Laboratory analysis result F 6 = Stream selection.
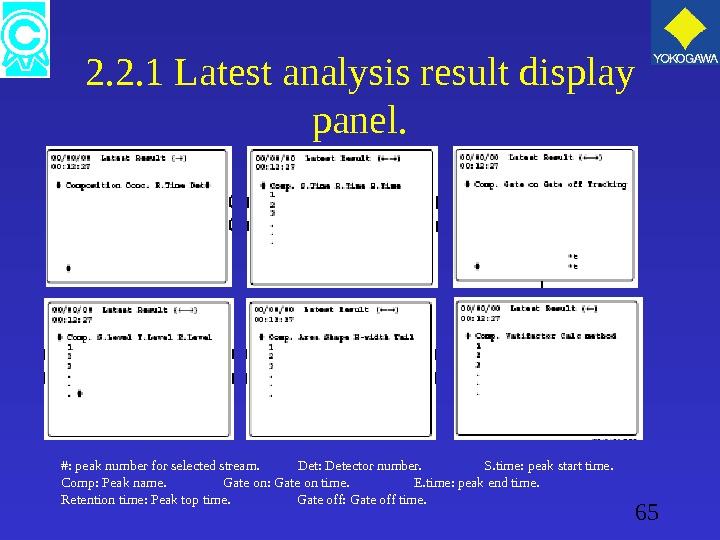
65 2. 2. 1 Latest analysis result display panel. #: peak number for selected stream. Det: Detector number. S. time: peak start time. Comp: Peak name. Gate on: Gate on time. E. time: peak end time. Retention time: Peak top time. Gate off: Gate off time.
66 2. 2. 2 Concentration analysis historical record. #: peak number. Comp: peak name. Before: Concentration value history.
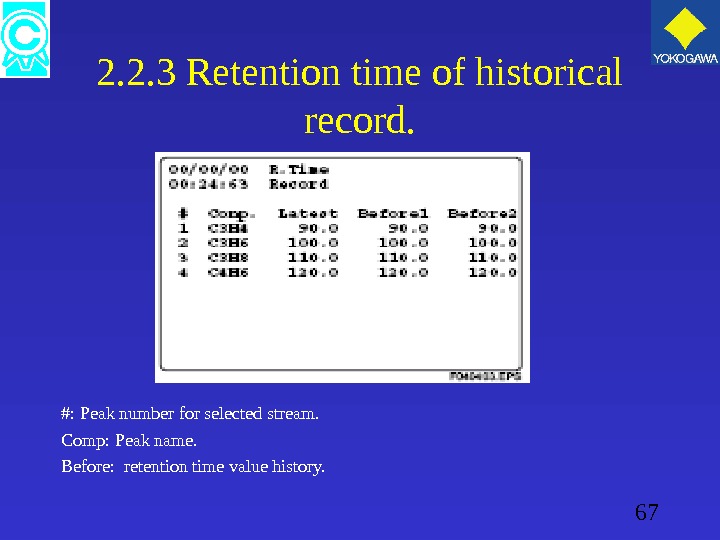
67 2. 2. 3 Retention time of historical record. #: Peak number for selected stream. Comp: Peak name. Before: retention time value history.
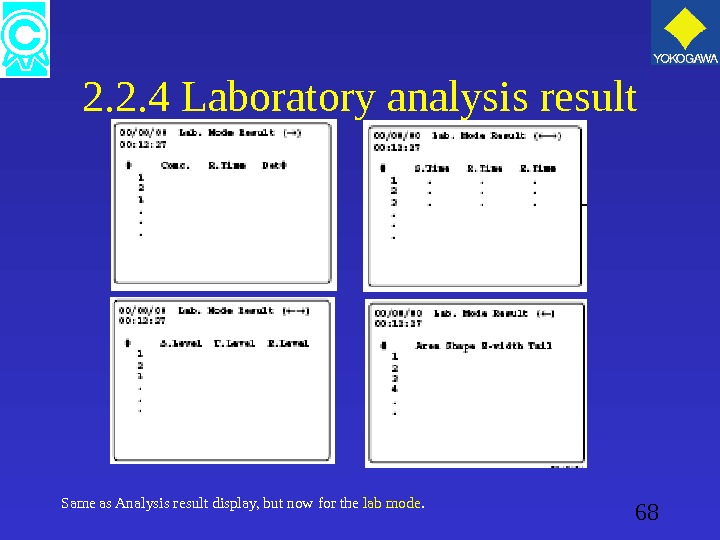
68 2. 2. 4 Laboratory analysis result Same as Analysis result display, but now for the lab mode.
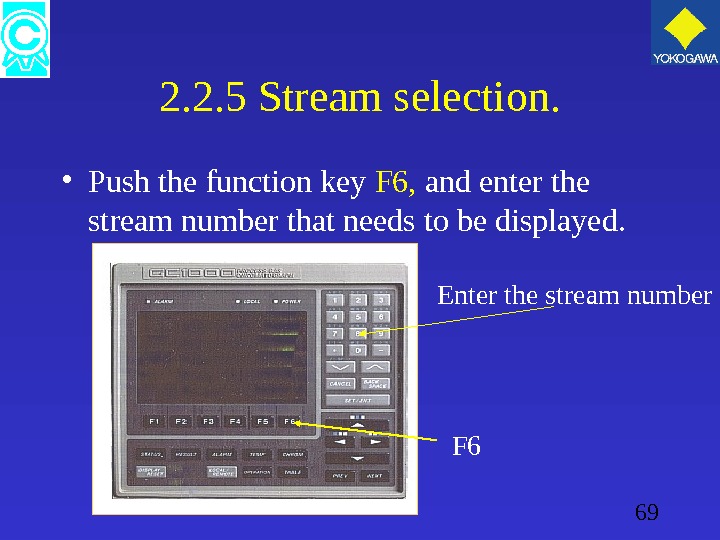
69 2. 2. 5 Stream selection. • Push the function key F 6, and enter the stream number that needs to be displayed. F 6 Enter the stream number
70 2. 3. Alarm Display Panel. F 1 = Alarm display panel. F 2 = Alarm historical display panel.
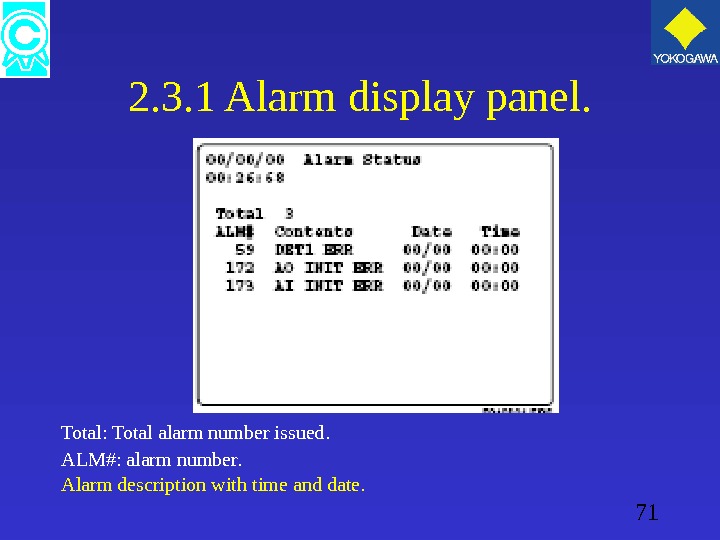
71 2. 3. 1 Alarm display panel. Total: Total alarm number issued. ALM#: alarm number. Alarm description with time and date.
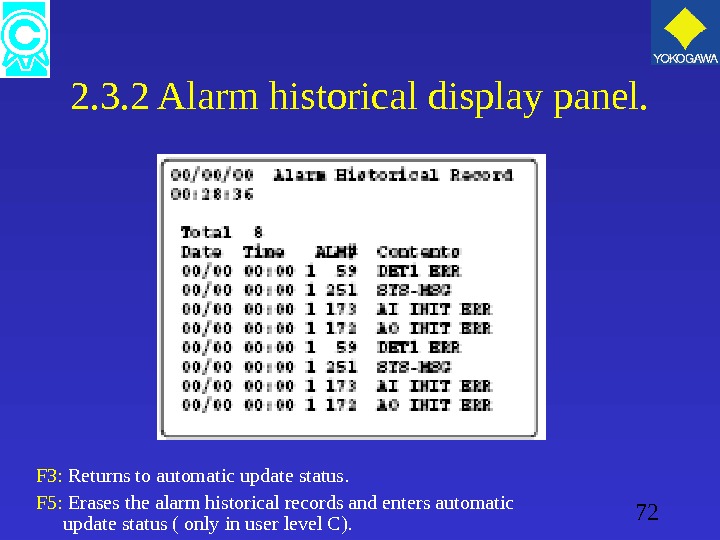
72 2. 3. 2 Alarm historical display panel. F 3: Returns to automatic update status. F 5: Erases the alarm historical records and enters automatic update status ( only in user level C).
73 2. 4 Temperature display panel. F 1 = Temperature Status. F 6 = Temperature set display panel.
74 2. 4. 1 Temperature Status. SV = set point value PV = Process value LSV = Liquid sample valve.
75 2. 4. 2 Temperature set display panel. • Set or change the temperature set point. Only possible in user level
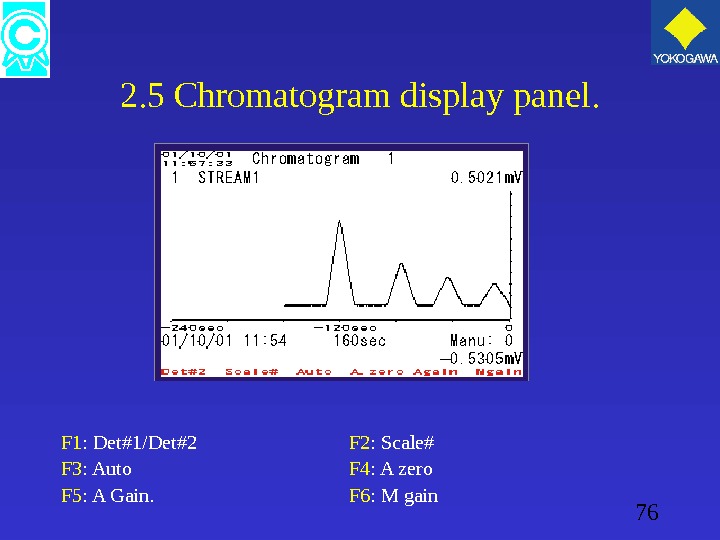
76 2. 5 Chromatogram display panel. F 1 : Det#1/Det#2 F 2 : Scale# F 3 : Auto F 4 : A zero F 5 : A Gain. F 6 : M gain
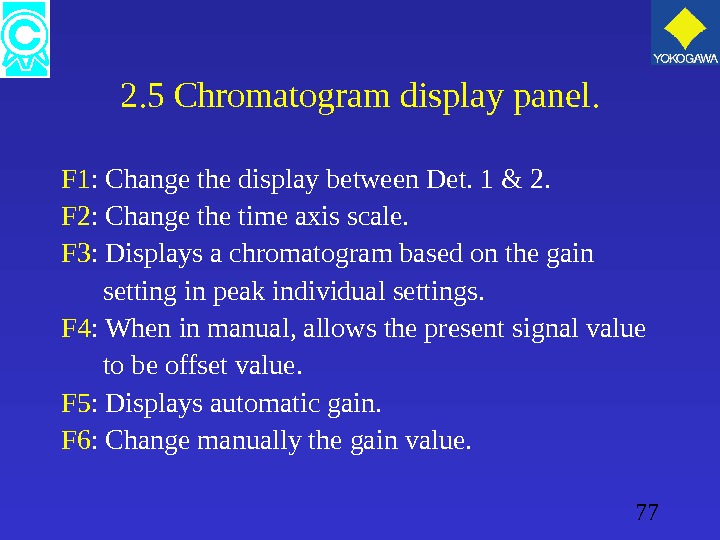
77 2. 5 Chromatogram display panel. F 1 : Change the display between Det. 1 & 2. F 2 : Change the time axis scale. F 3 : Displays a chromatogram based on the gain setting in peak individual settings. F 4 : When in manual, allows the present signal value to be offset value. F 5 : Displays automatic gain. F 6 : Change manually the gain value.
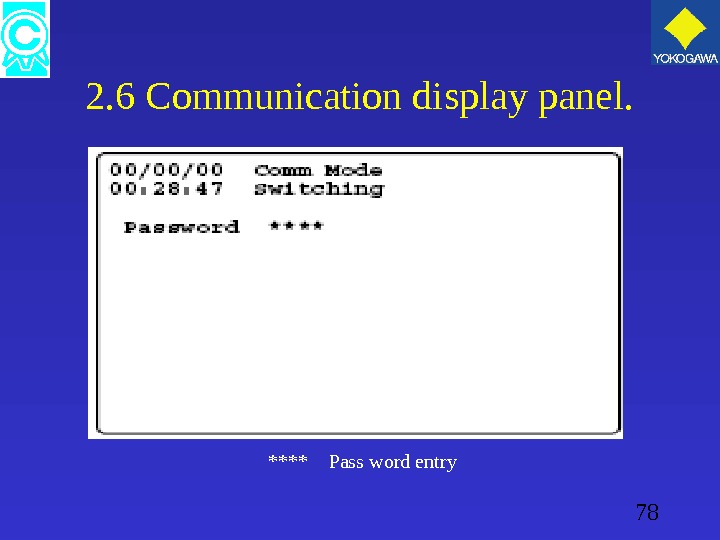
78 2. 6 Communication display panel. **** Pass word entry
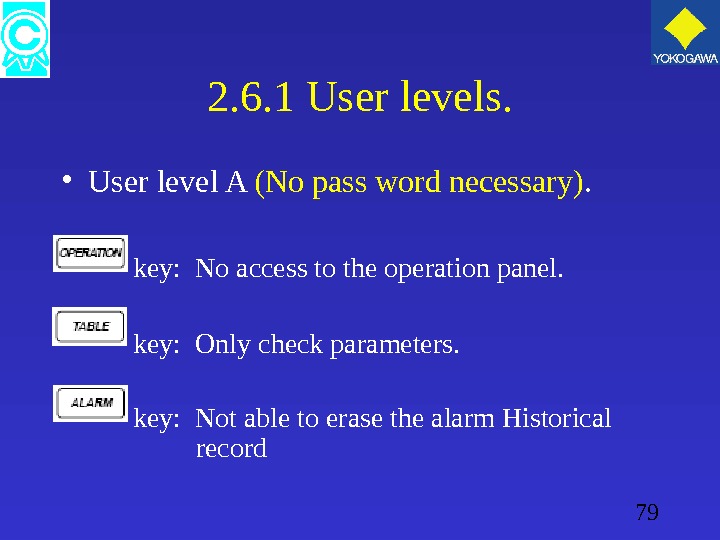
79 2. 6. 1 User levels. • User level A (No pass word necessary). key: No access to the operation panel. key: Only check parameters. key: Not able to erase the alarm Historical record
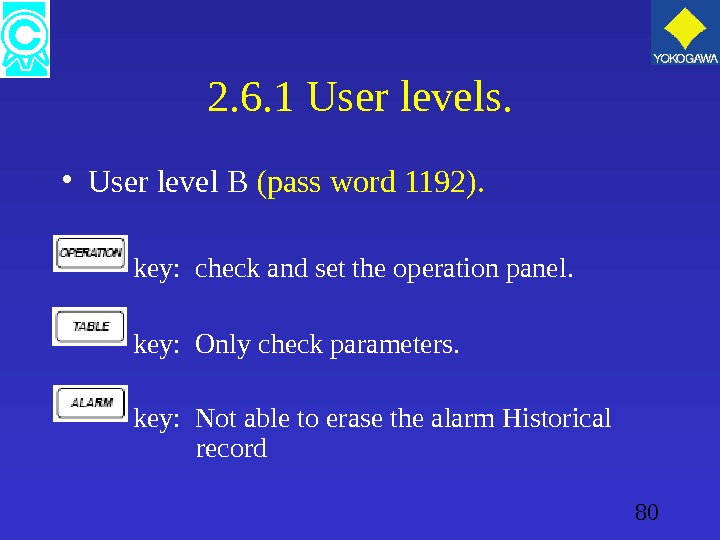
80 2. 6. 1 User levels. • User level B (pass word 1192). key: check and set the operation panel. key: Only check parameters. key: Not able to erase the alarm Historical record
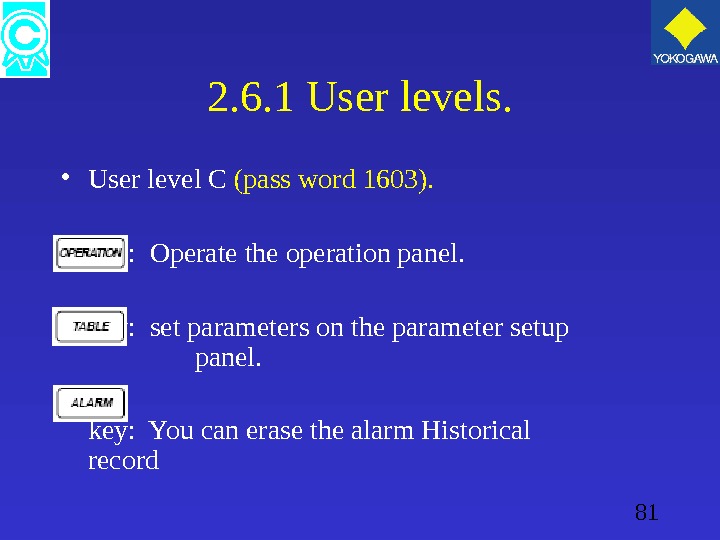
81 2. 6. 1 User levels. • User level C (pass word 1603). key: Operate the operation panel. key: set parameters on the parameter setup panel. key: You can erase the alarm Historical record
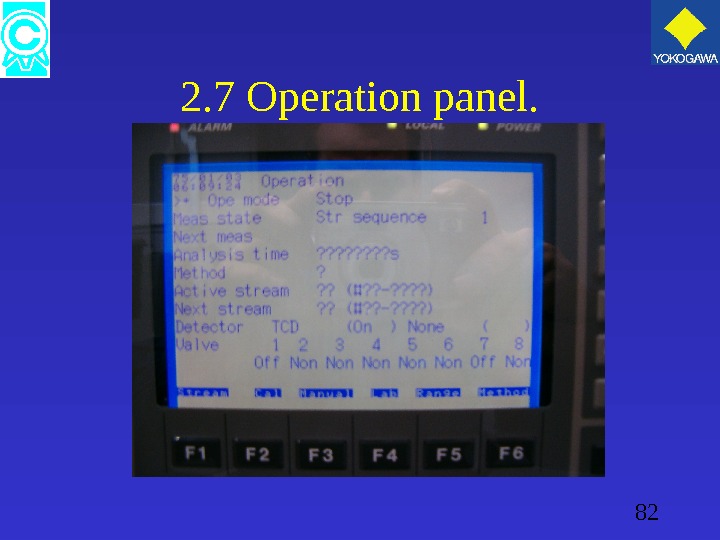
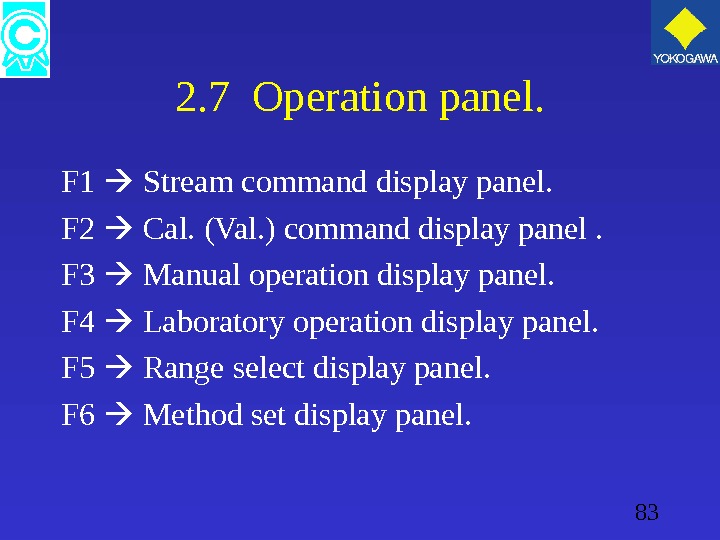
82 2. 7 Operation panel.
83 2. 7 Operation panel. F 1 Stream command display panel. F 2 Cal. (Val. ) command display panel. F 3 Manual operation display panel. F 4 Laboratory operation display panel. F 5 Range select display panel. F 6 Method set display panel.
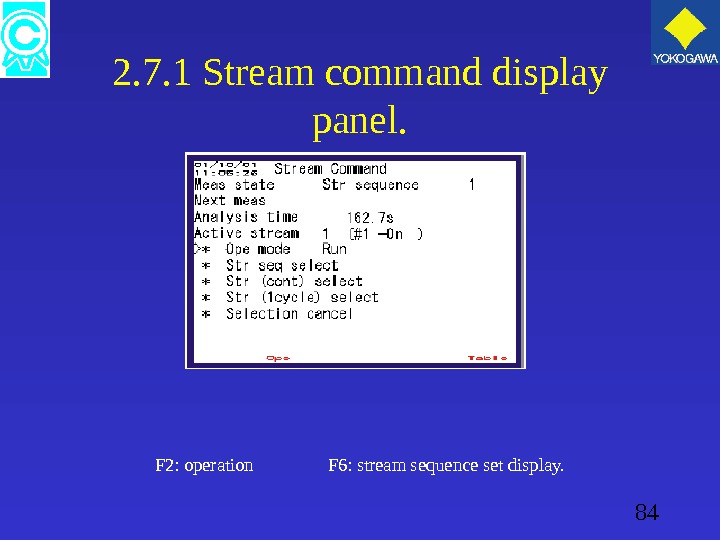
84 2. 7. 1 Stream command display panel. F 2: operation F 6: stream sequence set display.
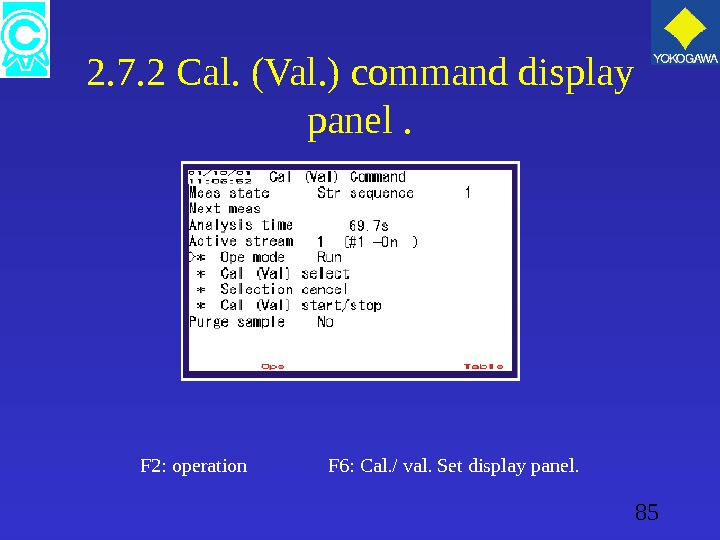
85 2. 7. 2 Cal. (Val. ) command display panel. F 2: operation F 6: Cal. / val. Set display panel.
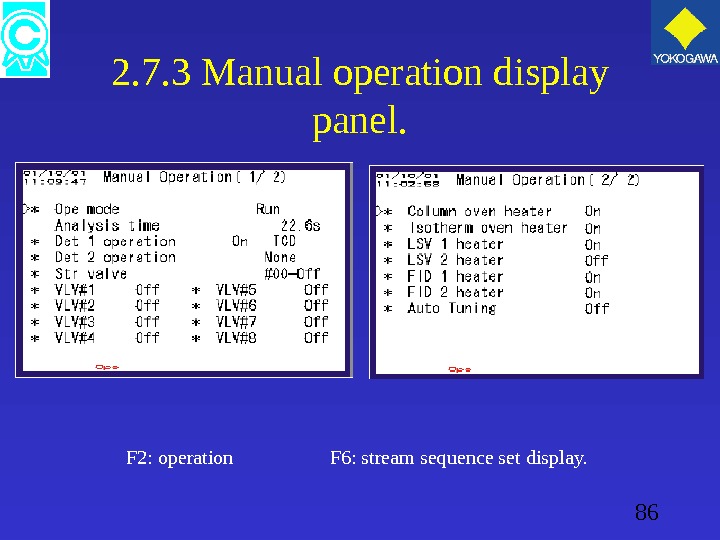
86 2. 7. 3 Manual operation display panel. F 2: operation F 6: stream sequence set display.
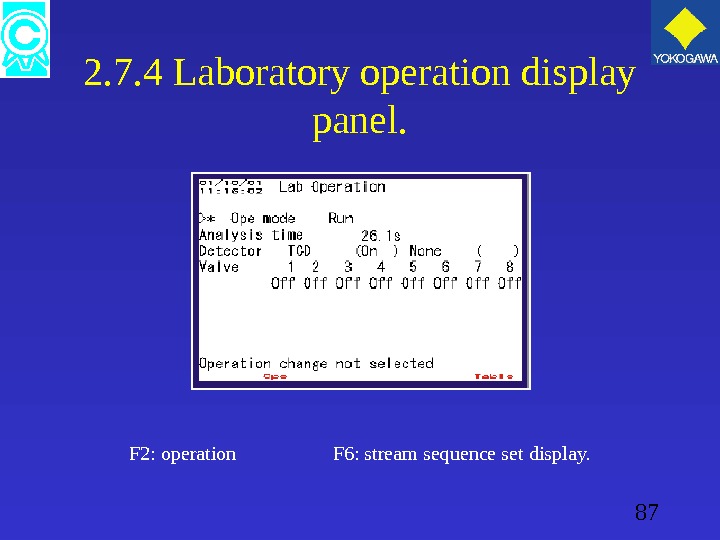
87 2. 7. 4 Laboratory operation display panel. F 2: operation F 6: stream sequence set display.
88 2. 7. 5 Range select display panel. F 2: operation F 3: Range selection executio F 6: stream sequence set display.
89 2. 8 Parameter setup panel. • Setup menu of the analyser. — System Set. — Operation condition set. — Temperature setup. — Detector signal settings — Method set. — Stream Sequence set. — Peak Common set. — Peak individual set. PAG
90 2. 8 Parameter setup panel. — Calibration/Validation Set. — Multi range set. — Lab set. — Alarm set. — Peak composition set. — Communication set. — DO set. — DI set. — AO Set. PAG
91 2. 8. 1 System Set. • Analyser name. • Analyser ID • Valve system • Column system. • Current date / time. • Auto start set “Yes” or “No” • Auto start
92 2. 8. 2 Operation condition set. • General information analyser set-up: — Type of carrier. — Pressure: Carrier, combustion fuel/air — Sample: volume, flow rate. — Flow rate.
93 2. 8. 3 Temperature setup. • For single Oven. — Maximum temperature isothermal oven. — Set temperature isothermal oven. — LSV set temperature. — FPD set temperature.
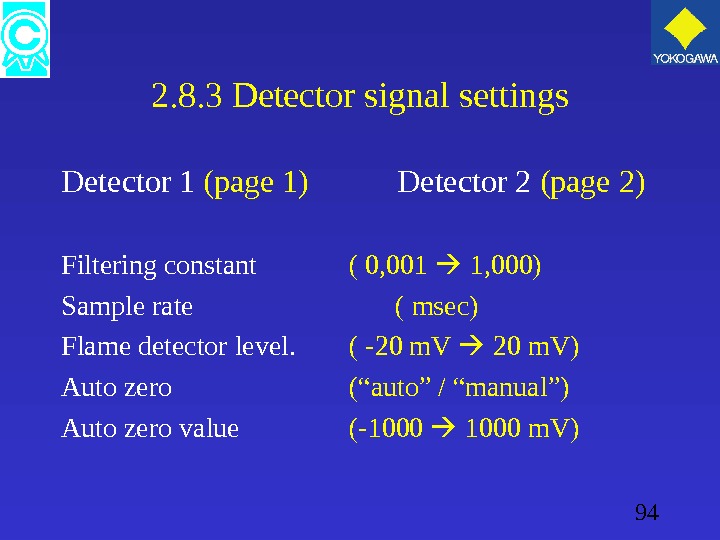
94 2. 8. 3 Detector signal settings Detector 1 (page 1) Detector 2 (page 2) Filtering constant ( 0, 001 1, 000) Sample rate ( msec) Flame detector level. ( -20 m. V 20 m. V) Auto zero (“auto” / “manual”) Auto zero value (-1000 m. V)
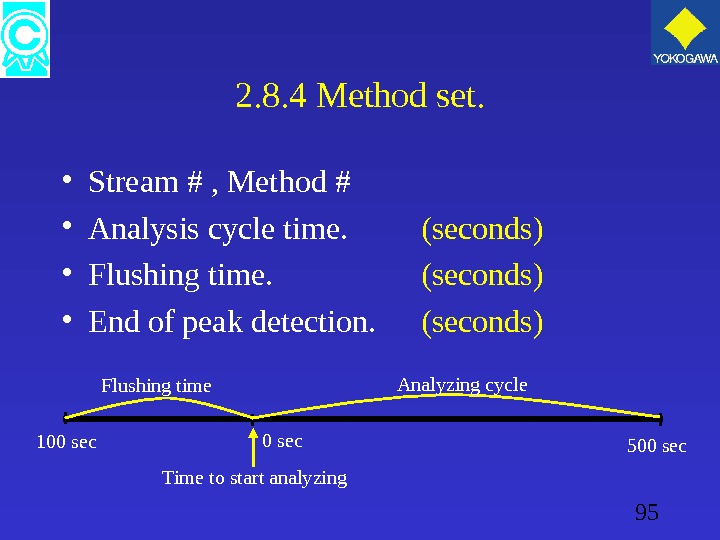
95 2. 8. 4 Method set. • Stream # , Method # • Analysis cycle time. (seconds) • Flushing time. (seconds) • End of peak detection. (seconds) 100 sec 500 sec Flushing time Analyzing cycle Time to start analyzing
96 Method set. F 4: Sequential display panel. This menu will display the complete sequence of the selected method that is used for each stream. F 2: action set valve display panel F 3: Action set gate display menu F 4: Action set Str. V display menu. F 5: action set DO display menu.
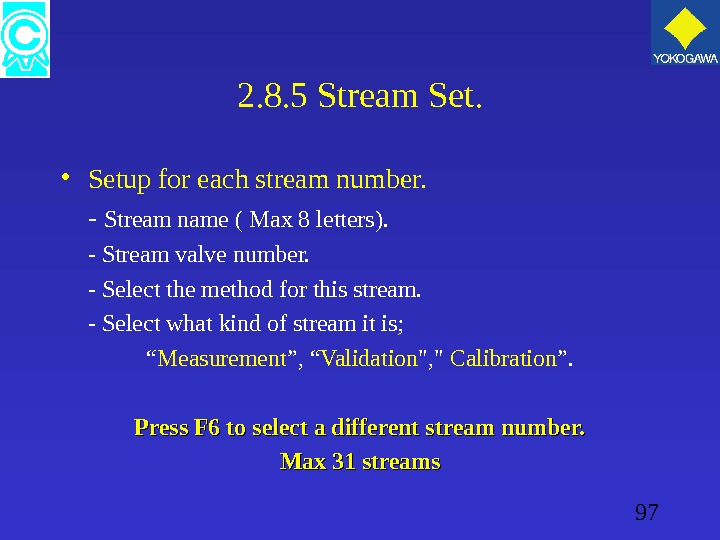
97 2. 8. 5 Stream Set. • Setup for each stream number. — Stream name ( Max 8 letters). — Stream valve number. — Select the method for this stream. — Select what kind of stream it is; “ Measurement ”, “ Validation «, » Calibration ”. Press F 6 to select a different stream number. Max 31 streams
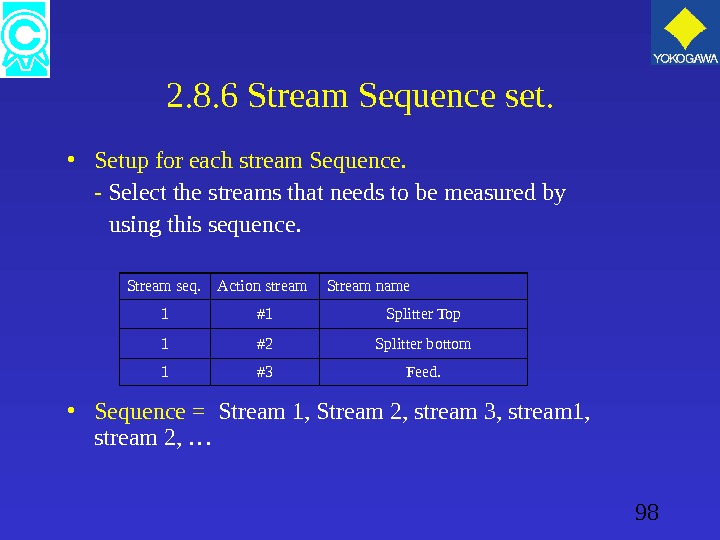
98 2. 8. 6 Stream Sequence set. • Setup for each stream Sequence. — Select the streams that needs to be measured by using this sequence. • Sequence = Stream 1, Stream 2, stream 3, stream 1, stream 2, … Stream seq. Action stream Stream name 1 #1 Splitter Top 1 #2 Splitter bottom 1 #3 Feed.
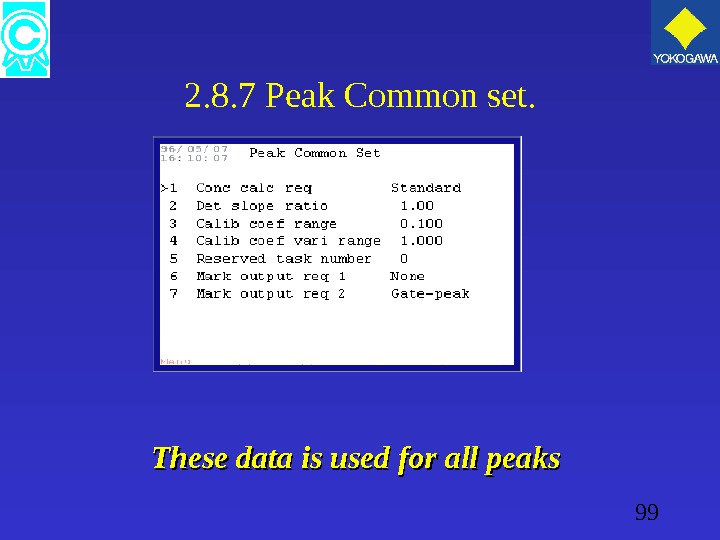
99 2. 8. 7 Peak Common set. These data is used for all peaks
100 Peak Common set. • Conc. calc req: “Standard” or “normalization”. • Calib coef range: — If zero, the analyzer will change after calibration the Std area for each individual peak. — If it is set to the value “a”, the GC will execute automatic calibration when the obtained value of the “ Calib factor” of each individual peak falls within a range from 1 -a to 1+a.
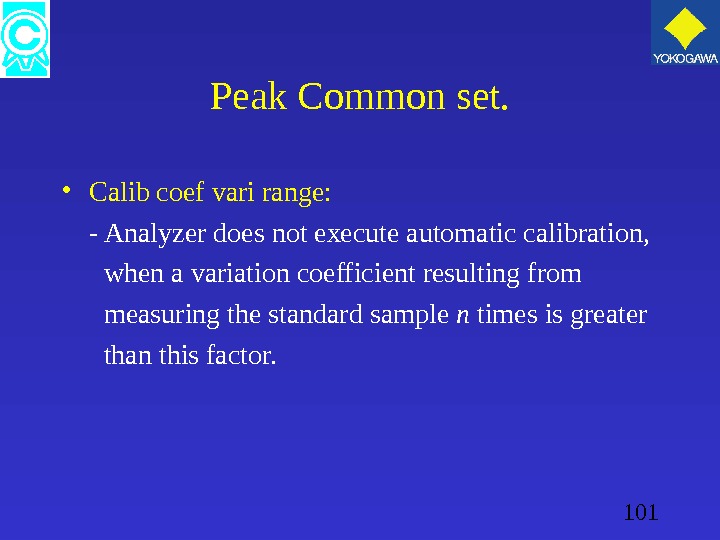
101 Peak Common set. • Calib coef vari range: — Analyzer does not execute automatic calibration, when a variation coefficient resulting from measuring the standard sample n times is greater than this factor.
102 2. 8. 8 Peak individual set. • Select stream and peak number. — Peak name. — Detector # — Measuring unit and range. — gate on / gate off. — chrom. gain. — retention time.
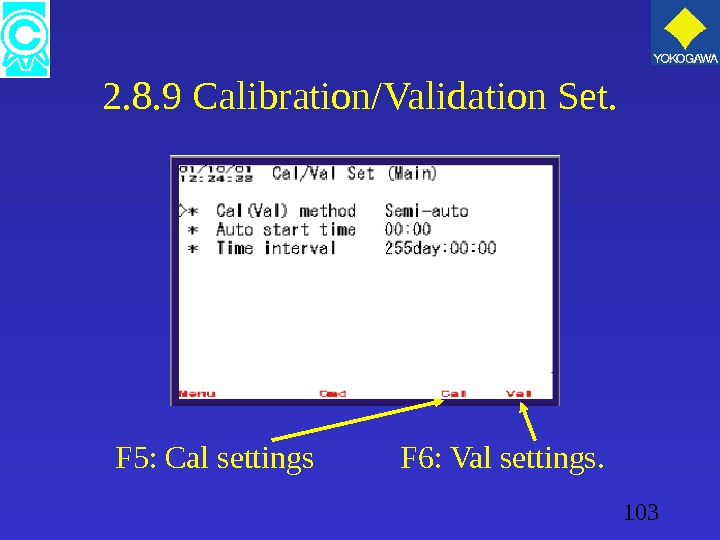
103 2. 8. 9 Calibration/Validation Set. F 5: Cal settings F 6: Val settings.
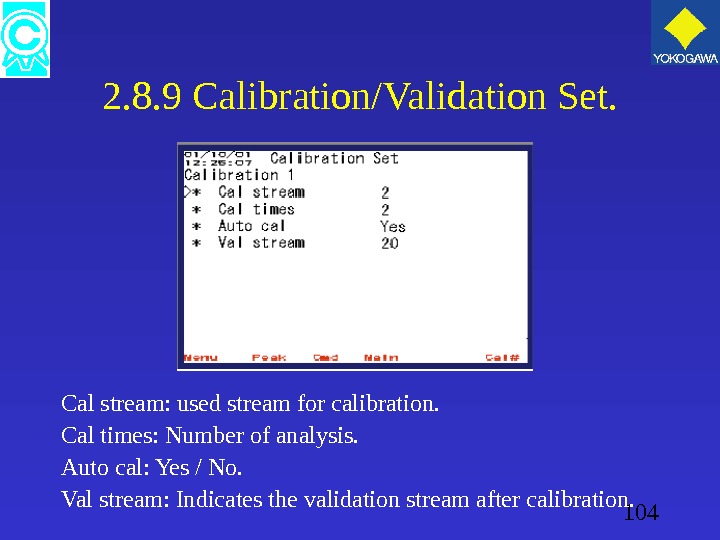
104 2. 8. 9 Calibration/Validation Set. Cal stream: used stream for calibration. Cal times: Number of analysis. Auto cal: Yes / No. Val stream: Indicates the validation stream after calibration.
105 2. 8. 12 Alarm set. • Select the specific stream and peak number. • Specifies item to be checked; – Conc. – R-Time – Tailing • Give the maximum and minimum level.
106 2. 8. 13 Peak composition set. • Total number of peaks assigned. • Total number of peaks not yet assigned. • Stream # • Stream name. • Number of peaks assigned to the stream. • Number of peaks used by the stream.
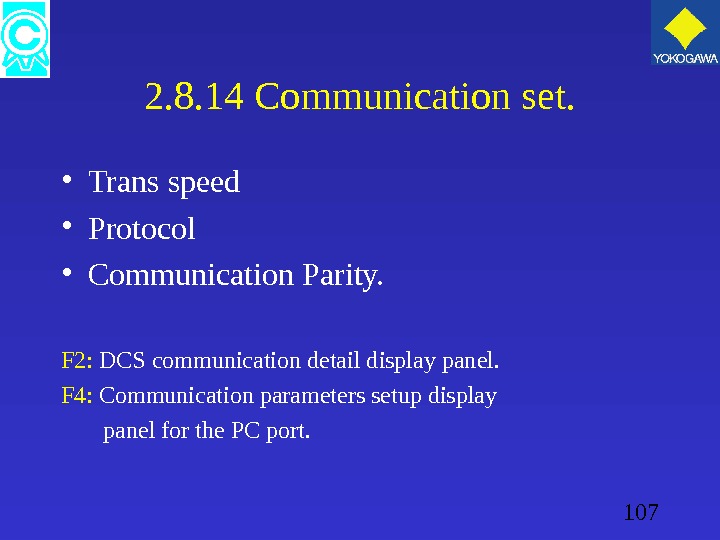
107 2. 8. 14 Communication set. • Trans speed • Protocol • Communication Parity. F 2: DCS communication detail display panel. F 4: Communication parameters setup display panel for the PC port.
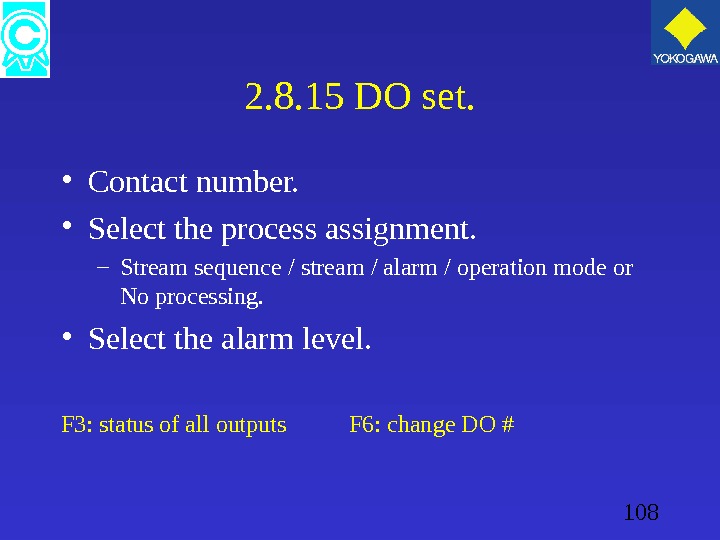
108 2. 8. 15 DO set. • Contact number. • Select the process assignment. – Stream sequence / stream / alarm / operation mode or No processing. • Select the alarm level. F 3: status of all outputs F 6: change DO #
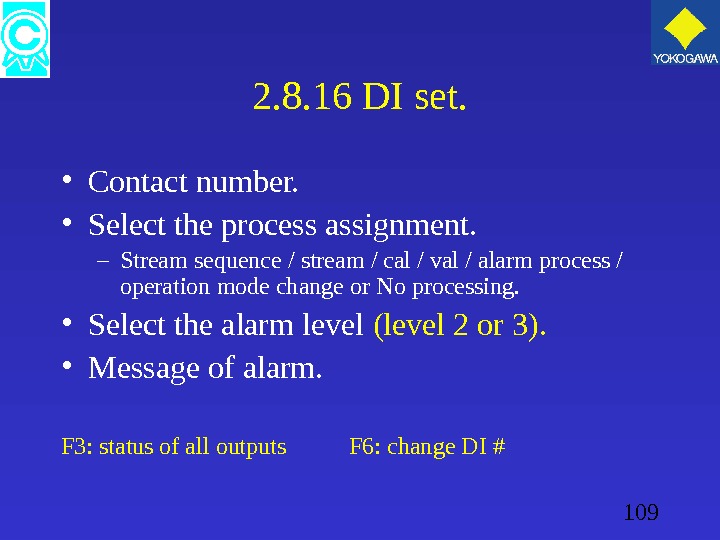
109 2. 8. 16 DI set. • Contact number. • Select the process assignment. – Stream sequence / stream / cal / val / alarm process / operation mode change or No processing. • Select the alarm level (level 2 or 3). • Message of alarm. F 3: status of all outputs F 6: change DI #
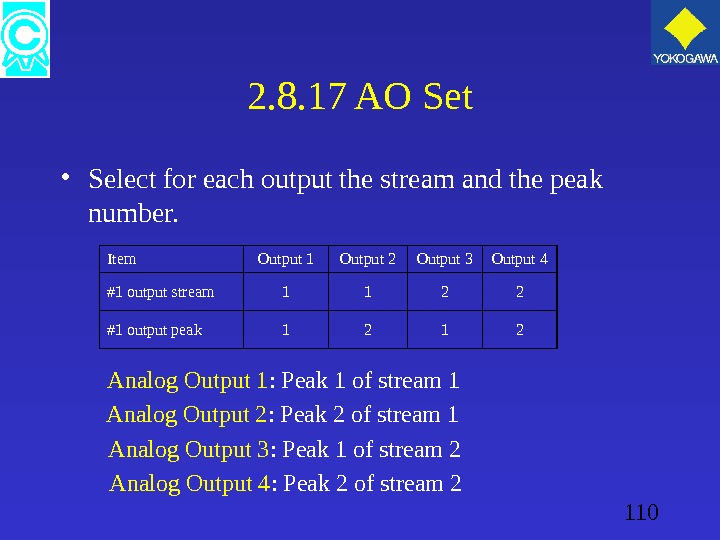
110 2. 8. 17 AO Set • Select for each output the stream and the peak number. Item Output 1 Output 2 Output 3 Output 4 #1 output stream 1 1 2 2 #1 output peak 1 2 Analog Output 1 : Peak 1 of stream 1 Analog Output 2 : Peak 2 of stream 1 Analog Output 3 : Peak 1 of stream 2 Analog Output 4 : Peak 2 of stream
111 3. 0 Operation after power delivery • Supply carrier and purge air to the analyzer. • Purging for approximately 12 minutes. • Set time and date. • Check the set values in “ operational Data ” • Start supplying Combustion fuel / air and set the pressure. Note : The supply of hydrogen gas to the isothermal oven is stopped when the power is off.
112 Operation after power delivery • Turn on the FPD detector after the temperature inside the oven has fully stabilized. • To make sure the detector is normally operating, display the base line on the Chromatogram screen. • Performe a standard sample measurement.
113 4. 0 Calibration methods. • Semi automatic calibration. • Automatic calibration. • Manual calibration. The GC provides two calibration methods. 1. Calibration by changing “std area”. 2. Calibration by changing “calib factor”.
114 Manual calibration. • Manual calibration is selected if no automatic stream valve is used to activated the calibration stream. • If the power was off, the analyzer is automatically set to default settings. (manual calibration method)
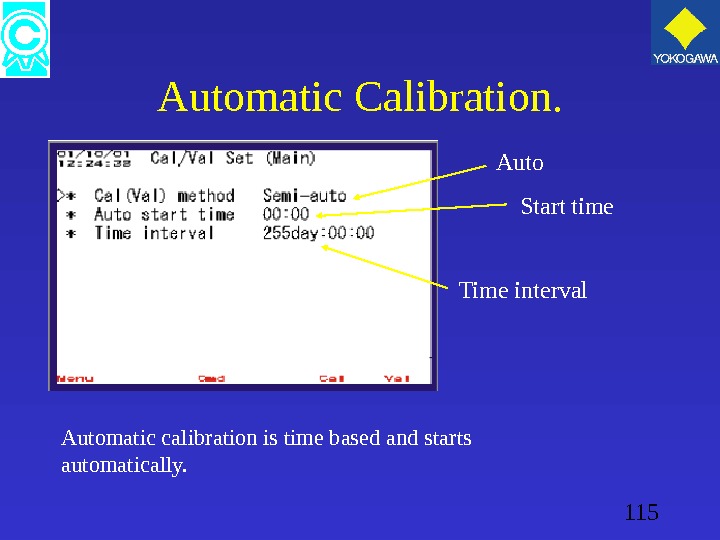
115 Automatic Calibration. Automatic calibration is time based and starts automatically. Auto Start time Time interval
116 Semi automatic calibration. • Semi automatic calibration is not time based and needs to be started/selected manually. • Stream valve for the Calibration stream will be automatically selected by the analyzer.
117 Start the calibration / validation. • Select the local mode. • Press the operation key and select F 2. • Move the cursor to “ cal (val) select ” and press enter. Note: The calibration will start after the ongoing measurement of the stream has been completed
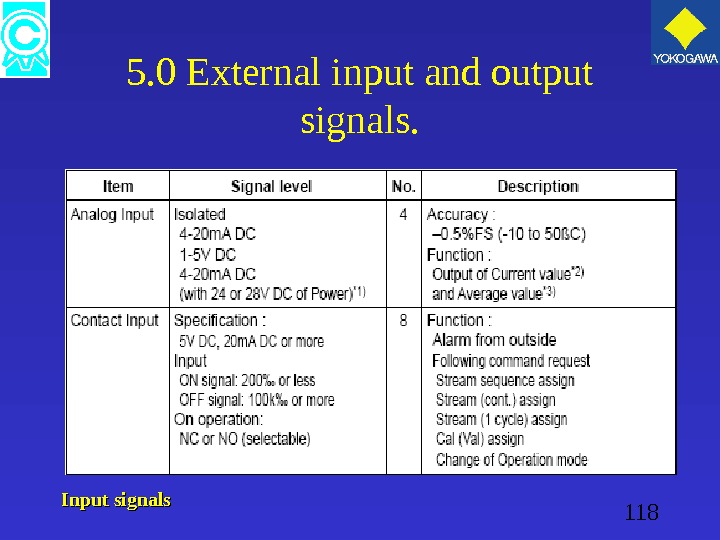
118 5. 0 External input and output signals. Input signals
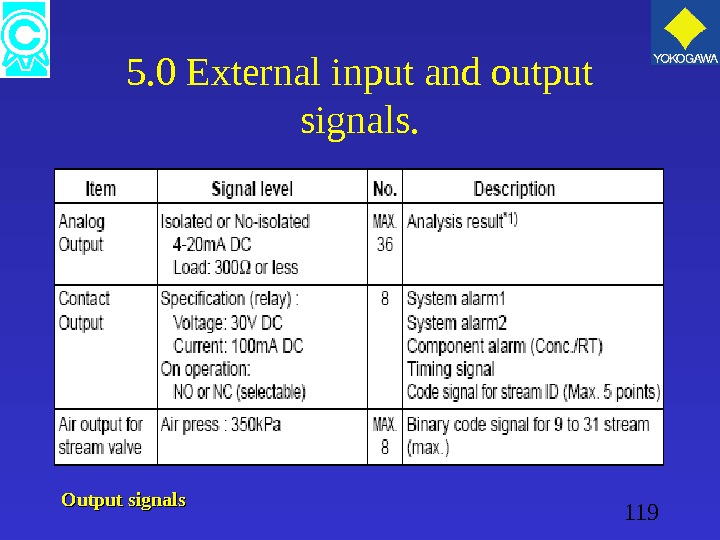
119 5. 0 External input and output signals. Output signals
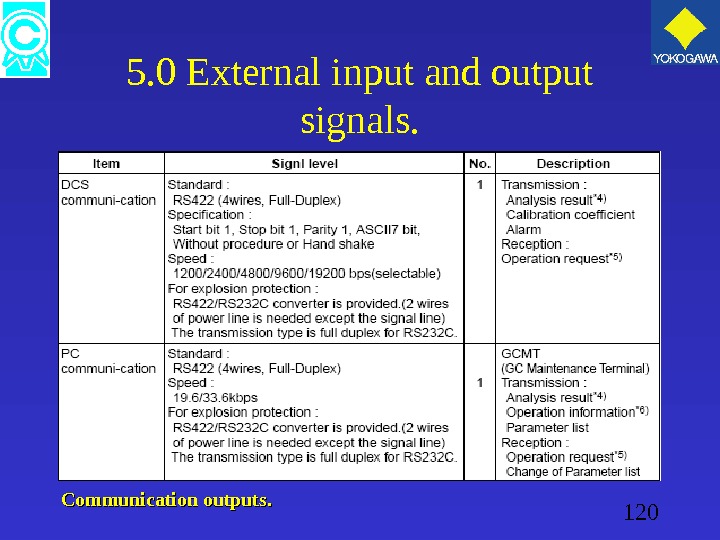
120 5. 0 External input and output signals. Communication outputs.
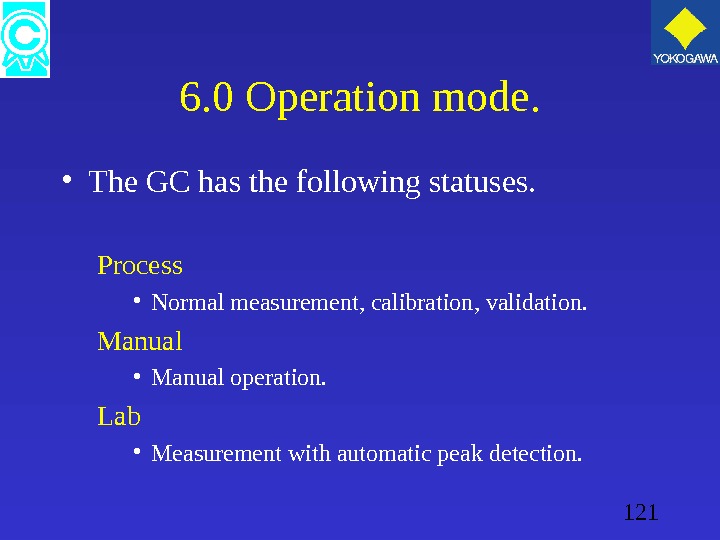
121 6. 0 Operation mode. • The GC has the following statuses. Process • Normal measurement, calibration, validation. Manual • Manual operation. Lab • Measurement with automatic peak detection.
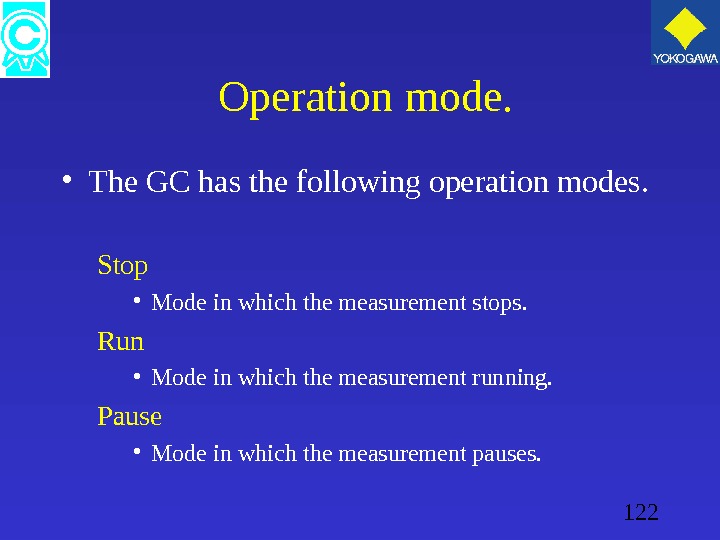
122 Operation mode. • The GC has the following operation modes. Stop • Mode in which the measurement stops. Run • Mode in which the measurement running. Pause • Mode in which the measurement pauses.
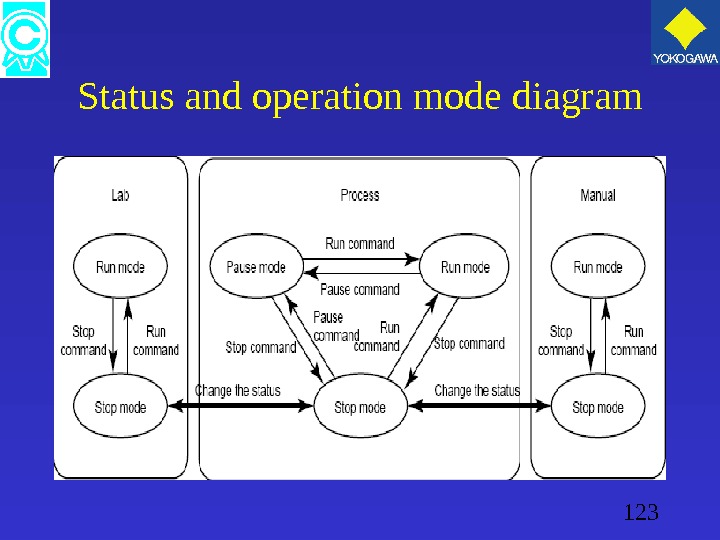
123 Status and operation mode diagram
124 Manual operation. In the manual mode various operations and measurements can be performed manually. — On/Off various valves. — On/Off stream valves. — On/Off of several heaters. — on/off several types of detectors. This mode is will also be used during analyzer trouble shooting.
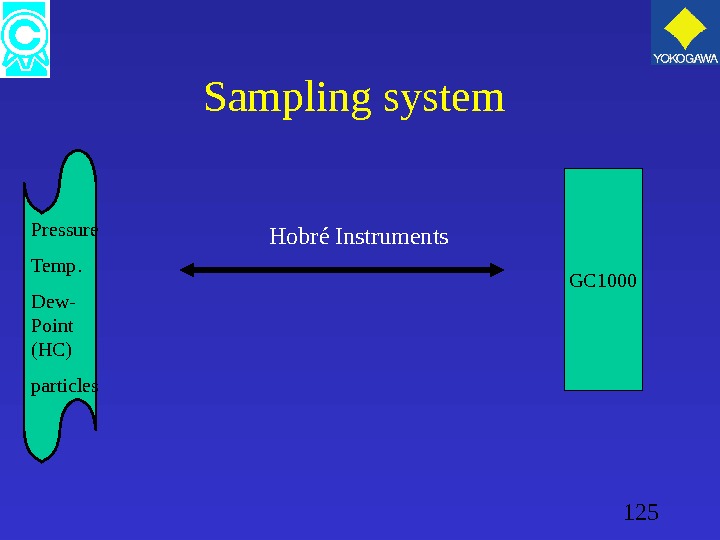
125 Sampling system GC 1000 Pressure Temp. Dew- Point (HC) particles Hobré Instruments
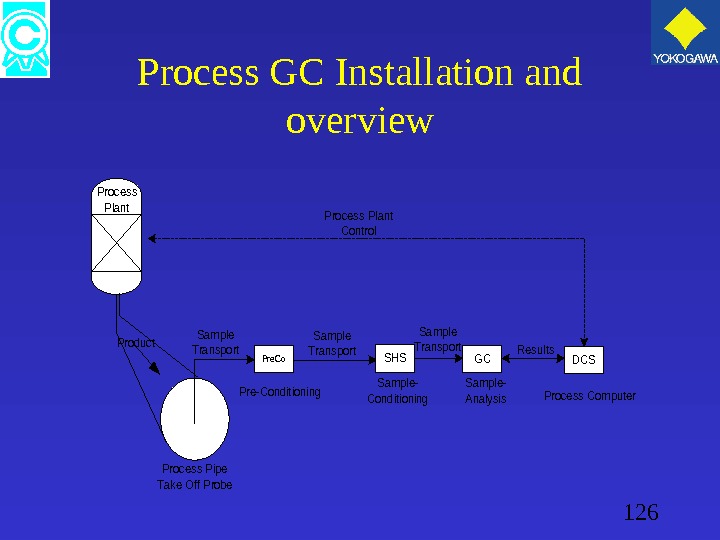
126 Process GC Installation and overview Pre. Co. SHSGCDCS Process Computer Process Pipe Take Off Probe Pre-Conditioning. Sample- Conditioning Sample- Analysis Results Sample Transport Process Plant Control Product Process Plant
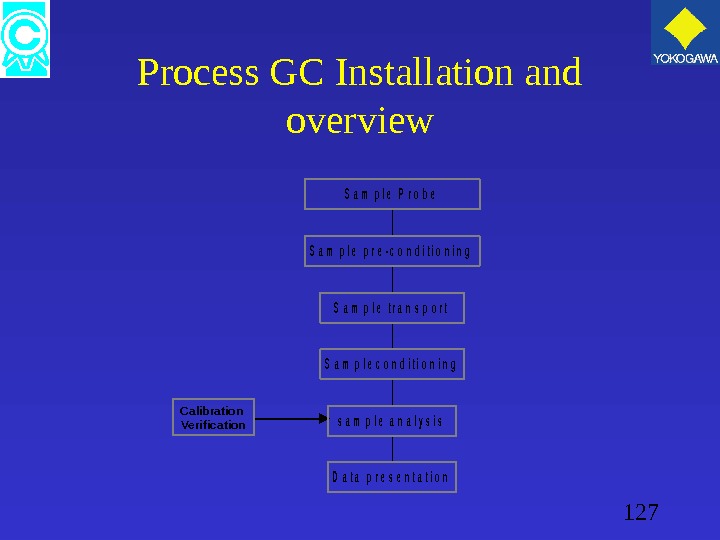
127 Process GC Installation and overview D a t a p r e s e n t a t i o n s a m p l e a n a l y s i s S a m p l e c o n d i t i o n i n g S a m p l e t r a n s p o r t S a m p l e p r e — c o n d i t i o n i n g S a m p l e P r o b e Calibration Verification
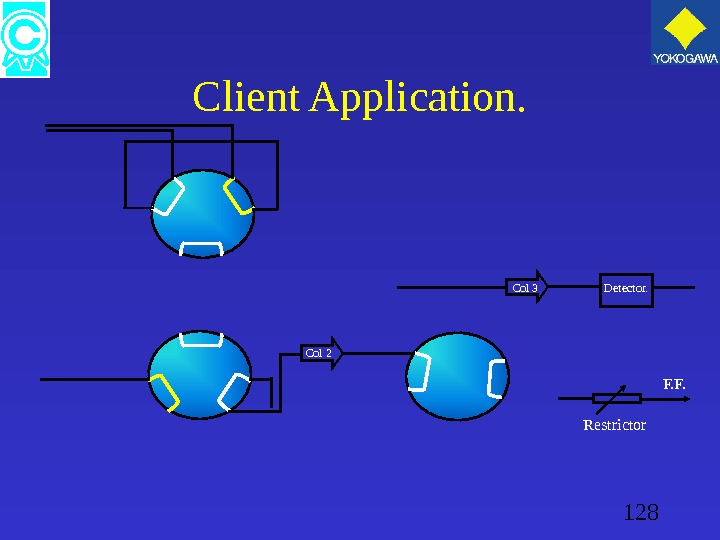
128 Client Application. Col 3 Detector. Restrictor F. F. Col