
Презентация chap2 The Data of Macroeconomics


- Размер: 663 Кб
- Количество слайдов: 57
Описание презентации Презентация chap2 The Data of Macroeconomics по слайдам
macroeconomics fifth edition N. Gregory Mankiw Power. Point ® Slides by Ron Cronovich. CHAPTER TWO The Data of Macroeconomicsm a c r o © 2004 Worth Publishers, all rights reserved
CHAPTER 2 The Data of Macroeconomics slide 2 Learning objectives In this chapter, you will learn about: Gross Domestic Product (GDP) the Consumer Price Index (CPI) the Unemployment Rate
CHAPTER 2 The Data of Macroeconomics slide 3 Gross Domestic Product Two definitions: 1. Total expenditure on domestically-produced final goods and services 2. Total income earned by domestically-located factors of production
CHAPTER 2 The Data of Macroeconomics slide 4 Why expenditure = income In every transaction, the buyer’s expenditure becomes the seller’s income. Thus, the sum of all expenditure equals the sum of all income.
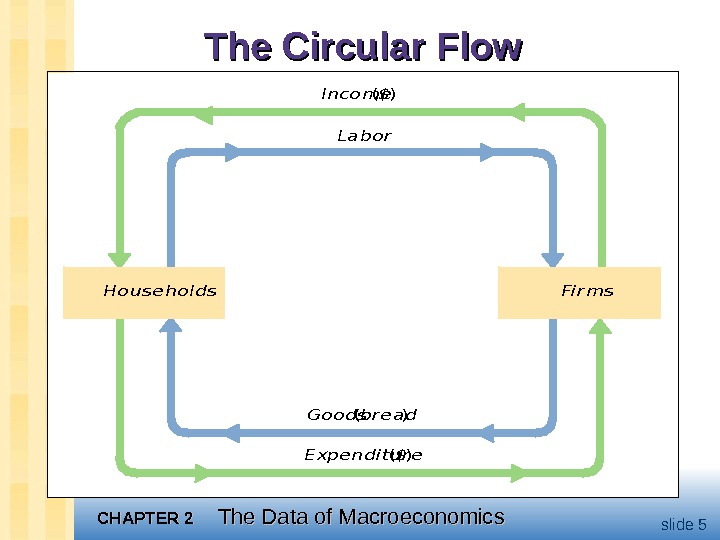
CHAPTER 2 The Data of Macroeconomics slide 5 The Circular Flow. Income ($) Labor Goo ds (bread) Expe ndi t ure ($) House hol ds. Fi rms
CHAPTER 2 The Data of Macroeconomics slide 6 Value added definition: A firm’s value added is the value of its output minus the value of the intermediate goods the firm used to produce that output.
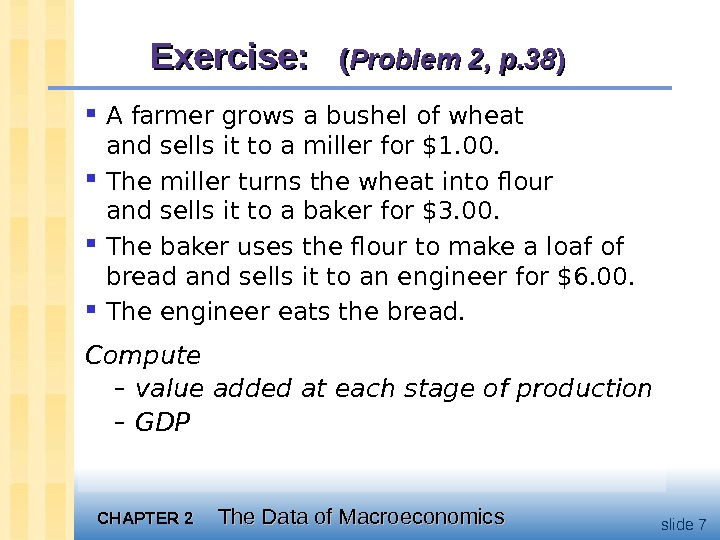
CHAPTER 2 The Data of Macroeconomics slide 7 Exercise: (( Problem 2, p. 38 )) A farmer grows a bushel of wheat and sells it to a miller for $1. 00. The miller turns the wheat into flour and sells it to a baker for $3. 00. The baker uses the flour to make a loaf of bread and sells it to an engineer for $6. 00. The engineer eats the bread. Compute – value added at each stage of production – GDP
CHAPTER 2 The Data of Macroeconomics slide 8 Final goods, value added, and GDP GDP = value of final goods produced = sum of value added at all stages of production The value of the final goods already includes the value of the intermediate goods, so including intermediate goods in GDP would be double-counting.
CHAPTER 2 The Data of Macroeconomics slide 9 The expenditure components of GDP • consumption • investment • government spending • net exports
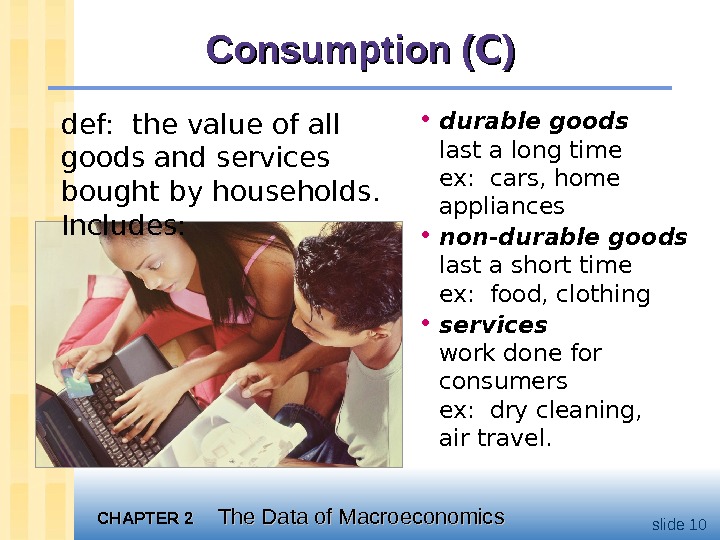
CHAPTER 2 The Data of Macroeconomics slide 10 Consumption ( CC )) • durable goods last a long time ex: cars, home appliances • non-durable goods last a short time ex: food, clothing • services work done for consumers ex: dry cleaning, air travel. def: the value of all goods and services bought by households. Includes:
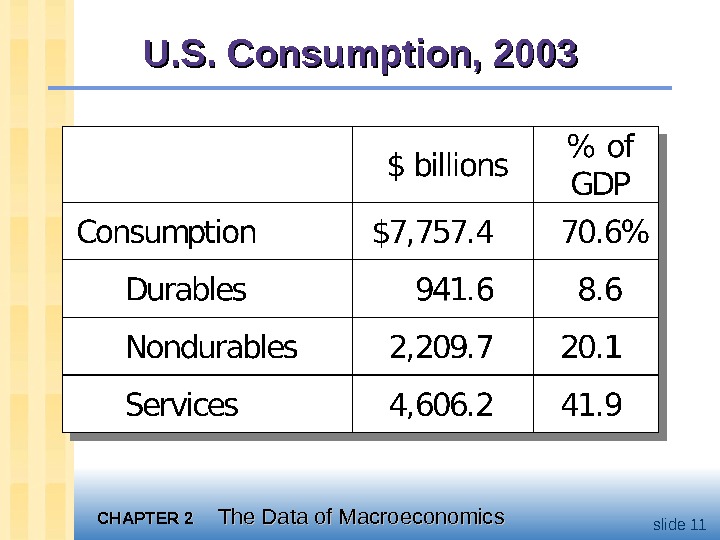
CHAPTER 2 The Data of Macroeconomics slide 11 U. S. Consumption,
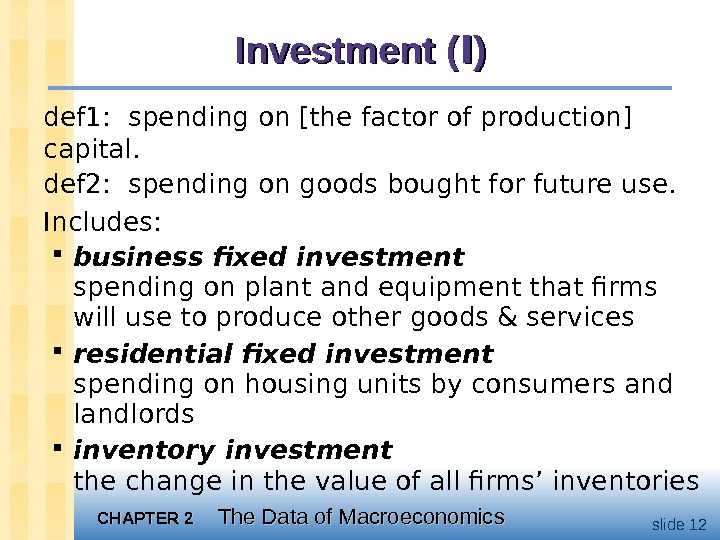
CHAPTER 2 The Data of Macroeconomics slide 12 Investment ( II )) def 1: spending on [the factor of production] capital. def 2: spending on goods bought for future use. Includes: business fixed investment spending on plant and equipment that firms will use to produce other goods & services residential fixed investment spending on housing units by consumers and landlords inventory investment the change in the value of all firms’ inventories
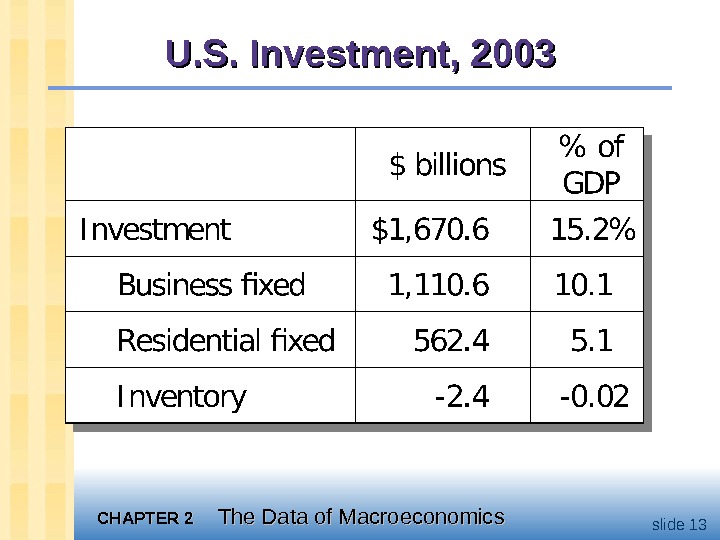
CHAPTER 2 The Data of Macroeconomics slide 13 U. S. Investment,
CHAPTER 2 The Data of Macroeconomics slide 14 Investment vs. Capital is one of the factors of production. At any given moment, the economy has a certain overall stock of capital. Investment is spending on new capital.
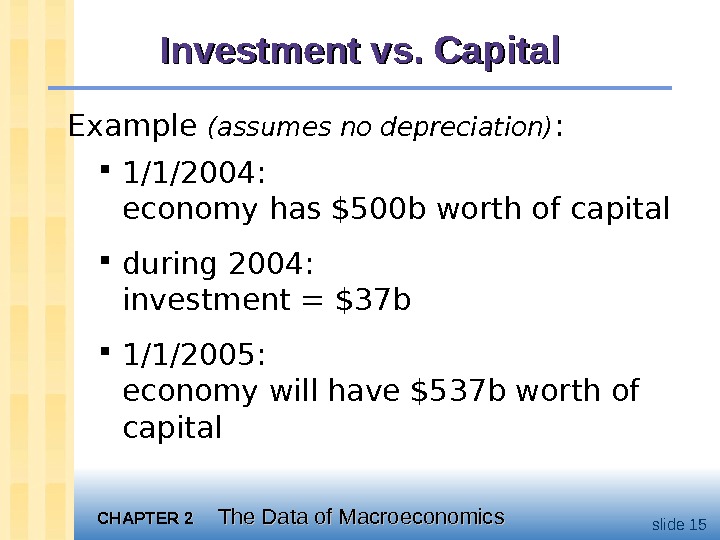
CHAPTER 2 The Data of Macroeconomics slide 15 Investment vs. Capital Example (assumes no depreciation) : 1/1/2004: economy has $500 b worth of capital during 2004: investment = $37 b 1/1/2005: economy will have $537 b worth of capital
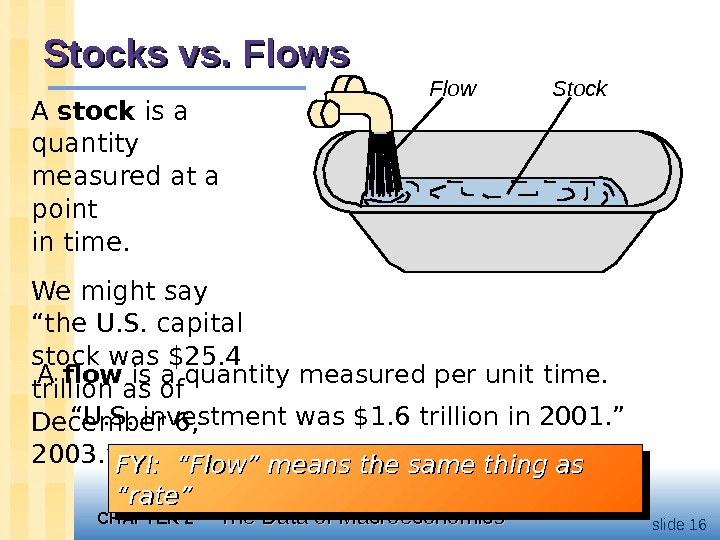
CHAPTER 2 The Data of Macroeconomics slide 16 Stocks vs. Flows A flow is a quantity measured per unit time. “ U. S. investment was $1. 6 trillion in 2001. ” Flow Stock A stock is a quantity measured at a point in time. We might say “the U. S. capital stock was $25. 4 trillion as of December 6, 2003. ” FYI: “Flow” means the same thing as “rate”FYI: “Flow” means the same thing as “rate”
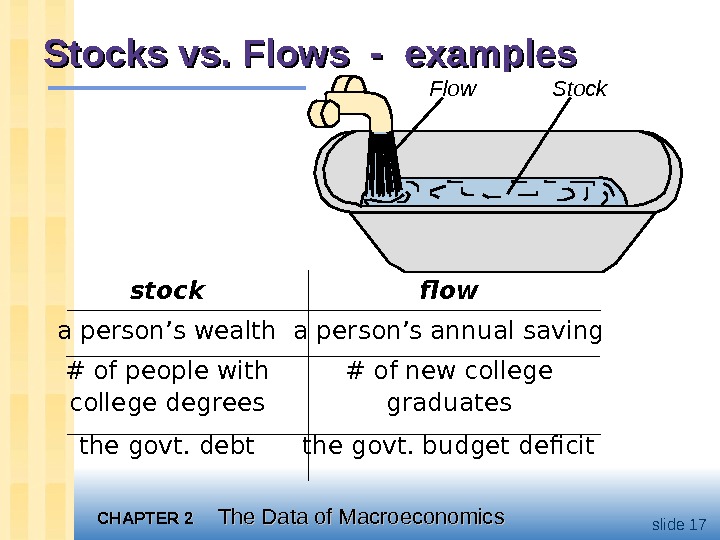
CHAPTER 2 The Data of Macroeconomics slide 17 Stocks vs. Flows — examples Flow Stock stock flow a person’s wealth a person’s annual saving # of people with # of new college degrees graduates the govt. debt the govt. budget deficit
CHAPTER 2 The Data of Macroeconomics slide 18 Now you try: Stock or flow? The balance on your credit card statement. How much you study economics outside of class. The size of your compact disc collection. The inflation rate. The unemployment rate.
CHAPTER 2 The Data of Macroeconomics slide 19 Government spending ( GG )) G includes all government spending on goods and services. G excludes transfer payments (e. g. unemployment insurance payments), because they do not represent spending on goods and services.
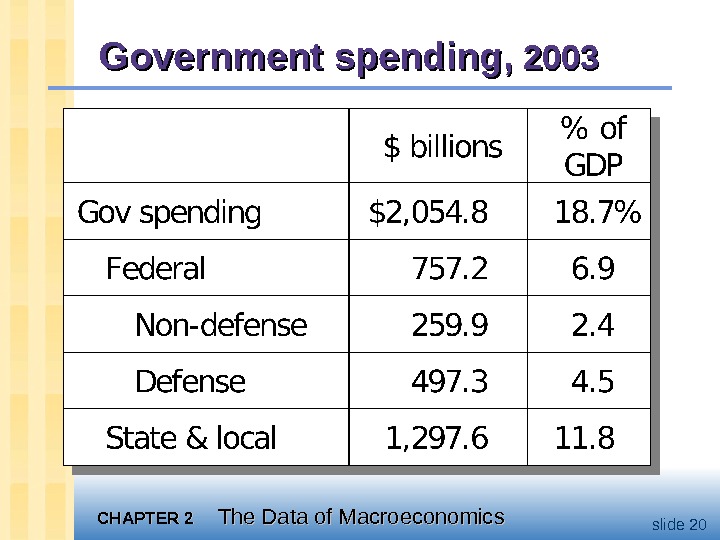
CHAPTER 2 The Data of Macroeconomics slide 20 Government spending,
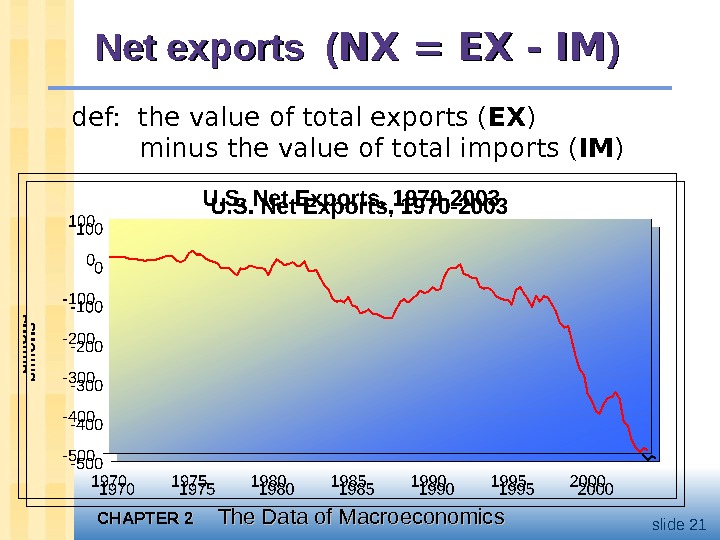
CHAPTER 2 The Data of Macroeconomics slide 21 Net exports ( NX = EX — IM )) def: the value of total exports ( EX ) minus the value of total imports ( IM )
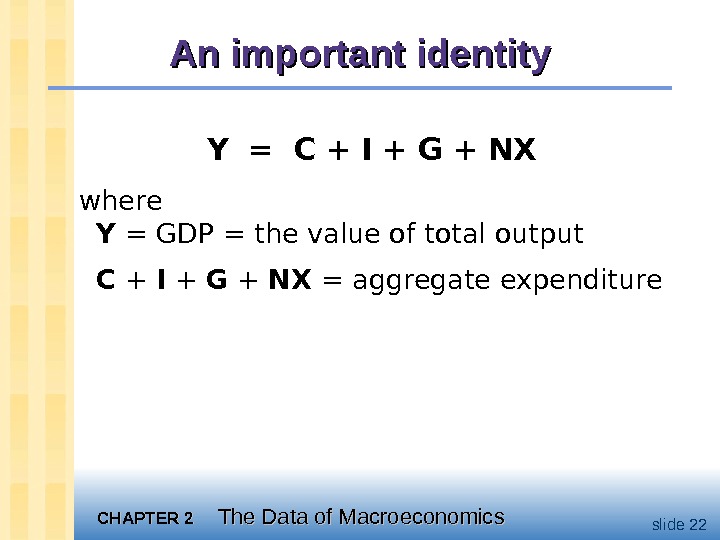
CHAPTER 2 The Data of Macroeconomics slide 22 An important identity Y = C + I + G + NX where Y = GDP = the value of total output C + I + G + NX = aggregate expenditure
CHAPTER 2 The Data of Macroeconomics slide 23 A question for you: Suppose a firm produces $10 million worth of final goods but only sells $9 million worth. Does this violate the expenditure = output identity?
CHAPTER 2 The Data of Macroeconomics slide 24 Why output = expenditure Unsold output goes into inventory, and is counted as “inventory investment”… … whether the inventory buildup was intentional or not. In effect, we are assuming that firms purchase their unsold output.
CHAPTER 2 The Data of Macroeconomics slide 25 GDP: An important and versatile concept We have now seen that GDP measures total income total output total expenditure the sum of value-added at all stages in the production of final goods
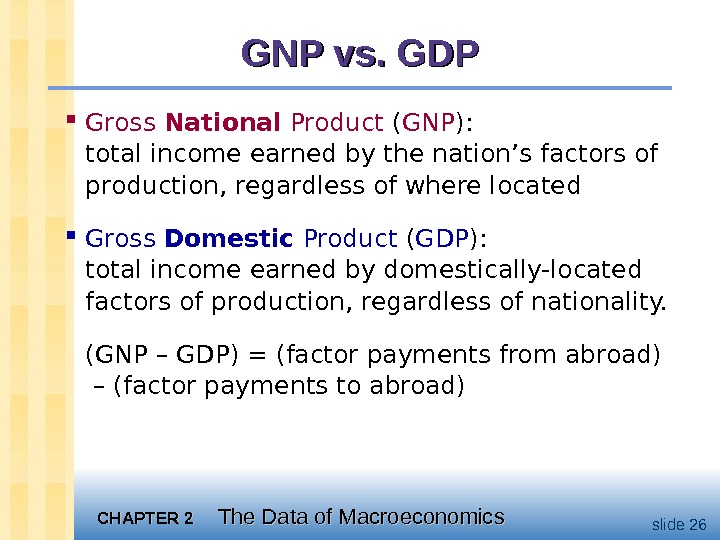
CHAPTER 2 The Data of Macroeconomics slide 26 GNP vs. GDP Gross National Product ( GNP ): total income earned by the nation’s factors of production, regardless of where located Gross Domestic Product ( GDP ): total income earned by domestically-located factors of production, regardless of nationality. (GNP – GDP) = (factor payments from abroad) – (factor payments to abroad)
CHAPTER 2 The Data of Macroeconomics slide 27 Discussion Question: In your country, which would you want to be bigger, GDP or GNP? Why?
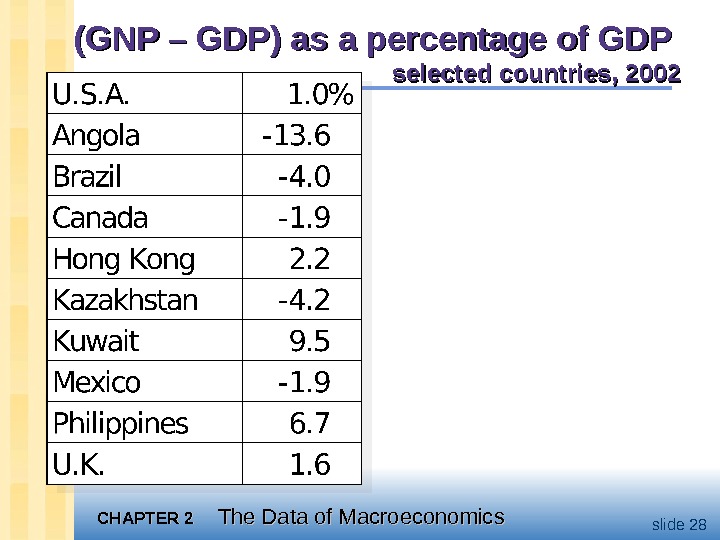
CHAPTER 2 The Data of Macroeconomics slide 28(GNP – GDP) as a percentage of GDP selected countries,
CHAPTER 2 The Data of Macroeconomics slide 29 Real vs. Nominal GDP GDP is the value of all final goods and services produced. Nominal GDP measures these values using current prices. Real GDP measure these values using the prices of a base year.
CHAPTER 2 The Data of Macroeconomics slide 30 Real GDP controls for inflation Changes in nominal GDP can be due to: changes in prices changes in quantities of output produced Changes in real GDP can only be due to changes in quantities, because real GDP is constructed using constant base-year prices.
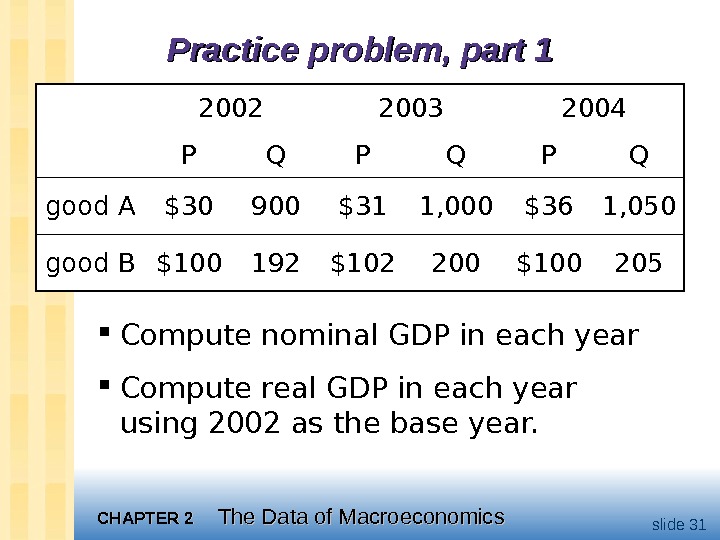
CHAPTER 2 The Data of Macroeconomics slide 31 Practice problem, part 1 Compute nominal GDP in each year Compute real GDP in each year using 2002 as the base year. 2002 2003 2004 P Q P Q good A $30 900 $31 1, 000 $36 1, 050 good B $100 192 $102 200 $
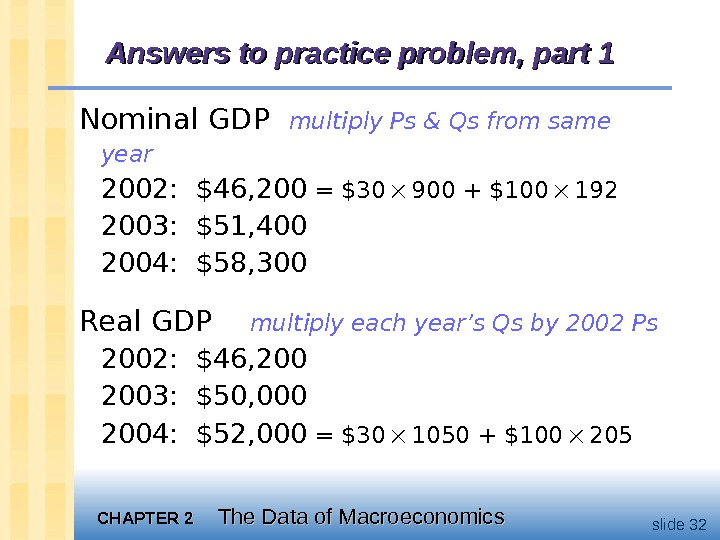
CHAPTER 2 The Data of Macroeconomics slide 32 Answers to practice problem, part 1 Nominal GDP multiply Ps & Qs from same year 2002: $46, 200 = $30 900 + $100 192 2003: $51, 400 2004: $58, 300 Real GDP multiply each year’s Qs by 2002 Ps 2002: $46, 2003: $50, 000 2004: $52, 000 = $30 1050 + $
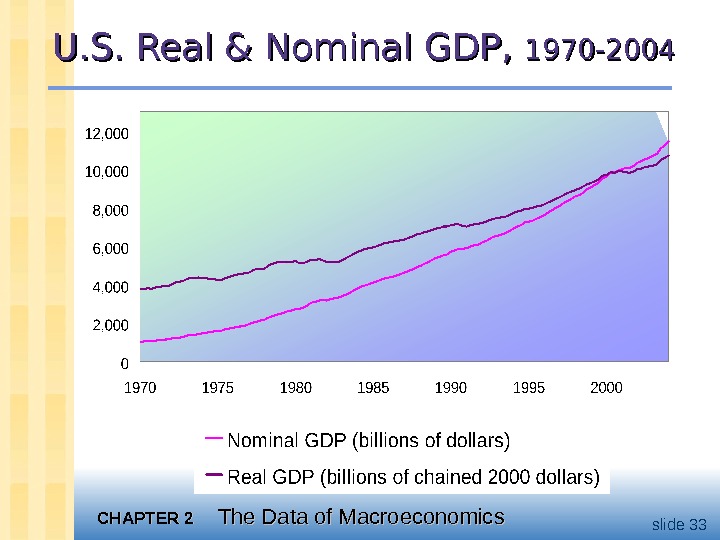
CHAPTER 2 The Data of Macroeconomics slide 33 U. S. Real & Nominal GDP, 1970 —
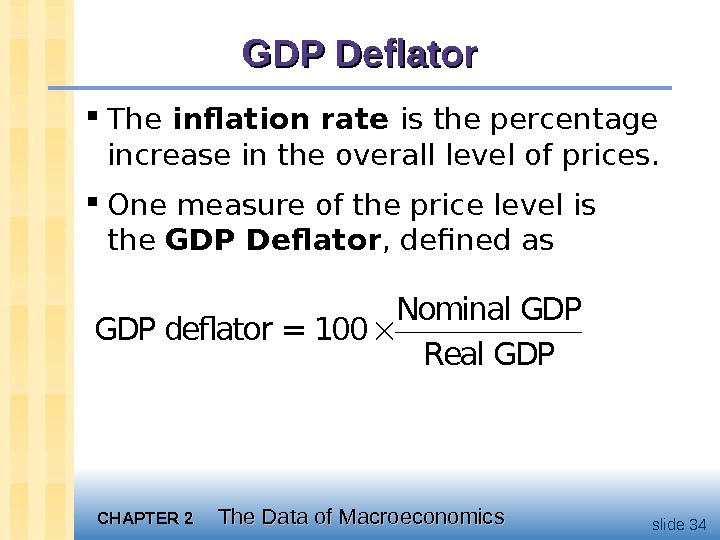
CHAPTER 2 The Data of Macroeconomics slide 34 GDP Deflator The inflation rate is the percentage increase in the overall level of prices. One measure of the price level is the GDP Deflator , defined as Nominal GDP deflator = 100 Real GDP
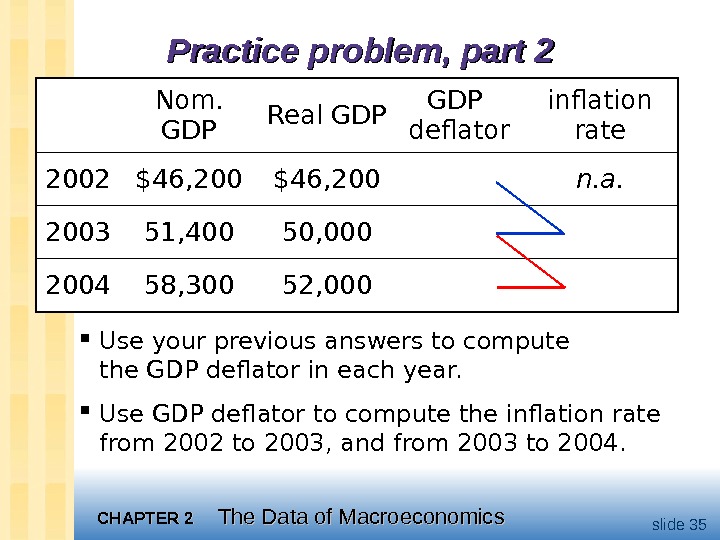
CHAPTER 2 The Data of Macroeconomics slide 35 Practice problem, part 2 Use your previous answers to compute the GDP deflator in each year. Use GDP deflator to compute the inflation rate from 2002 to 2003, and from 2003 to 2004. Nom. GDP Real GDP deflator inflation rate 2002 $46, 200 n. a. 2003 51, 400 50, 000 2004 58, 300 52,
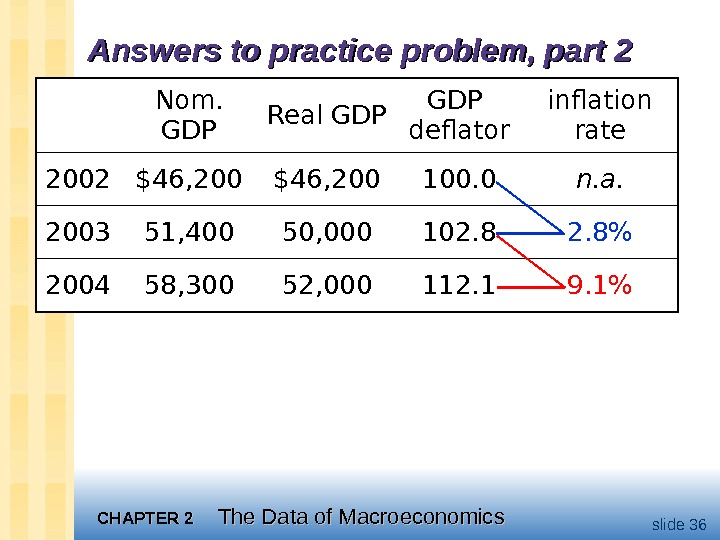
CHAPTER 2 The Data of Macroeconomics slide 36 Answers to practice problem, part 2 Nom. GDP Real GDP deflator inflation rate 2002 $46, 200 100. 0 n. a. 2003 51, 400 50, 000 102. 8% 2004 58, 300 52, 000 112. 1 9. 1%
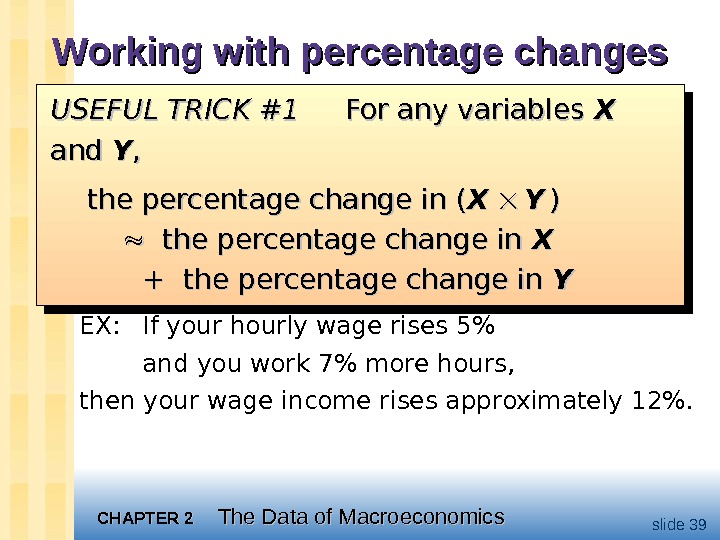
CHAPTER 2 The Data of Macroeconomics slide 39 Working with percentage changes EX: If your hourly wage rises 5% and you work 7% more hours, then your wage income rises approximately 12%. USEFUL TRICK #1 For any variables XX and YY , , the percentage change in ( XX YY )) the percentage change in XX + the percentage change in YYUSEFUL TRICK #1 For any variables XX and YY , , the percentage change in ( XX YY )) the percentage change in XX + the percentage change in YY
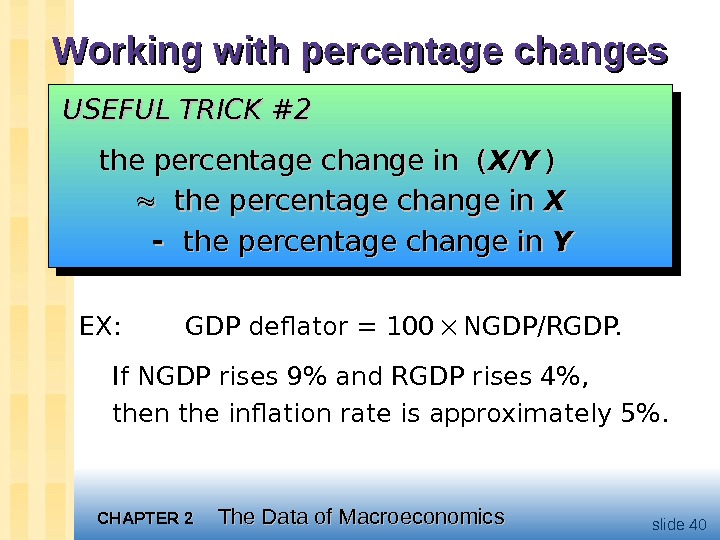
CHAPTER 2 The Data of Macroeconomics slide 40 Working with percentage changes EX: GDP deflator = 100 NGDP/RGDP. If NGDP rises 9% and RGDP rises 4%, then the inflation rate is approximately 5%. USEFUL TRICK #2 USEFUL TRICK #2 the percentage change in (the percentage change in ( XX // YY )) the percentage change in XX the percentage change in YY
CHAPTER 2 The Data of Macroeconomics slide 41 Chain-weighted Real GDP Over time, relative prices change, so the base year should be updated periodically. In essence, “chain-weighted Real GDP” updates the base year every year. This makes chain-weighted GDP more accurate than constant-price GDP. But the two measures are highly correlated, and constant-price real GDP is easier to compute… … so we’ll usually use constant-price real GDP.
CHAPTER 2 The Data of Macroeconomics slide 42 Consumer Price Index (CPI) A measure of the overall level of prices Published by the Bureau of Labor Statistics ( BLS ) Used to – track changes in the typical household’s cost of living – adjust many contracts for inflation ( i. e. “COLAs”) – allow comparisons of dollar figures from different years
CHAPTER 2 The Data of Macroeconomics slide 43 How the BLS constructs the CPI 1. Survey consumers to determine composition of the typical consumer’s “basket” of goods. 2. Every month, collect data on prices of all items in the basket; compute cost of basket 3. CPI in any month equals. Cost of basket in that month 100 Cost of basket in base period
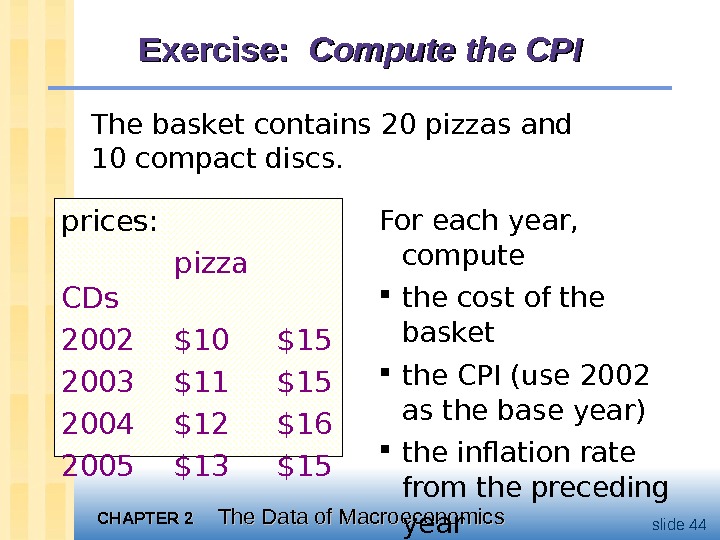
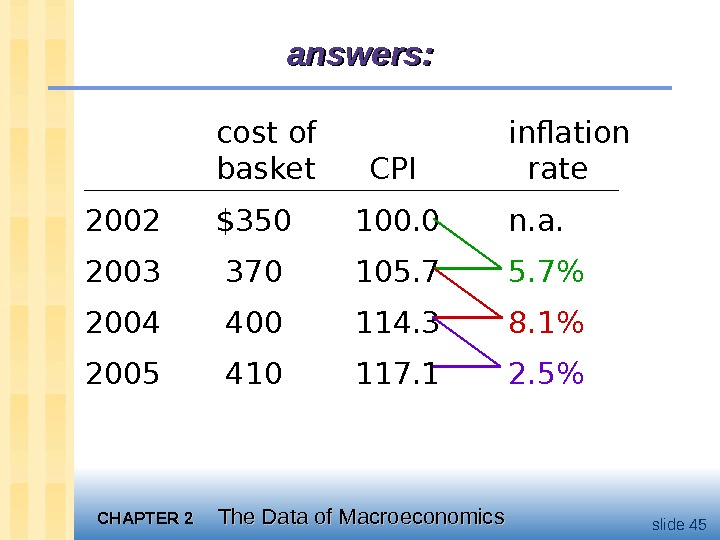
CHAPTER 2 The Data of Macroeconomics slide 44 Exercise: Compute the CPI The basket contains 20 pizzas and 10 compact discs. prices: pizza CDs 2002 $10 $15 2003 $11 $15 2004 $12 $16 2005 $13 $15 For each year, compute the cost of the basket the CPI (use 2002 as the base year) the inflation rate from the preceding year
CHAPTER 2 The Data of Macroeconomics slide 45 cost of inflation basket CPI rate 2002 $350 100. 0 n. a. 2003 370 105. 7% 2004 400 114. 3 8. 1% 2005 410 117. 1 2. 5%answers:
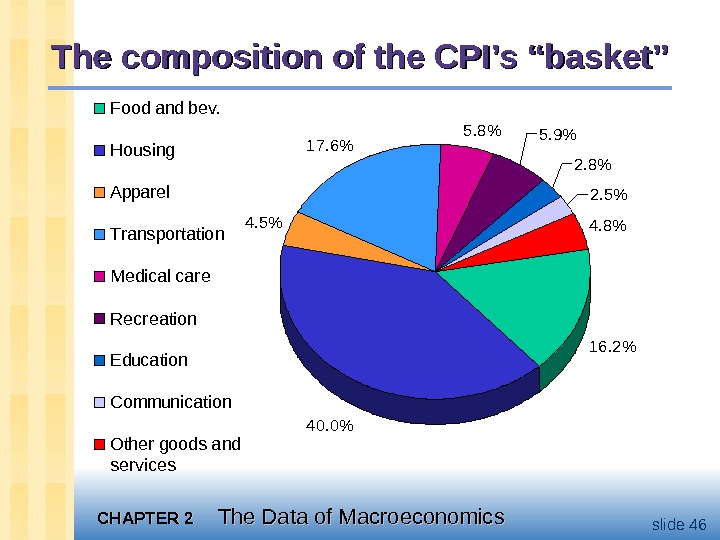
CHAPTER 2 The Data of Macroeconomics slide 46 The composition of the CPI’s “basket” 16. 2% 40. 0%4. 5% 17. 6% 5. 8% 5. 9% 2. 8% 2. 5% 4. 8%Food and bev. Housing Apparel Transportation Medical care Recreation Education Communication Other goods and services
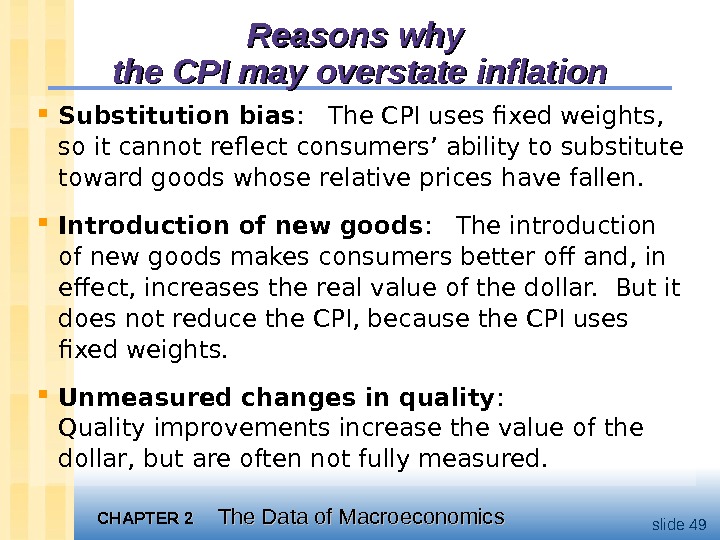
CHAPTER 2 The Data of Macroeconomics slide 49 Reasons why the CPI may overstate inflation Substitution bias : The CPI uses fixed weights, so it cannot reflect consumers’ ability to substitute toward goods whose relative prices have fallen. Introduction of new goods : The introduction of new goods makes consumers better off and, in effect, increases the real value of the dollar. But it does not reduce the CPI, because the CPI uses fixed weights. Unmeasured changes in quality : Quality improvements increase the value of the dollar, but are often not fully measured.
CHAPTER 2 The Data of Macroeconomics slide 50 The CPI’s bias The Boskin Panel’s “best estimate”: The CPI overstates the true increase in the cost of living by 1. 1% per year. Result: the BLS has refined the way it calculates the CPI to reduce the bias. It is now believed that the CPI’s bias is slightly less than 1% per year.
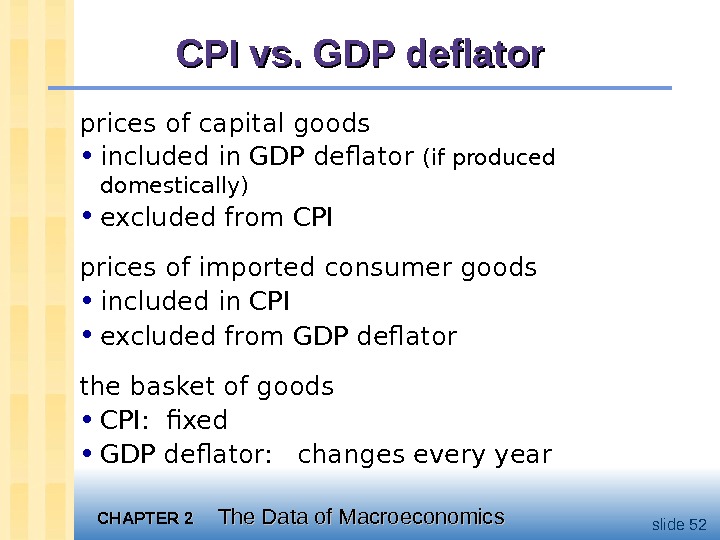
CHAPTER 2 The Data of Macroeconomics slide 52 CPI vs. GDP deflator prices of capital goods • included in GDP deflator (if produced domestically) • excluded from CPI prices of imported consumer goods • included in CPI • excluded from GDP deflator the basket of goods • CPI: fixed • GDP deflator: changes every year
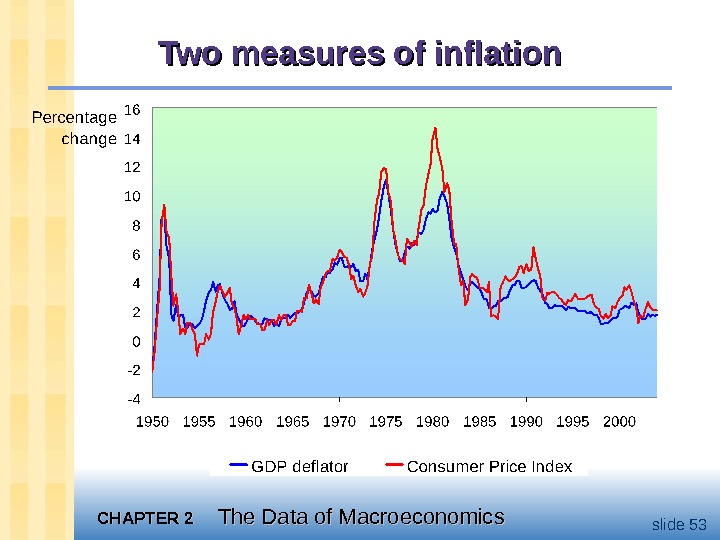
CHAPTER 2 The Data of Macroeconomics slide 53 Two measures of inflation
CHAPTER 2 The Data of Macroeconomics slide 54 Categories of the population employed working at a paid job unemployed not employed but looking for a job labor force the amount of labor available for producing goods and services; all employed plus unemployed persons not in the labor force not employed, not looking for work.
CHAPTER 2 The Data of Macroeconomics slide 55 Two important labor force concepts unemployment rate percentage of the labor force that is unemployed labor force participation rate the fraction of the adult population that ‘participates’ in the labor force
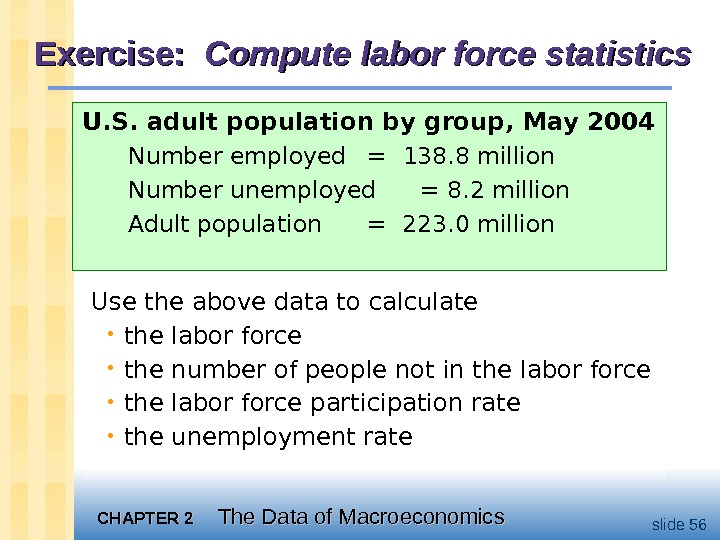
CHAPTER 2 The Data of Macroeconomics slide 56 Exercise: Compute labor force statistics U. S. adult population by group, May 2004 Number employed = 138. 8 million Number unemployed = 8. 2 million Adult population = 223. 0 million Use the above data to calculate • the labor force • the number of people not in the labor force • the labor force participation rate • the unemployment rate
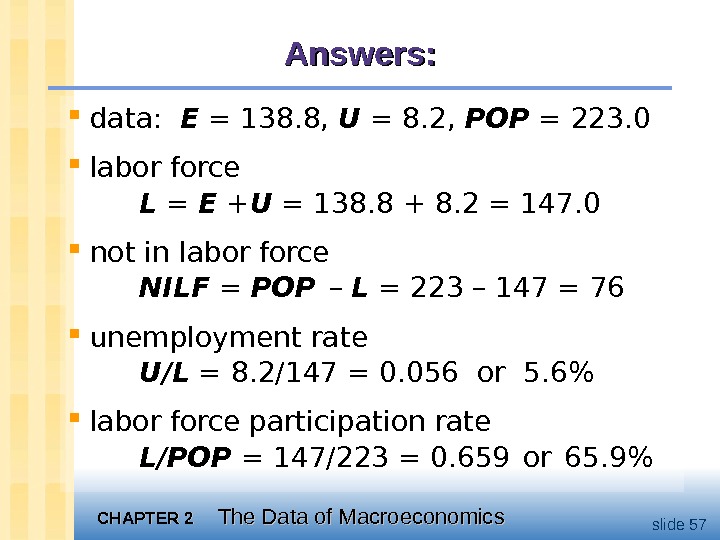
CHAPTER 2 The Data of Macroeconomics slide 57 Answers: data: E = 138. 8, U = 8. 2, POP = 223. 0 labor force L = E + U = 138. 8 + 8. 2 = 147. 0 not in labor force NILF = POP – L = 223 – 147 = 76 unemployment rate U/L = 8. 2/147 = 0. 056 or 5. 6% labor force participation rate L/POP = 147/223 = 0. 659 or 65. 9%
CHAPTER 2 The Data of Macroeconomics slide 59 Employed workers help produce GDP, while unemployed workers do not. So one would expect a negative relationship between unemployment and real GDP. This relationship is clear in the data… Okun’s Law
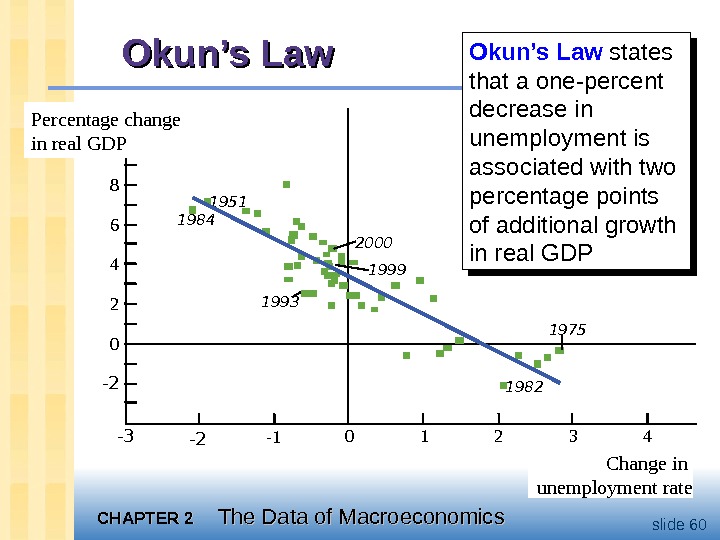
CHAPTER 2 The Data of Macroeconomics slide 60 Okun’s Law 1951 1984 19992000 1993 1982 1975 Change in unemployment rate 10 -3 -2 -1 0 1 2 438 6 4 2 0 -2 Percentage change in real GDP Okun’s Law states that a one-percent decrease in unemployment is associated with two percentage points of additional growth in real GDP
CHAPTER 2 The Data of Macroeconomics slide 61 Chapter Summary 1. Gross Domestic Product (GDP) measures both total income and total expenditure on the economy’s output of goods & services. 2. Nominal GDP values output at current prices; real GDP values output at constant prices. Changes in output affect both measures, but changes in prices only affect nominal GDP. 3. GDP is the sum of consumption, investment, government purchases, and net exports.
CHAPTER 2 The Data of Macroeconomics slide 62 Chapter Summary 4. The overall level of prices can be measured by either the Consumer Price Index (CPI), the price of a fixed basket of goods purchased by the typical consumer the GDP deflator, the ratio of nominal to real GDP 5. The unemployment rate is the fraction of the labor force that is not employed. When unemployment rises, the growth rate of real GDP falls.
CHAPTER 2 The Data of Macroeconomics slide