
Презентация ch06 Exhibit Slides


- Размер: 731 Кб
- Количество слайдов: 16
Описание презентации Презентация ch06 Exhibit Slides по слайдам
Copyright © 2011 Cengage Learning 66 Supply, Demand, and Government Policies
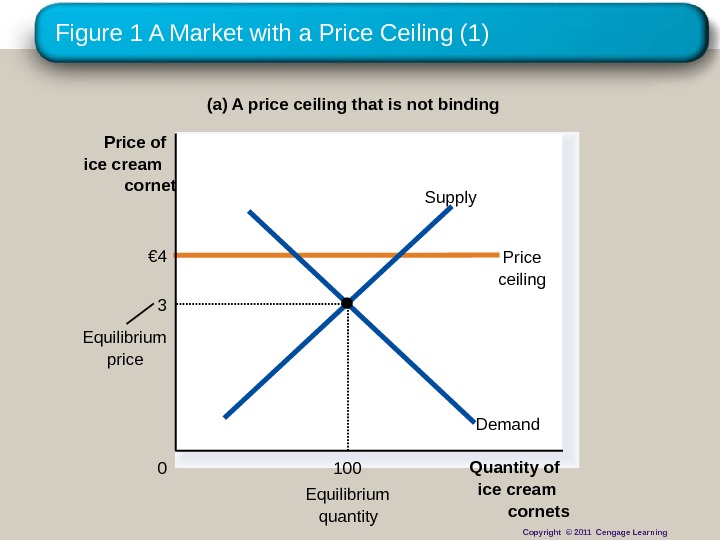
Figure 1 A Market with a Price Ceiling (1) (a) A price ceiling that is not binding Quantity of ice cream cornets 0 Price of ice cream cornet Equilibrium quantity€ 4 Price ceiling Equilibrium price Demand. Supply 3 100 Copyright © 2011 Cengage Learning
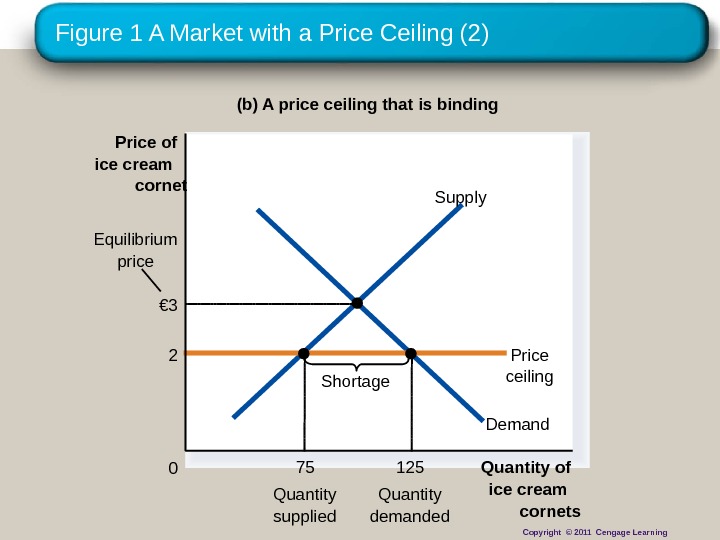
Figure 1 A Market with a Price Ceiling (2) (b) A price ceiling that is binding Quantity of ice cream cornets 0 Price of ice cream cornet Demand. Supply 2 Price ceiling Shortage 75 Quantity supplied 125 Quantity demanded. Equilibrium price € 3 Copyright © 2011 Cengage Learning
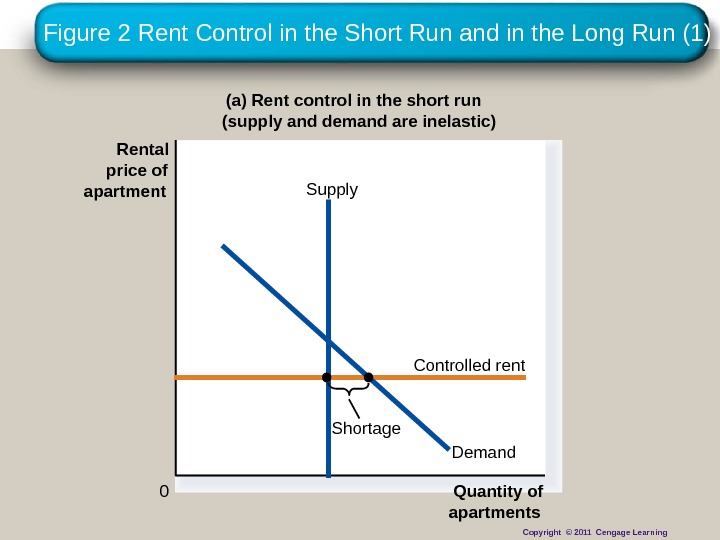
Figure 2 Rent Control in the Short Run and in the Long Run (1) (a) Rent control in the short run (supply and demand are inelastic) Quantity of apartments 0 Supply Controlled rent. Rental price of apartment Demand. Shortage Copyright © 2011 Cengage Learning
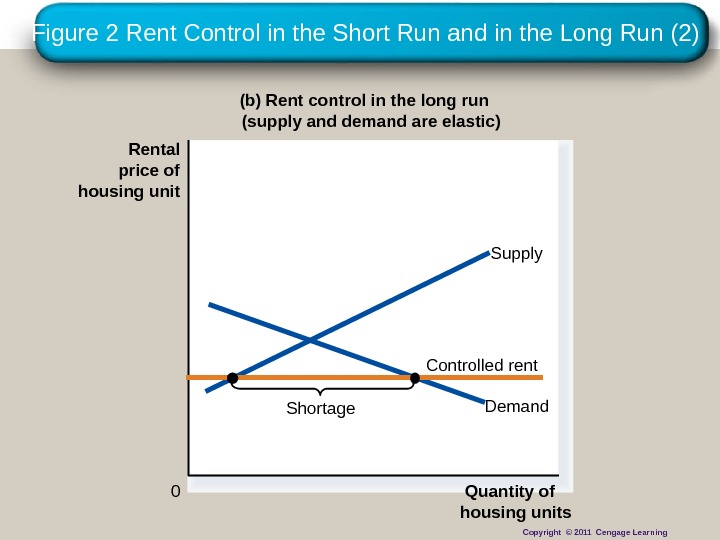
Figure 2 Rent Control in the Short Run and in the Long Run (2) (b) Rent control in the long run (supply and demand are elastic) 0 Rental price of housing unit Quantity of housing units Demand Supply Controlled rent Shortage Copyright © 2011 Cengage Learning
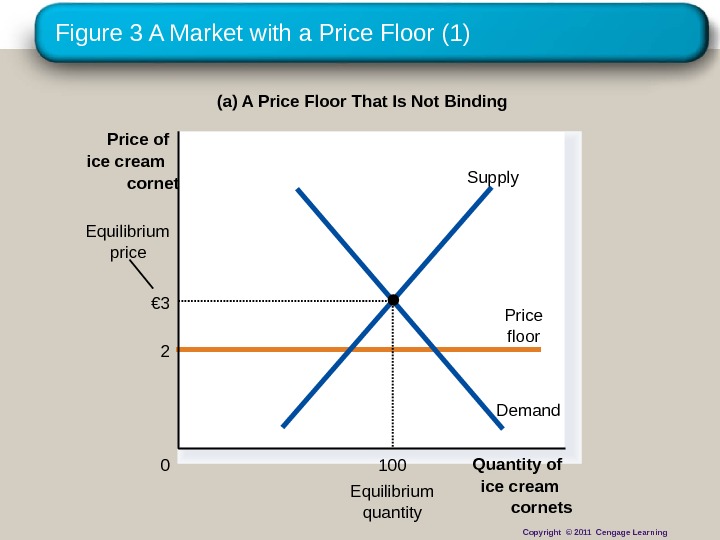
Figure 3 A Market with a Price Floor (1) (a) A Price Floor That Is Not Binding Quantity of ice cream cornets 0 Price of ice cream cornet Equilibrium quantity 2 Price floor. Equilibrium price Demand. Supply € 3 100 Copyright © 2011 Cengage Learning
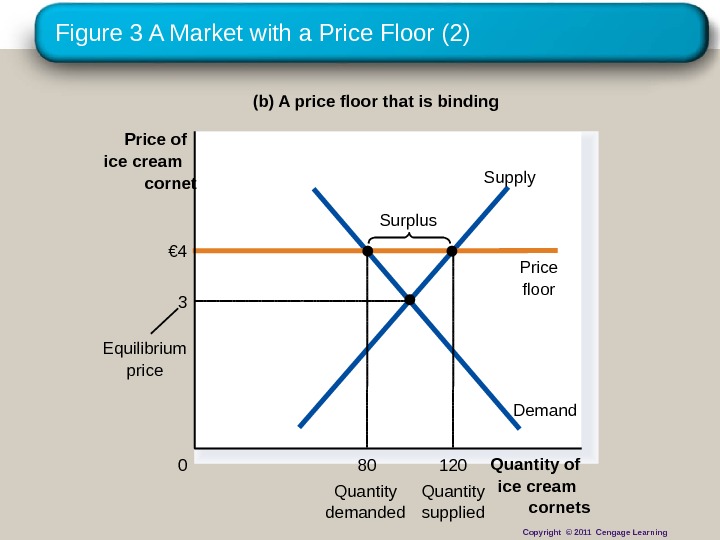
Figure 3 A Market with a Price Floor (2) (b) A price floor that is binding Quantity of ice cream cornets 0 Price of ice cream cornet Demand. Supply € 4 Price floor 80 Quantity demanded 120 Quantity supplied. Equilibrium price Surplus 3 Copyright © 2011 Cengage Learning
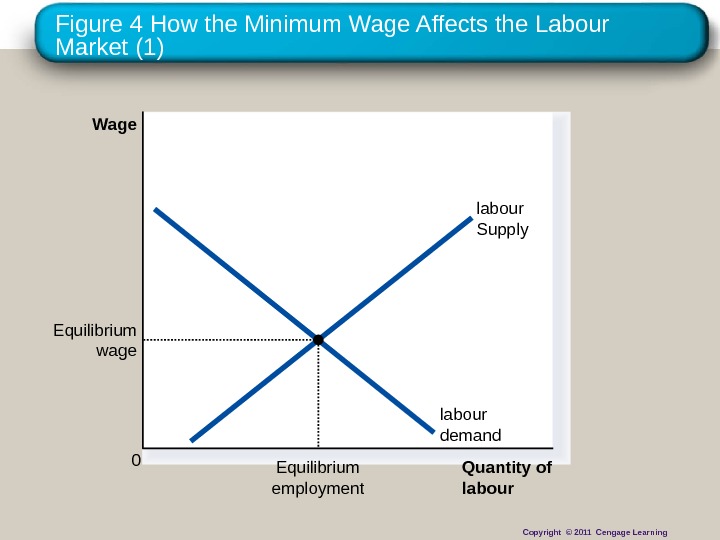
Figure 4 How the Minimum Wage Affects the Labour Market (1) Quantity of labour. Wage 0 labour demand labour Supply Equilibrium employment. Equilibrium wage Copyright © 2011 Cengage Learning
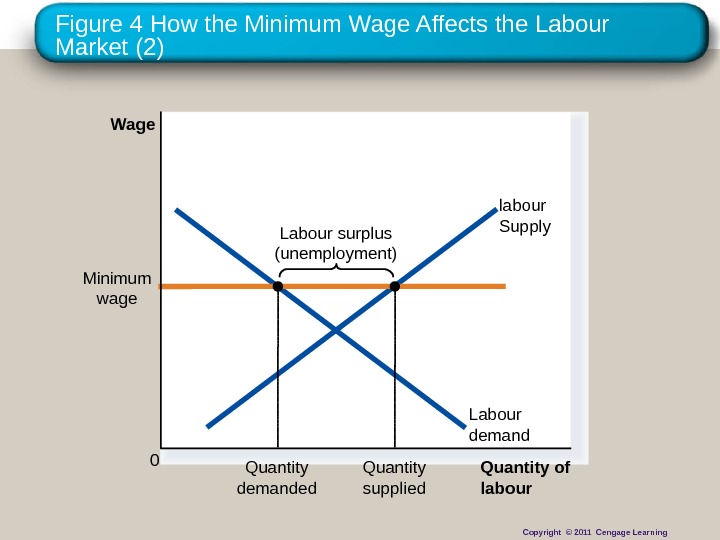
Figure 4 How the Minimum Wage Affects the Labour Market (2) Quantity of labour. Wage 0 labour Supply Labour surplus (unemployment) Labour demand. Minimum wage Quantity demanded Quantity supplied Copyright © 2011 Cengage Learning
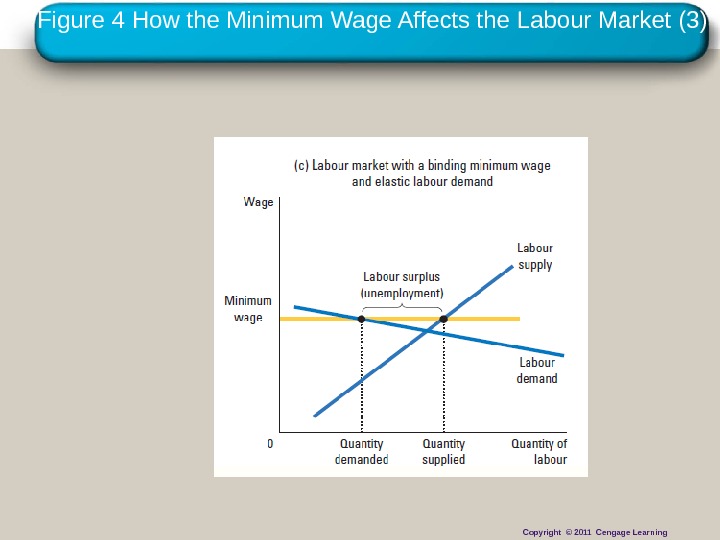
Copyright © 2010 Cengage Learning. Figure 4 How the Minimum Wage Affects the Labour Market (3) Copyright © 2011 Cengage Learning
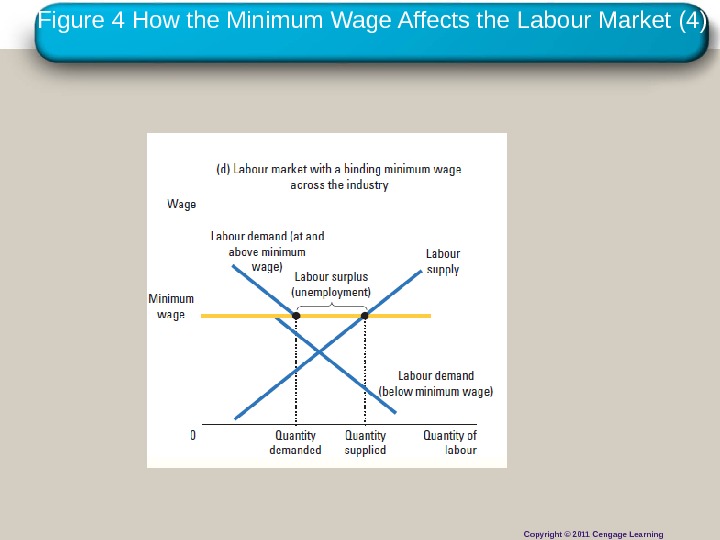
Copyright © 2010 Cengage Learning. Figure 4 How the Minimum Wage Affects the Labour Market (4) Copyright © 2011 Cengage Learning
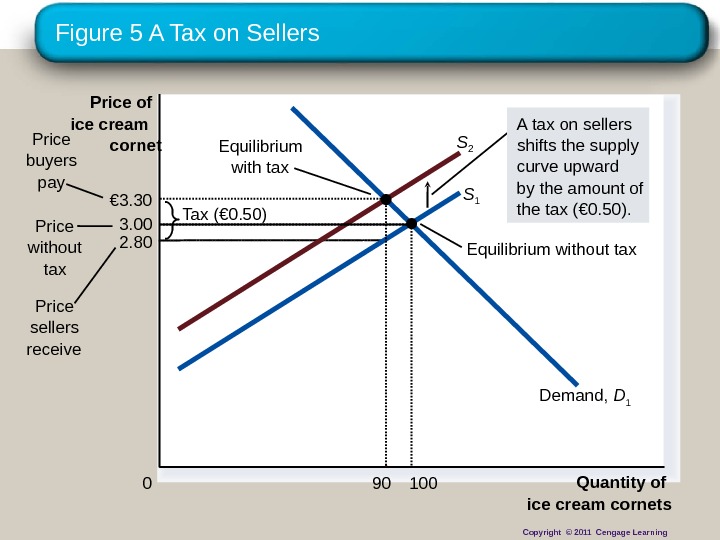
Figure 5 A Tax on Sellers 2. 80 Quantity of ice cream cornets 0 Price of ice cream cornet Price without tax Price sellers receive Equilibrium with tax Equilibrium without tax. Tax ( € 0. 50)Price buyers pay S 1 S 2 Demand, D 1 A tax on sellers shifts the supply curve upward by the amount of the tax ( € 0. 50). 3. 00 100€ 3. 30 90 Copyright © 2011 Cengage Learning
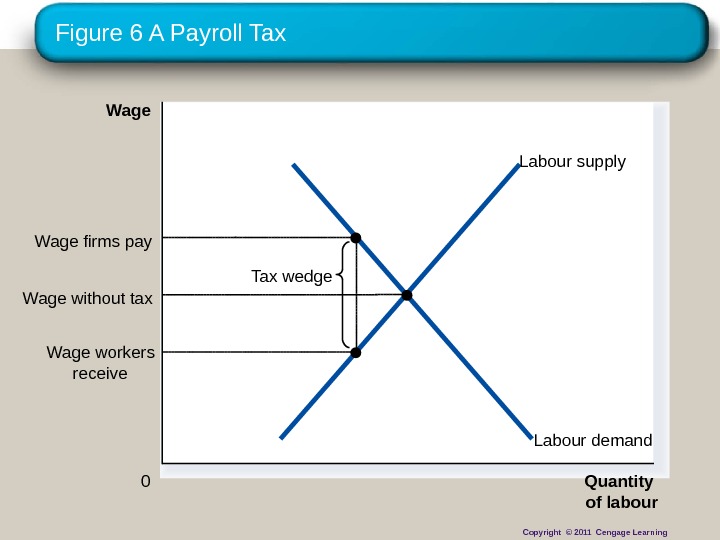
Figure 6 A Payroll Tax Quantity of labour 0 Wage Labour demand. Labour supply Tax wedge Wage workers receive. Wage firms pay Wage without tax Copyright © 2011 Cengage Learning
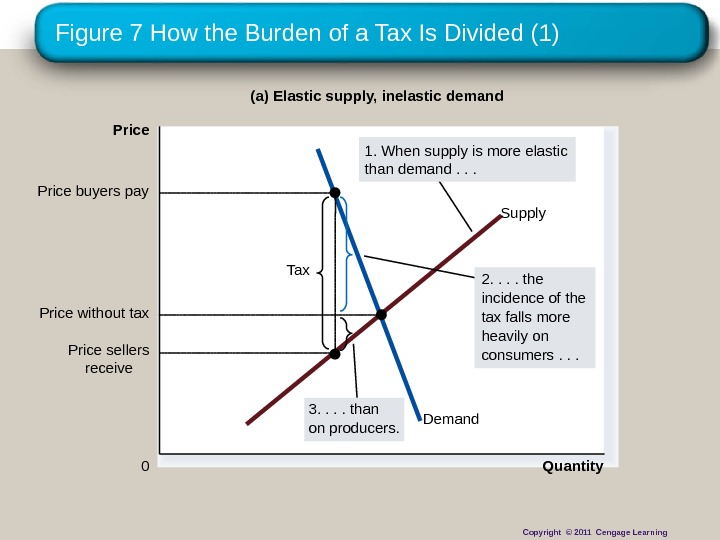
Figure 7 How the Burden of a Tax Is Divided (1) Quantity 0 Price Demand Supply Tax Price sellers receive. Price buyers pay (a) Elastic supply, inelastic demand 2. . the incidence of the tax falls more heavily on consumers. . . 1. When supply is more elastic than demand. . . Price without tax 3. . than on producers. Copyright © 2011 Cengage Learning
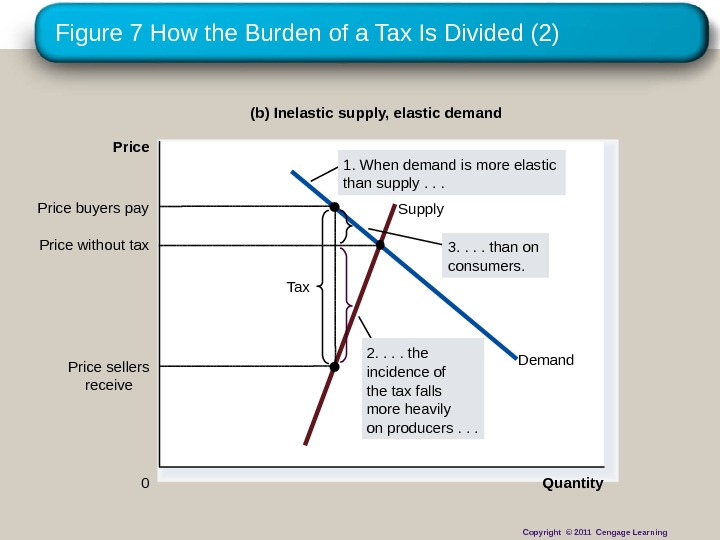
Figure 7 How the Burden of a Tax Is Divided (2) Quantity 0 Price Demand. Supply Tax Price sellers receive. Price buyers pay (b) Inelastic supply, elastic demand 3. . than on consumers. 1. When demand is more elastic than supply. . . Price without tax 2. . the incidence of the tax falls more heavily on producers. . . Copyright © 2011 Cengage Learning
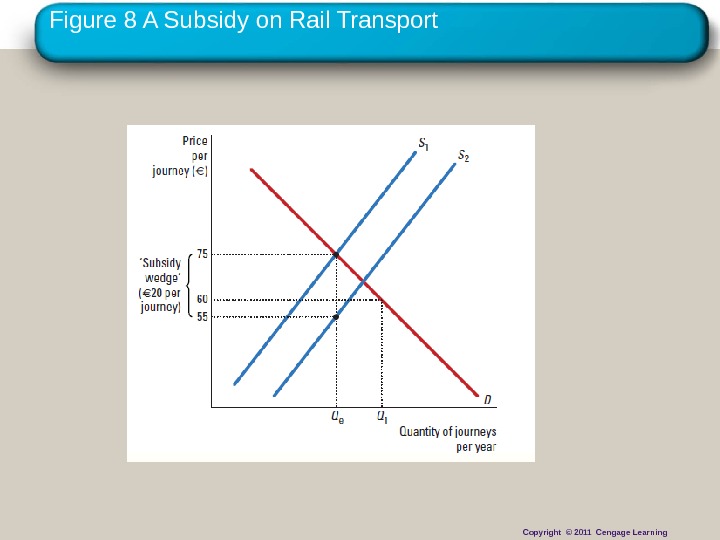
Copyright © 2010 Cengage Learning. Figure 8 A Subsidy on Rail Transport Copyright © 2011 Cengage Learning