

185e0940e16730f9f94d526128ea208d.ppt
- Количество слайдов: 17
 Presentation to Khayelitsha Commission of Inquiry Jeremy Seekings University of Cape Town January 2014
 1. Evidence on Khayelitsha 2. What is the population of Khayelitsha? 3. Economic stresses: – – poverty and unemployment service delivery 4. Socio-economic factors and crime/violence 5. The character of Khayelitsha: Popular attitudes towards the police and informal justice Part 3 summarises the main body of my written report. Parts 1, 2, 4 and 5 supplement my report, in response to previous discussion in the Commission and questions posed to me by Mr Arendse and Mr Masuku.
 Evidence on Khayelitsha Quantitative data • 1988 Survey of Residential and Migration Histories") (1) Evidence on Khayelitsha Quantitative data • 1988 Survey of Residential and Migration Histories of Khayelitsha residents (Stellenbosch) • 2000 Khayelitsha / Mitchell’s Plain Survey (UCT) • 2000 -2007 Khayelitsha Panel Study (UCT) • 2001 Population Census (Stats. SA, national) • 2002 Cape Town African Urban Poor Study (UWC) • 2002 Khayelitsha Integrated Family Survey I (Princeton) • 2002 -2009 Cape Area Panel Study (UCT, covered all of CT) • 2005 Cape Area Study (UCT, covered all of CT) • 2005 Khayelitsha Integrated Family Survey II (Princeton) • 2006 Socio-economic Profiling of Urban Renewal Nodes Survey (CCC / Stellenbosch, covered Khayelitsha and Mitchell’s Plain) • 2011 Population Census (Stats. SA, national) Qualitative data: mostly in-depth interviews, very little fully ethnographic research: • most conducted by individual researchers, not publicly available • Transcribed, archived interviews: e. g. – 40 interviews in Khayelitsha about violence, 2008 (UCT) – 20 interviews in Khayelitsha about unemployment, 2009 -9 (UCT)
(1) Evidence on Khayelitsha Quantitative data • 1988 Survey of Residential and Migration Histories of Khayelitsha residents (Stellenbosch) • 2000 Khayelitsha / Mitchell’s Plain Survey (UCT) • 2000 -2007 Khayelitsha Panel Study (UCT) • 2001 Population Census (Stats. SA, national) • 2002 Cape Town African Urban Poor Study (UWC) • 2002 Khayelitsha Integrated Family Survey I (Princeton) • 2002 -2009 Cape Area Panel Study (UCT, covered all of CT) • 2005 Cape Area Study (UCT, covered all of CT) • 2005 Khayelitsha Integrated Family Survey II (Princeton) • 2006 Socio-economic Profiling of Urban Renewal Nodes Survey (CCC / Stellenbosch, covered Khayelitsha and Mitchell’s Plain) • 2011 Population Census (Stats. SA, national) Qualitative data: mostly in-depth interviews, very little fully ethnographic research: • most conducted by individual researchers, not publicly available • Transcribed, archived interviews: e. g. – 40 interviews in Khayelitsha about violence, 2008 (UCT) – 20 interviews in Khayelitsha about unemployment, 2009 -9 (UCT)
 The population of Khayelitsha: Why should we have any confidence in the Census") (2) The population of Khayelitsha: Why should we have any confidence in the Census data? Age group Population 0 – 19 146 000 20 – 59 234 000 60 + 12 000 total 392 000 Data from 2011 Census Voting age 260 000 Attending school 86 000 Households 119 000 Average household size 3. 2
(2) The population of Khayelitsha: Why should we have any confidence in the Census data? Age group Population 0 – 19 146 000 20 – 59 234 000 60 + 12 000 total 392 000 Data from 2011 Census Voting age 260 000 Attending school 86 000 Households 119 000 Average household size 3. 2
 How census data on the population of Khayelitsha compares with other sources of data Age group Population 0 – 19 146 000 20 – 59 234 000 60 + 12 000 total 392 000 Voting age 260 000 Attending school 86 000 Households 119 000 Average household size 3. 2 SASSA (Dec 2013): 91 000 child support grants / foster care grants / care dependency grants 12 000 disability grants 11 000 old age pensions Consistent with survey data IEC: 152 000 voters registered in 10/12 wards (Jan 2014) WCED: School enrolment ? ? Previous censuses consistent with aerial photographs and on-the-ground fieldwork 2011 census is consistent with independent survey fieldwork up to 2009
") Aerial photograph of an “EA” (enumeration area)
Aerial photograph of an “EA” (enumeration area)
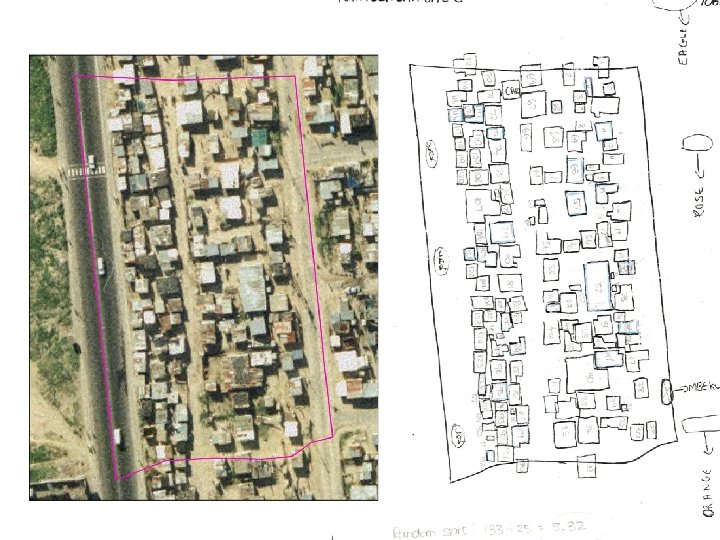
 Dense, informal settlement: “Compact segment sampling”
:") The population structure Ward 18 (not all Khayelitsha):
The population structure Ward 18 (not all Khayelitsha):
 Conclusions on the population Evidence • Census data broadly consistent with independent sources of data, including survey fieldwork • But: Possible undercounting of (a) men and (b) foreigners? My conclusion: • a 10% under-estimate is possible, but • a 25% under-estimate would be very surprising • So I am very confident that the population < 0. 5 m, and it is probably < 440, 000 Why might people over-estimate the population? 1. Estimating the population through observation is difficult 2. The populations of other similar areas (e. g. Philippi etc, Delft, Wallacedene, Mfuleni, Lwandle) may have grown, giving the impression of general growth 3. Khayelitsha has grown physically, with more houses across a larger area 4. people underestimate the importance of declining household size 5. Mobility between households (and multiple household membership) both (a) within CT and (b) between E Cape and CT gives the impression of larger households than is the case at any one time
 Economic stresses: poverty and unemployment • Poverty is widespread in Khayelitsha – Somewhere") (3) Economic stresses: poverty and unemployment • Poverty is widespread in Khayelitsha – Somewhere between one-third and two-thirds of the population live in poverty (depending on the choice of poverty line) – Half of the population of Khayelitsha is in the poorest income quintile for CT as a whole – median household income in 2011 = about R 20 k p. a. (compared to R 40 k p. a. in CT as a whole) (according to 2011 Census data, broadly consistent with survey data) – Unemployment rates are high (c 50% for young men and women in their 20 s; lower among older people); many unemployed people do not actively look for work (i. e. they have been ‘discouraged’ from active job search) • In economic terms, Khayelitsha (overall) is similar to other major ‘African’ areas of Cape Town • Poverty coexists with ‘modest prosperity’: Khayelitsha is not homogeneous: – there are significant differences between better-off areas (e. g. Ikwezi Park, Ilitha Park, Graceland) and poorer areas – The employment rate is probably close to 50% – Many working people have better-paid, semi-skilled, skilled or white-collar occupations
(3) Economic stresses: poverty and unemployment • Poverty is widespread in Khayelitsha – Somewhere between one-third and two-thirds of the population live in poverty (depending on the choice of poverty line) – Half of the population of Khayelitsha is in the poorest income quintile for CT as a whole – median household income in 2011 = about R 20 k p. a. (compared to R 40 k p. a. in CT as a whole) (according to 2011 Census data, broadly consistent with survey data) – Unemployment rates are high (c 50% for young men and women in their 20 s; lower among older people); many unemployed people do not actively look for work (i. e. they have been ‘discouraged’ from active job search) • In economic terms, Khayelitsha (overall) is similar to other major ‘African’ areas of Cape Town • Poverty coexists with ‘modest prosperity’: Khayelitsha is not homogeneous: – there are significant differences between better-off areas (e. g. Ikwezi Park, Ilitha Park, Graceland) and poorer areas – The employment rate is probably close to 50% – Many working people have better-paid, semi-skilled, skilled or white-collar occupations
 Service delivery • Housing: – about 50% of the population live in formal housing, – about 50% in shacks (mostly in informal settlements; some in backyards) • Water and electricity – 1/3 of the population shares communal taps – Almost all households have access to electricity (legal or illegal) • Sanitation: – about ¼ of the population does not have permanent, on-site flush toilets – PFTs and shared chemical toilets may entail a compromise short-term response, but they are often inadequately emptied and maintained • Schools: 33 public primary schools + 10 public secondary schools • Health care – ambulances – 2009: 13, 500 people receiving ARVs through 10 sites • Social grants
 Socio-economic factors and crime • What kinds of evidence? – Neighbourhood-level data: how") (4) Socio-economic factors and crime • What kinds of evidence? – Neighbourhood-level data: how localised? How accurate (given underreporting)? – Survey data on perpetrators of crime: how accurate? – Survey data on victims of crime – In-depth interviews with perpetrators and victims • Crime is not homogeneous: domestic violence, house-breaking, assault, robbery-with-assault, etc • Findings – The relationships between shacks/poverty/unemployment and the perpetration of violence/crime are not straightforward – Most unemployed young men do not perpetrate violence or other crime – Non-poor as well as poor young men face both the incentive and the opportunity to commit crime – Drinking is widely implicated in violence, and heavy drinking costs money (NB patterns of alcohol consumption) • Issues of access to where crime occurs – Location of crime: shebeens; public roads/paths (see VPUU maps) – Access into informal settlements: “no go” areas for whom?
(4) Socio-economic factors and crime • What kinds of evidence? – Neighbourhood-level data: how localised? How accurate (given underreporting)? – Survey data on perpetrators of crime: how accurate? – Survey data on victims of crime – In-depth interviews with perpetrators and victims • Crime is not homogeneous: domestic violence, house-breaking, assault, robbery-with-assault, etc • Findings – The relationships between shacks/poverty/unemployment and the perpetration of violence/crime are not straightforward – Most unemployed young men do not perpetrate violence or other crime – Non-poor as well as poor young men face both the incentive and the opportunity to commit crime – Drinking is widely implicated in violence, and heavy drinking costs money (NB patterns of alcohol consumption) • Issues of access to where crime occurs – Location of crime: shebeens; public roads/paths (see VPUU maps) – Access into informal settlements: “no go” areas for whom?
 Attitudes towards the police Evidence: • • • Widespread dissatisfaction with the police,") (5) Attitudes towards the police Evidence: • • • Widespread dissatisfaction with the police, especially in informal settlements Widespread scepticism about reporting crime to the police (at least until recently) Some support for ‘informal justice’ (i. e. punishment of alleged criminals without legal process) Why? 2 explanations 1. 2. Because many people in Khayelitsha – most originally from rural areas, some via Crossroads etc in the 1980 s – are suspicious of the police etc, and prefer to take the law into their own hands, or Because people want a higher, ‘modern’ quality of policing (and other public services) In my assessment, the evidence points more to the second of these explanations. • • • People in Khayelitsha are involved in and demand many aspects of ‘modern’ life: technologies (including communication and information technologies), commercial services (shops etc), public services (health care, education, water, electricity, sanitation, grants and pensions) and ‘decent’ work dissatisfaction with public services is widespread: criticism of toilets does not mean that people do not want toilets; it means that people want better toilets; similarly, criticism of the police is a criticism of the quality of public services There is, at most, minority support for vigilantism, and this support reflects the demand for quick and certain punishment of criminals more than an endorsement of extra-state action.
(5) Attitudes towards the police Evidence: • • • Widespread dissatisfaction with the police, especially in informal settlements Widespread scepticism about reporting crime to the police (at least until recently) Some support for ‘informal justice’ (i. e. punishment of alleged criminals without legal process) Why? 2 explanations 1. 2. Because many people in Khayelitsha – most originally from rural areas, some via Crossroads etc in the 1980 s – are suspicious of the police etc, and prefer to take the law into their own hands, or Because people want a higher, ‘modern’ quality of policing (and other public services) In my assessment, the evidence points more to the second of these explanations. • • • People in Khayelitsha are involved in and demand many aspects of ‘modern’ life: technologies (including communication and information technologies), commercial services (shops etc), public services (health care, education, water, electricity, sanitation, grants and pensions) and ‘decent’ work dissatisfaction with public services is widespread: criticism of toilets does not mean that people do not want toilets; it means that people want better toilets; similarly, criticism of the police is a criticism of the quality of public services There is, at most, minority support for vigilantism, and this support reflects the demand for quick and certain punishment of criminals more than an endorsement of extra-state action.
 The legitimacy of violent collective retribution Question posed to half of our sample of young men and women aged 20 -29, in 2009: “Neighbours catch a young man stealing a radio / assaulting a woman. They beat him up rather than take him the police. Is it right or wrong for them to beat him? ” Khayelitsha % Other “African” areas in CT % Yes, it is right 24 19 Maybe, it depends 15 17 No, it is wrong 60 61 Don’t know 1 3 Total 100 n 359 294 Source: 2009 5 th wave of Cape Area Panel Study
 Why do we think that this is evidence of demand for effective punishment rather than a general hostility towards the state? The other half of our sample was given an alternative question: “The police catch a young man stealing a radio / assaulting a woman. They beat him up to teach him a lesson, and do not arrest him and charge him in court. Is it right or wrong for them to beat him? ” Responses in Khayelitsha only Caught and beaten by neighbours % Caught and beaten by the police % Yes, it is right 24 18 Maybe, it depends 15 14 No, it is wrong 60 67 Don’t know 1 1 Total 100 n 359 388 Source: 2009 5 th wave of Cape Area Panel Study
 Thank you