3c1ad550dc0f59a9fbecf28599ec18dd.ppt
- Количество слайдов: 42


Presentation to BRAG meeting 2 nd December 2010 Implications of the UK National Ecosystem Assessment (NEA) and the Wales Natural Environment Framework (NEF) for biodiversity research in Wales Shaun Russell Director, Wales Environment Research Hub Some material in this presentation is currently under review and may not be permitted for full public circulation
")
The UK National Ecosystem Assessment (NEA)
 published. 2005 • House of")
Background to the NEA • Millennium Ecosystem Assessment (MA) published. 2005 • House of Commons Environmental Audit Committee recommended that, ‘ultimately the Government should conduct a full MA-type assessment for the UK to enable the identification and development of effective policy responses to ecosystem service degradation’. • Hilary Benn announced Ecosystem Assessment for England in July 2008. • Expanded to include Scotland, Wales & Northern Ireland, and started in 2009. • Submission for publication - February 2011.

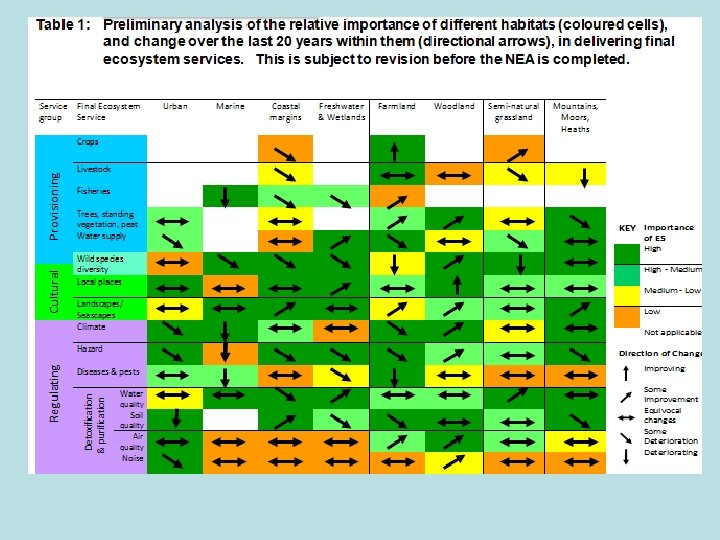
UK Ecosystems The NEA has defined ecosystems based upon recognised "Broad Habitats" within the UK, as used in the official Countryside Survey. Freshwater, wetlands and floodplains Urban Marine Coastal margins Mountains, moors and Semi-natural grasslands heathlands Enclosed farmland Woodland 4
 Supporting services • soil formation • nutrient")
Ecosystem Goods & Services (benefits for people) Supporting services • soil formation • nutrient cycling • water cycling • primary production Regulating services • climate • hazard control (flood/erosion) • pests & disease • pollination • pollution (noise/toxic) • air/soil/water quality Provisioning services • food • fibre • fuel • bio-materials • water Cultural services • aesthetic • cultural heritage/ sense of place • education • health • recreation • spiritual/religious • tourism 5

Scope of the UK NEA The NEA is: 1. providing a high-level picture of current status and trends in ecosystems (habitats) and ecosystem services since 2 nd WW 2. looking to the future (2050) to evaluate change under plausible scenarios and considering a range of response options © U Bac

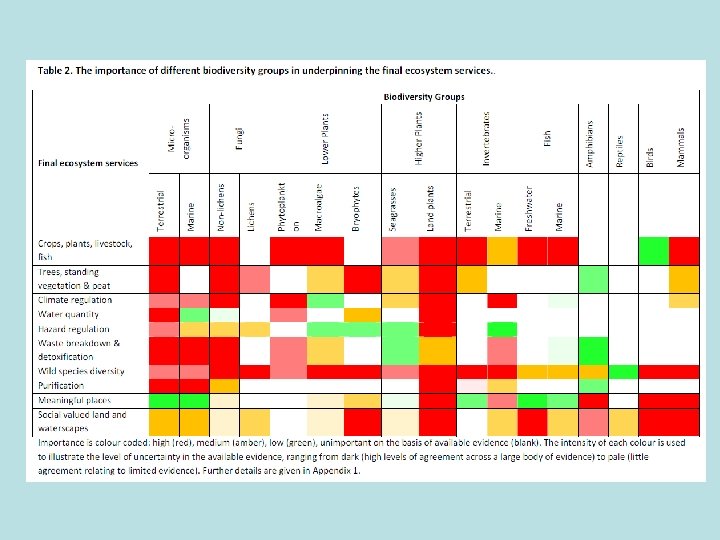
Biodiversity underpins ecosystems and ecosystem services 7

Chapters of the UK NEA • • • • Introduction Conceptual Framework Drivers of change Biodiversity Ecosystems (broad habitats) - 8 Ecosystem services - 4 UK’s dependence on non-UK ecosystem services Valuation of human economic and social well-being Health and well-being Identification of knowledge gaps Plausible futures (Scenarios) Response options Country syntheses - 4 © Vander Wal
")
All NEA draft documents available through website with password access, (or contact Shaun Russell) http: //uknea. unep-wcmc. org

In progress – same diagram for Wales

29 -page document with 117 key messages under the headings:

UK NEA Biodiversity Key Messages • It is well established that biodiversity plays a wide range of functional roles in ecosystems and in the processes that underpin ecosystem services. • Paucity of available evidence means that we are currently unable to comprehensively quantify the relationships between UK biodiversity and the ecosystem services it supports. • Significant biodiversity loss has been documented in the UK over the last 50 years. Monitoring data for a number of biodiversity groups is poor, so that a comprehensive assessment of status and trends is not currently possible. • Land-use change and pollution are the major drivers of change across biodiversity groups in the UK (agricultural intensification, diffuse pollution, point-source pollution from urban habitats, and air pollution, e. g. acid rain).

Biodiversity Values - examples • total costs of biodiversity management in the UK £ 1. 1 bn per annum • annual regional values for wildlife ranged from £ 0. 42 million for brown hares to £ 2 million for red squirrels, in North Yorkshire • Value of resource extractive services from lowland wetlands in England: (recreational and commercial fishing and hunting, harvest of natural material and fuel) = £ 95/ha/yr • Value of benefit enhancing services from lowland wetlands in England: (biodiversity, carbon storage, flood control, , surface and ground water supply, water quality improvement, non-consumptive recreation, amenity and aesthetic services) = £ 3, 500 - £ 5, 500/ha/year

Uncertainty UK-NEA Key Messages Report, June 2010 - “Evidence shows that, in general terms, the level and stability of ecosystem services tends to improve with increasing biodiversity” UK-NEA Economic Assessment of Biodiversity Report, September 2010 “Global and UK scale studies reveal little correlation between areas rich in biodiversity (according to nature conservation designations) and high ecosystem service delivery”
 we have high quality")
• For culturally important biodiversity groups (e. g. birds) we have high quality data on status and trends, but poor information on the cultural services associated with these groups • Conversely we have high quality data on status and trends for provisioning and regulating services, but frequently lack high quality monitoring data for the key biodiversity groups that underpin these services (micro-organisms, fungi and some plants).

The Challenge “Bridging this cultural divide represents perhaps the most important research and policy challenge relating to biodiversity in the UK” (UKNEA draft 2010) To address this challenge, we need a shift in emphasis towards a more functional understanding of biodiversity. We need to: 1) improve our understanding of how different biodiversity groups underpin ecosystem services 2) identify key indicator groups for changes which have an important impact on ecosystem services 3) develop a comprehensive, integrated monitoring programme for biodiversity in the UK around these indicator groups to understand how biodiversity change in the UK will impact upon our ecosystem services as a result of future environmental and social change.

NEA - Wales

NEA Country Syntheses Contributing Lead Authors Northern Ireland Sue Christie Director, Northern Ireland Environment Link Wales Shaun Russell Director, Wales Environment Research Hub Scotland Richard Aspinall Director, Macaulay Land Use Research Institute England – Pam Berry, Oxford University Environmental Change Institute

Some valuable and recent publications which have assisted the Wales Synthesis Chapter of the NEA, e. g:

Wales does not yet have an assessment of species extinctions as exists for England

The Countryside Survey shows Wales to have medium to high values for habitat complexity/diversity, total species richness per 1 km square and mean species richness per plot for each 1 km square [Countryside Survey Technical Report 10/07 June 2010]

Wales Biodiversity trends - examples Native and non-native species richness of repeat survey plots in Wales, from the Countryside Survey (2009). Wales butterflies - habitat specialists declining
.")
Wales wild birds population index (taken from Statistical Directorate 2009).

Source: WBP - 2010 Targets
 Region 4: Irish Sea")
The Health and Biodiversity of Welsh marine habitats (Defra, 2010) Region 4: Irish Sea Region 5: Western & Celtic Sea

Economic Valuation – the Welsh environment • The environment collectively generated £ 8. 8 bn of output for the Welsh economy in the year 2000 [Valuing Our Environment Report, 2001] • Value of wildlife related activity to the Welsh Economy – total output £ 1. 9 bn per annum [Wildlife Economy Wales Report, 2007] • Gross Value Added from the domestic forestry sector in Wales - £ 429 million [Office of National Statistics, 2004] • Overall economic impact of the coastal and marine environment equates to nearly £ 5 bn per annum income to businesses in Wales [Valuing our Marine and Coastal Environment, 2006] • Value of inland sea fisheries in Wales - £ 148 million [Nautilus Consultants Report, 2000] • Tourists spent an estimated £ 4. 2 bn in Wales in 2007 [Tourism Satellite Account for Wales, 2007]

Pollination • The production function value of biotic pollination as a contribution to UK crop market value in 2007 was £ 430 million, comprised of: England - £ 367 million, Northern Ireland - £ 19 million, Scotland - £ 43 million, Wales - £unknown. “The Welsh government does not collect the same level of detail on crops because of the hilly character of land which makes vast areas of land unsuitable for arable crops. Areas of some crops (e. g. flax, linseed, sugar beet) are therefore very negligible” • Honey bees have shown a 23% decline in Wales between 1985 and 2005, with this trend expected to continue for the present.
![From - Christie et al. (forthcoming [not for circulation]). Economic valuation of the UK](https://present5.com/presentation/3c1ad550dc0f59a9fbecf28599ec18dd/image-30.jpg "From - Christie et al. (forthcoming [not for circulation]). Economic valuation of the UK")
From - Christie et al. (forthcoming [not for circulation]). Economic valuation of the UK BAP Seven ecosystem services associated with the BAP were evaluated: Wild food, Non-food products, climate regulation, water regulation, ‘sense of place’; charismatic species and non-charismatic species. In the study, both ‘use’ and ‘passive use’ values for the ecosystem services delivered by the Welsh BAP were assessed. Table 1 provides a summary of the marginal (use + passive use) values for (i) the loss off and (ii) the enhancement of the seven ecosystem services delivered by the Welsh BAP.
 Equivalent to England’s Natural Environment White Paper NEF launched")
Wales Natural Environment Framework (NEF) Equivalent to England’s Natural Environment White Paper NEF launched partly in response to the failure to achieve 2010 biodiversity targets in Wales NEF supportive of the existing and over-arching “Wales Environment Strategy” (2006).

NEF launched by Wales Environment Minister Jane Davidson and European Environment Commissioner Janez Potocnik in September 2010

NEF Programme Aim: To secure a stronger focus on sustainable management of land water by making ecosystems and their services central to our decision making - thereby ensuring that Wales’ natural and cultural capital is maintained and enhanced. Specific objectives of the Framework: • Ensure that our dependence and impact on the natural environment, the challenges of climate change and the value of the ecosystem services we use, are fully reflected in the decisions that we make as government and society, • Develop an evidence base for our ecosystems so that we have a better basis for decisions that reflects risks and opportunities and that provides the information required to adopt strategies and mechanisms that defend future well being; • Place the current Biodiversity Action Plan targets and actions for species and habitats in a new framework that expands the current approach to include new delivery partners and that reflects the need to secure ongoing security in the function, resilience and health of Welsh ecosystems and the services that they provide.

NEF outcomes- • Productive environment for food and fibre integrated into a mixed land use • Clean water supply • Provision of flood protection and water storage • Carbon managed and stored in soils and biomass • Healthy ecosystems with a diverse variety of habitats and thriving wildlife communities, both marine and terrestrial • Society engaged in valuing and managing ecosystems and benefiting from them • A diverse landscape, culturally rich • Natural environment providing people with the opportunity to enjoy the outdoors - land sea • Jobs and income generation maximised - green tourism and enjoyment of our cultural heritage • Health benefits of access and recreation maximised
 B. Partnerships")
NEF WORKSTREAMS A. Regulatory and Management Approaches (EAW – Chris Mills/Kathryn Monk) B. Partnerships for Delivery (CCW – Morgan Parry/John Taylor) C. Evidence (SEED – Chris Lea) C 1 Geographical Information (SEED – Colin Chapman) C 2 Economic Evidence (WAG - Andrew Hobden) C 3 Habitats, Species and Ecosystem Health (CCW – David Parker)

Example 1: draft work plan for the economics workstream of the NEF outlines three tasks: 1. VALUE OF ECOSYSTEM SERVICES IN WALES • “To develop a methodology outlining how the value of ecosystem services in Wales should be estimated. ” including: • “Collate economic data. . . illustrating how the proposed methodology should be applied” • “Identify gaps in the economic evidence base in Wales and consider the appropriate options for addressing those gaps” 2. POLICY ANALYSIS AND DECISION-MAKING • “To advise on how best to incorporate environmental issues and ecosystem services into policy analysis and the decision making process, and to review WAG’s existing appraisal tools/guidance to ensure that environmental considerations are being applied consistently and in line with best practice. ” 3. NATURAL CAPITAL ACCOUNTING • “To consider whethere is any value in developing formal accounting procedures for natural capital in Wales”

Example 2: work on Biodiversity Indicators for NEF and the Wales Environment Strategy • Wales has adopted a target of halting and reversing the decline in biodiversity by 2026. • Wales will therefore develop a small number of headline indicators that measure the state and rate of change of biodiversity in Wales.

Biodiversity Indicators for Wales – Progress Report May 2010 Neal Hockley, James Gibbons and Sue Hearn – Bangor University

No data 800% category C 700% category B 600% category A 500% 400% 300% 200% 100% s s nt nt la la lo w er p p er gh hi ve in am s/ ile pt re Taxonomic group rte ph br ib ia at es ns h fis s rd bi am m al s 0% m Proportion of taxonomic group covered. . Distribution of quality datasets

Two headline indicators recommended, measuring diversity and abundance aggregated across all taxonomic groups for which data is available, and all habitats. Indicators should be presented using percentile or probability distributions with no measures of central tendency. These indicators are demonstrated in the figures below.

• The NEF programme board has recognised that the various workstreams are not going to be in a position to meet all objectives by the original February/March 2011 deadline. It has therefore been decided that the workstreams will continue into 2012. However, the programme board has asked for an update paper in February/March informing WAG’s Environment Minister on the progress that has been made.

• For further information please contact: • s. russell@bangor. ac. uk • Tel: 01248 382918 Wales Environment Research Hub website: www. werh. org
3c1ad550dc0f59a9fbecf28599ec18dd.ppt