5d45422e7765187961e622a493f5ae29.ppt
- Количество слайдов: 58
 Presentation 36492 Oracle. AS Tuning Techniques Donald K. Burleson Col. John Garmany Burleson Oracle Consulting

 Oracle Training by Don Burleson
 www. rampant. cc Oracle Books from $9. 95
 Guidehorse. com
 John Garmany Retired Army Lt. Col. - West Point Graduate - Masters Degree Information Systems - Graduate Certificate in Software Engineering - Airborne Ranger
 Ÿ On-site custom Oracle training Ÿ Oracle Tuning & Oracle Support Ÿ Remote DBA Support
 Topics: Ÿ Oracle. AS Tuning Approach Ÿ Oracle. AS Monitoring Ÿ Tuning with RAM Ÿ Load Balancing
 Enhancement request for Oracle. AS: Ÿ Add a new global parameter: run_fast = yes
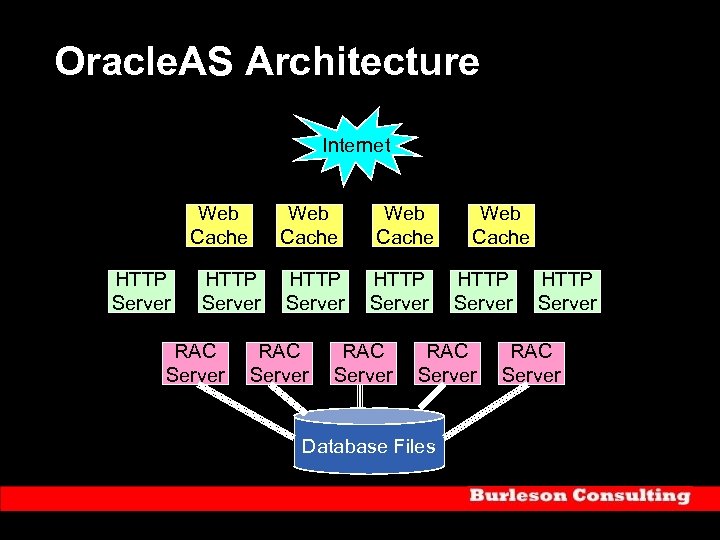 Oracle. AS Architecture Internet Web Cache HTTP Server RAC Server Web Cache HTTP Server RAC Server Database Files HTTP Server RAC Server
 Keys to Success ŸParameter Tuning ŸRAM Cache Tuning ŸServer Tuning
 Parameter Tuning Ÿ Oracle. AS parameters - Adjusting the Oracle 9 i. AS configuration parameters for each Oracle 9 i. AS component has influence performance and throughput. Ÿ Database parameters – Because most Oracle 9 i. AS systems are disk I/O intensive, adjusting the Oracle database parameters for the Infrastructure database (iasdb) and the back-end database can heavily influence performance.
 RAM Tuning Ÿ Data buffer tuning – Adding RAM to the database db_cache_size on the Oracle Infrastructure and backend database can greatly reduce disk I/O and improve throughput. Ÿ Web cache tuning – Adding RAM to the Oracle 9 i. AS web cache can improve the delivery rates of HTML and XML though the Oracle HTTP Server (OHS).
 Server tuning Ÿ Hardware configuration – Adding RAM of CPU resources to existing servers will improve throughput on the server Ÿ Hardware load balancing – The addition of new servers to the Oracle 9 i. AS farm and relocating Oracle 9 i. AS components. Spare servers can be configured with both Web Cache and App Server, and the appropriate components can be started as-needed. Ÿ Server parameter tuning – Adjusting the parameters on your server can have a huge impact on the performance of the Oracle. AS.
 Monitoring Techniques Ÿ Response Time Monitoring – DCM and OEM Ÿ Wait Event Monitoring – Determine the source of Latency for each Component. Ÿ Server Resources – Once the farm is tuned, overloads can be addressed with dynamic server allocation.
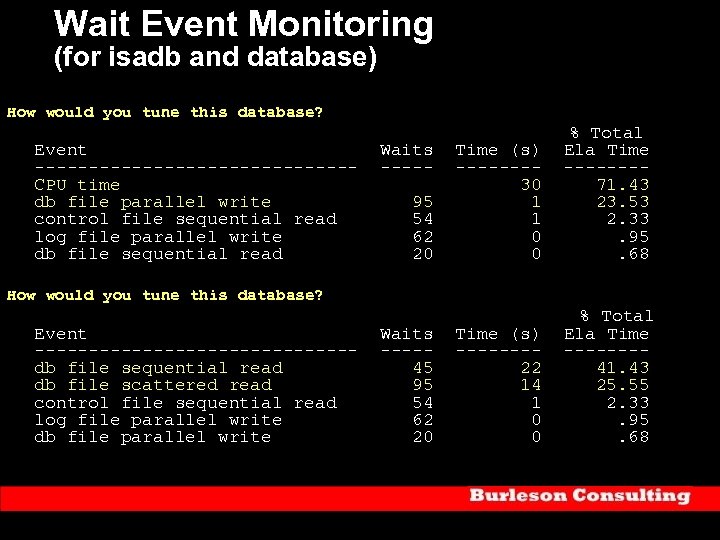 Wait Event Monitoring (for isadb and database) How would you tune this database? % Total Event Waits Time (s) Ela Time --------------- -------CPU time 30 71. 43 db file parallel write 95 1 23. 53 control file sequential read 54 1 2. 33 log file parallel write 62 0 . 95 db file sequential read 20 0 . 68 How would you tune this database? % Total Event Waits Time (s) Ela Time --------------- -------db file sequential read 45 22 41. 43 db file scattered read 95 14 25. 55 control file sequential read 54 1 2. 33 log file parallel write 62 0 . 95 db file parallel write 20 0 . 68
 Oracle. AS Monitoring
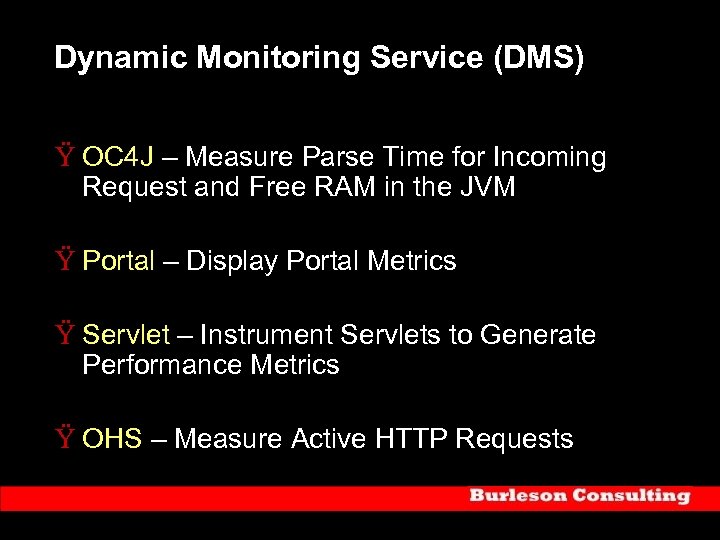 Dynamic Monitoring Service (DMS) Ÿ OC 4 J – Measure Parse Time for Incoming Request and Free RAM in the JVM Ÿ Portal – Display Portal Metrics Ÿ Servlet – Instrument Servlets to Generate Performance Metrics Ÿ OHS – Measure Active HTTP Requests
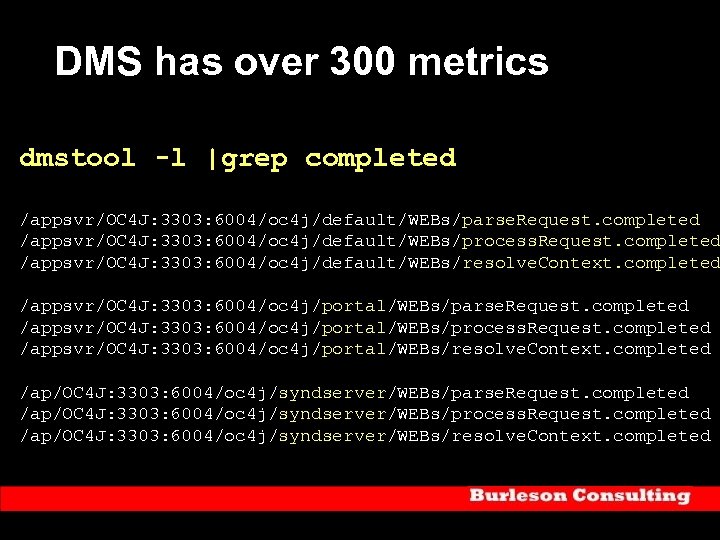 DMS has over 300 metrics dmstool -l |grep completed /appsvr/OC 4 J: 3303: 6004/oc 4 j/default/WEBs/parse. Request. completed /appsvr/OC 4 J: 3303: 6004/oc 4 j/default/WEBs/process. Request. completed /appsvr/OC 4 J: 3303: 6004/oc 4 j/default/WEBs/resolve. Context. completed /appsvr/OC 4 J: 3303: 6004/oc 4 j/portal/WEBs/parse. Request. completed /appsvr/OC 4 J: 3303: 6004/oc 4 j/portal/WEBs/process. Request. completed /appsvr/OC 4 J: 3303: 6004/oc 4 j/portal/WEBs/resolve. Context. completed /ap/OC 4 J: 3303: 6004/oc 4 j/syndserver/WEBs/parse. Request. completed /ap/OC 4 J: 3303: 6004/oc 4 j/syndserver/WEBs/process. Request. completed /ap/OC 4 J: 3303: 6004/oc 4 j/syndserver/WEBs/resolve. Context. completed
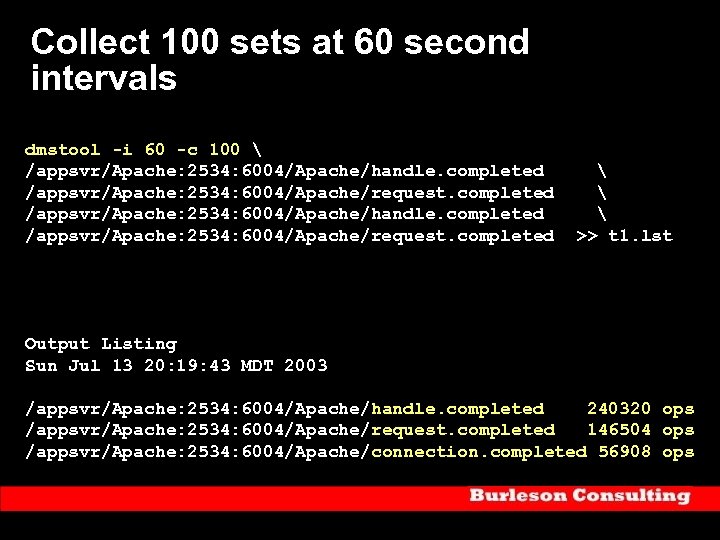 Collect 100 sets at 60 second intervals dmstool -i 60 -c 100 /appsvr/Apache: 2534: 6004/Apache/handle. completed /appsvr/Apache: 2534: 6004/Apache/request. completed >> t 1. lst Output Listing Sun Jul 13 20: 19: 43 MDT 2003 /appsvr/Apache: 2534: 6004/Apache/handle. completed 240320 ops /appsvr/Apache: 2534: 6004/Apache/request. completed 146504 ops /appsvr/Apache: 2534: 6004/Apache/connection. completed 56908 ops
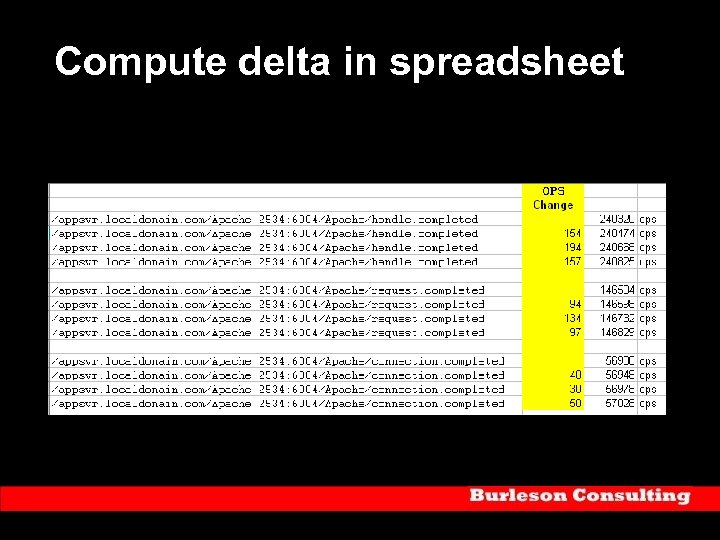 Compute delta in spreadsheet
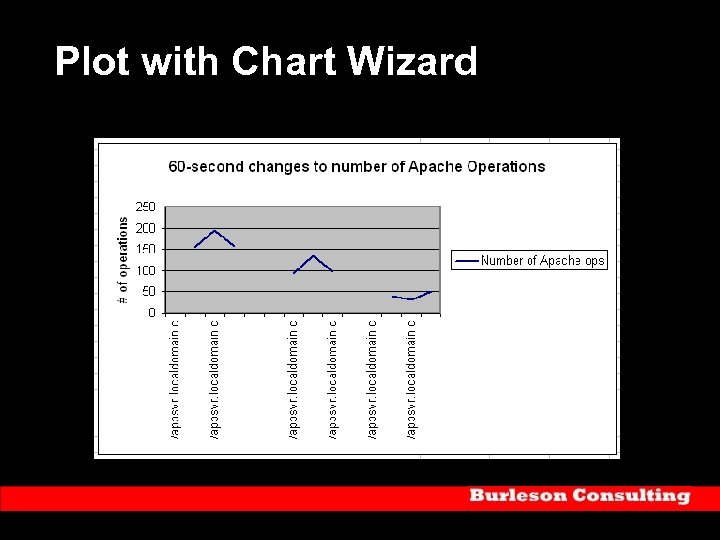 Plot with Chart Wizard
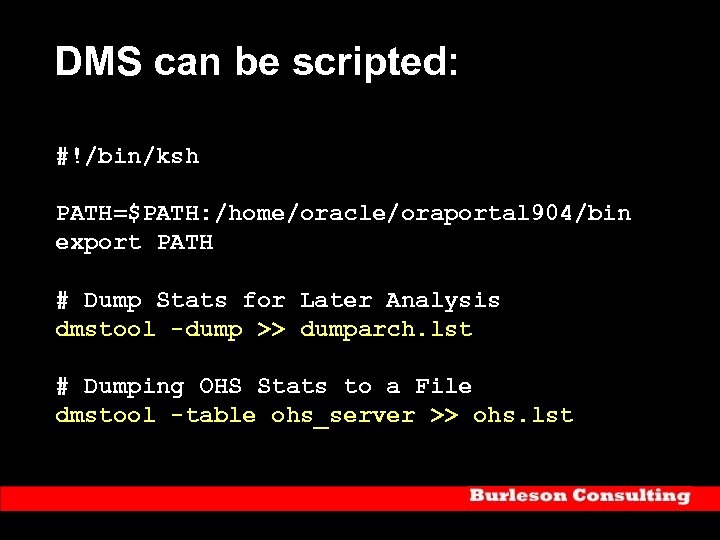 DMS can be scripted: #!/bin/ksh PATH=$PATH: /home/oracle/oraportal 904/bin export PATH # Dump Stats for Later Analysis dmstool -dump >> dumparch. lst # Dumping OHS Stats to a File dmstool -table ohs_server >> ohs. lst
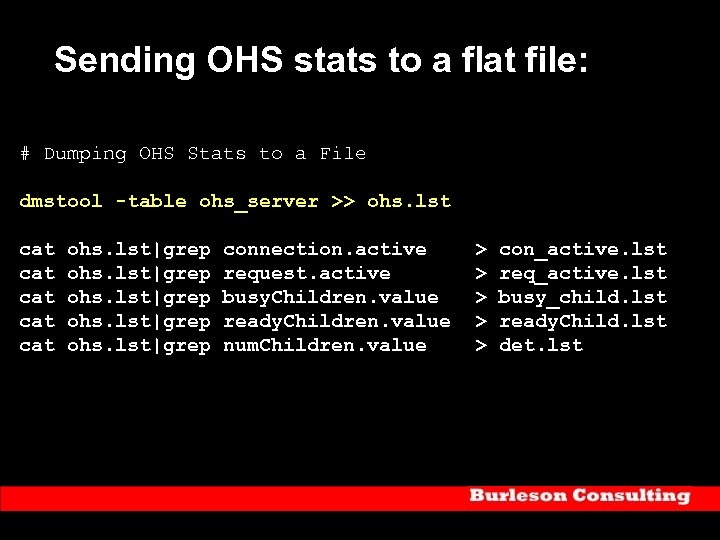 Sending OHS stats to a flat file: # Dumping OHS Stats to a File dmstool -table ohs_server >> ohs. lst cat cat cat ohs. lst|grep connection. active request. active busy. Children. value ready. Children. value num. Children. value > > > con_active. lst req_active. lst busy_child. lst ready. Child. lst det. lst
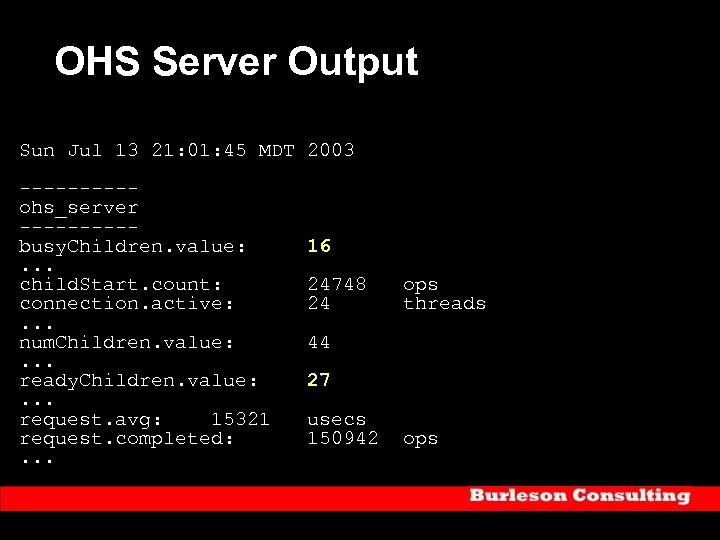 OHS Server Output Sun Jul 13 21: 01: 45 MDT 2003 -----ohs_server -----busy. Children. value: 16. . . child. Start. count: 24748 ops connection. active: 24 threads. . . num. Children. value: 44. . . ready. Children. value: 27. . . request. avg: 15321 usecs request. completed: 150942 ops. . .
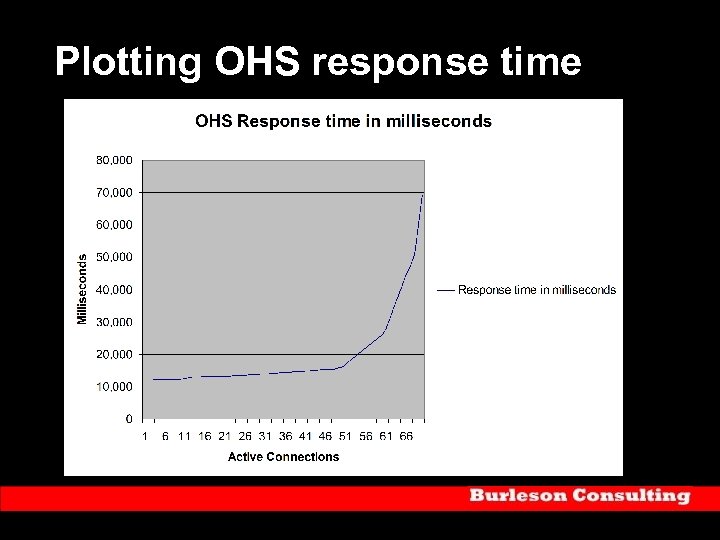 Plotting OHS response time
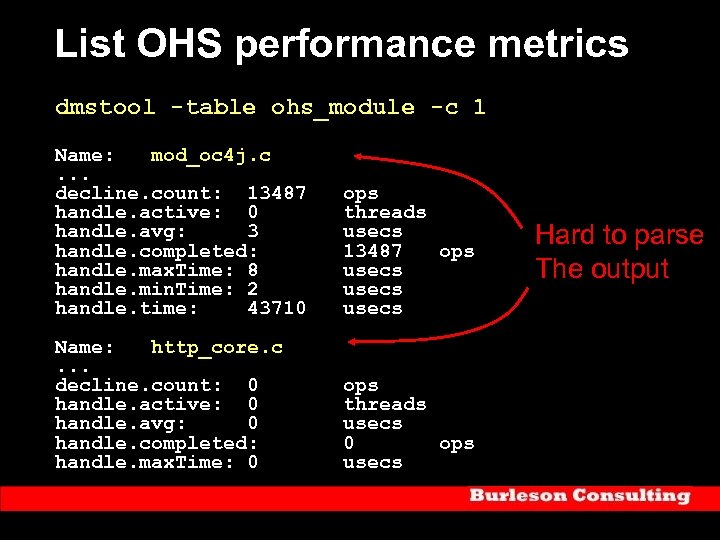 List OHS performance metrics dmstool -table ohs_module -c 1 Name: mod_oc 4 j. c. . . decline. count: 13487 handle. active: 0 handle. avg: 3 handle. completed: handle. max. Time: 8 handle. min. Time: 2 handle. time: 43710 ops threads usecs 13487 ops usecs Name: http_core. c. . . decline. count: 0 handle. active: 0 handle. avg: 0 handle. completed: handle. max. Time: 0 ops threads usecs 0 ops usecs Hard to parse The output
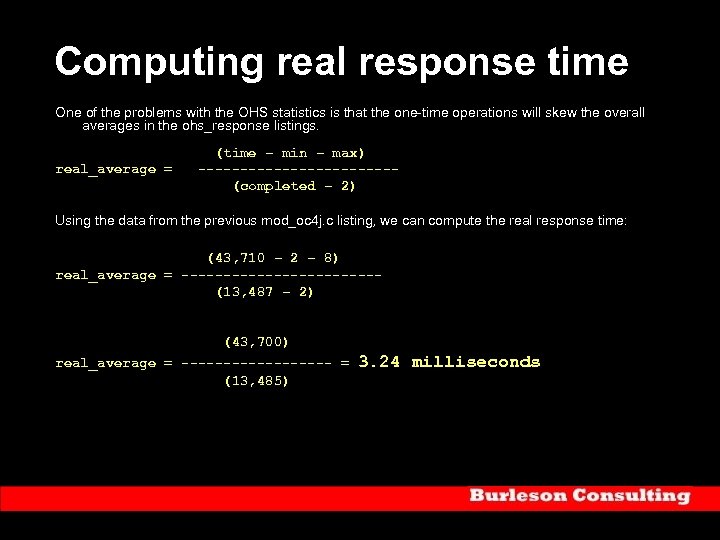 Computing real response time One of the problems with the OHS statistics is that the one-time operations will skew the overall averages in the ohs_response listings. real_average = (time – min – max) ------------(completed – 2) Using the data from the previous mod_oc 4 j. c listing, we can compute the real response time: (43, 710 – 2 – 8) real_average = ------------(13, 487 – 2) (43, 700) real_average = --------- = (13, 485) 3. 24 milliseconds
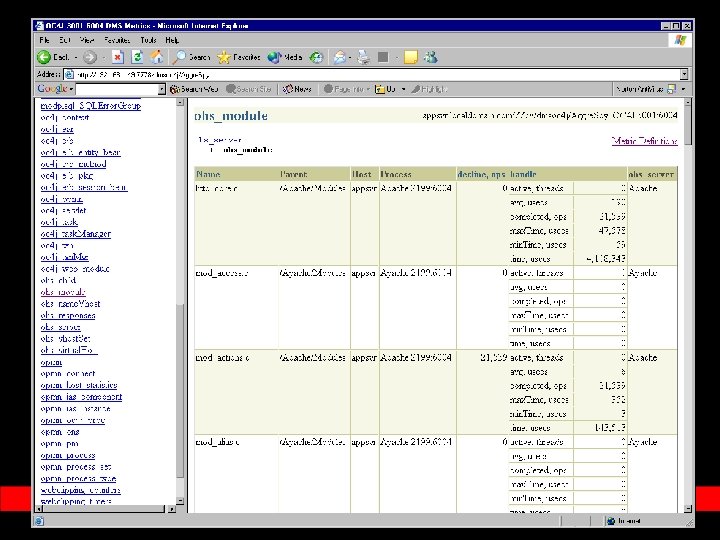
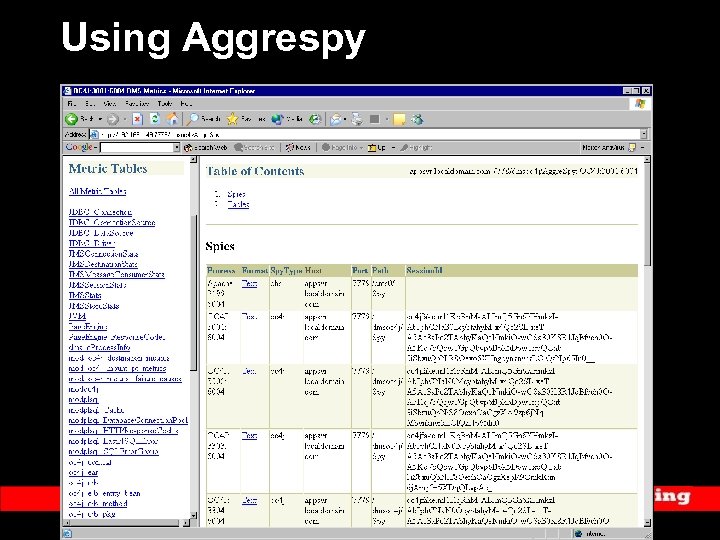 Using Aggrespy
 Web Cache Monitoring
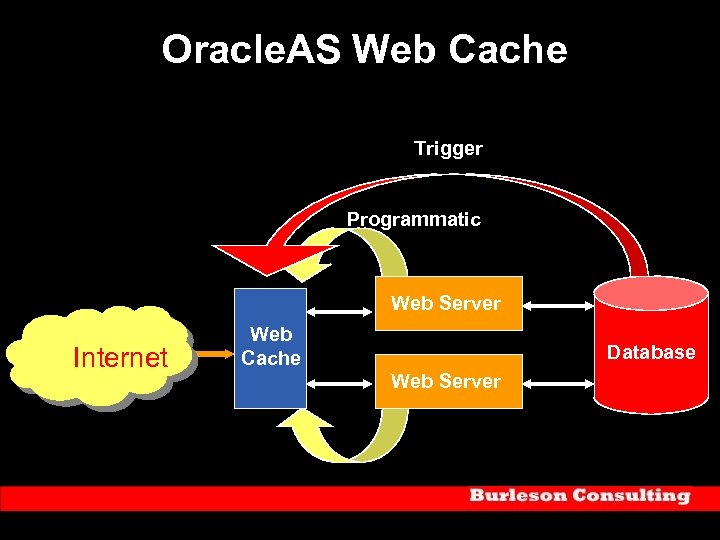 Oracle. AS Web Cache Trigger Programmatic Web Server Internet Web Cache Database Web Server
 Web Cache Tuning Ÿ Static and Dynamic Information Ÿ Cacheability Rules Ÿ Cache Invalidations Ÿ Multi-version HTML Ÿ Rule for Each Page Component
 Web Cache statistics: Ÿ Requests – This shows the current, average and max transaction per second. The backlog section indicates that the Web Cache is overwhelmed another Web Cache server should be started. Ÿ Errors – This summarized the network, site busy and particlepage errors for the Web Cache. Ÿ Misses – This section shows cacheable and non-cacheable misses along with the number of refreshes for the Web Cache. Ÿ Compression – The compression sections show the total amount of RAM saved by compression and provides a great gauge of the effectiveness of the Web Cache.
 Oracle. AS Load Balancing
 Software Load Balancing Ÿ Web Cache to OHS – Web Cache interrogates OHS statistics and routes to least loaded. Ÿ OHS to Database Listener – OHS Distributes load to multiple Listeners Ÿ Database Listener – Listeners to Multiple Dispatchers under MTS, that load balance to least loaded RAC Instance.
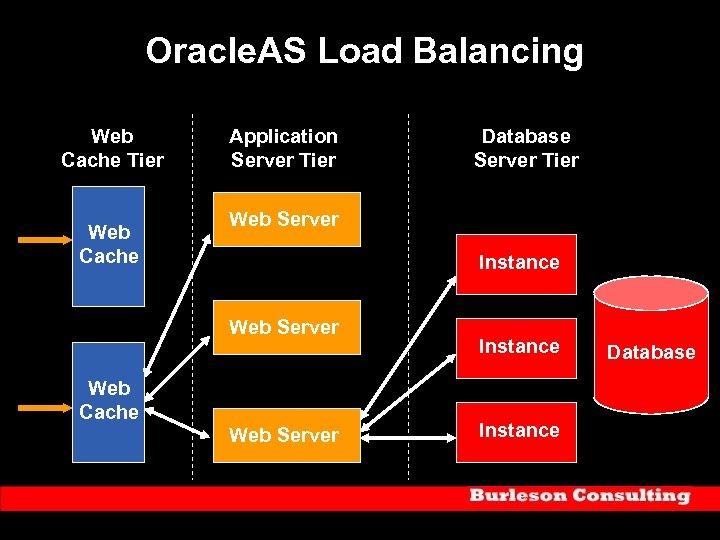 Oracle. AS Load Balancing Web Cache Tier Web Cache Application Server Tier Database Server Tier Web Server Instance Web Server Web Cache Web Server Instance Database
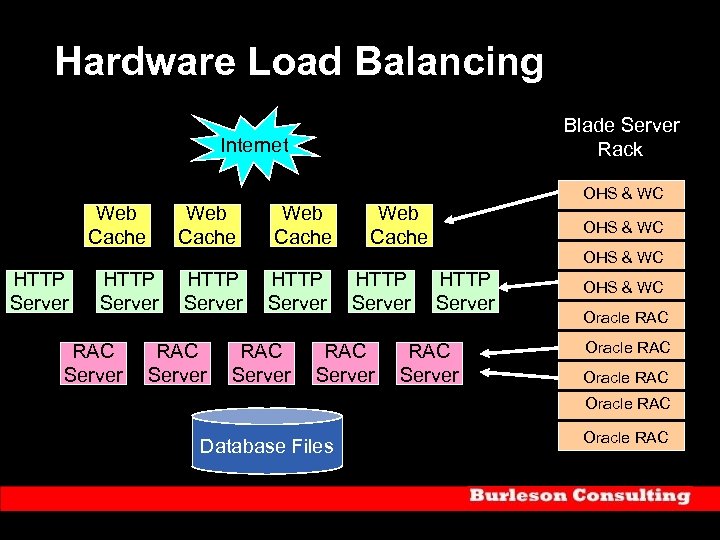 Hardware Load Balancing Blade Server Rack Internet Web Cache HTTP Server RAC Server Web Cache HTTP Server RAC Server OHS & WC HTTP Server RAC Server OHS & WC Oracle RAC Database Files Oracle RAC
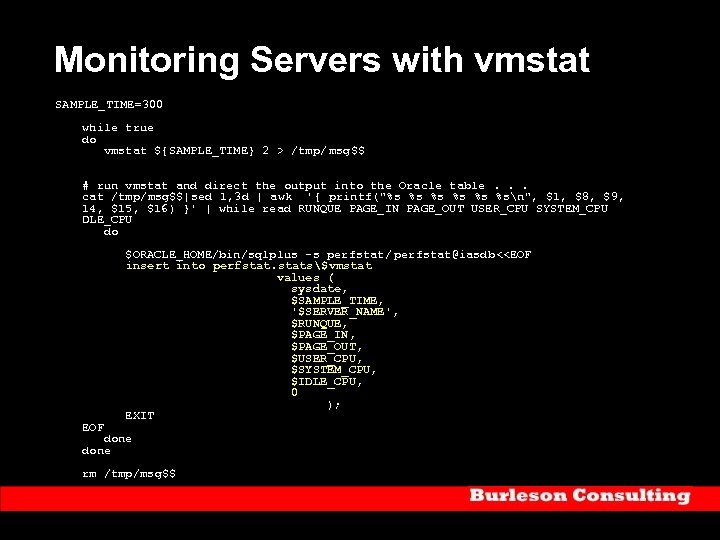 Monitoring Servers with vmstat SAMPLE_TIME=300 while true do vmstat ${SAMPLE_TIME} 2 > /tmp/ msg$$ # run vmstat and direct the output into the Oracle table. . . cat /tmp/msg$$|sed 1, 3 d | awk '{ printf("%s %sn", $1, $8, $9, 14, $15, $16) }' | while read RUNQUE PAGE_IN PAGE_OUT USER_CPU SYSTEM_CPU DLE_CPU do $ORACLE_HOME/bin/sqlplus -s perfstat/ perfstat@iasdb<
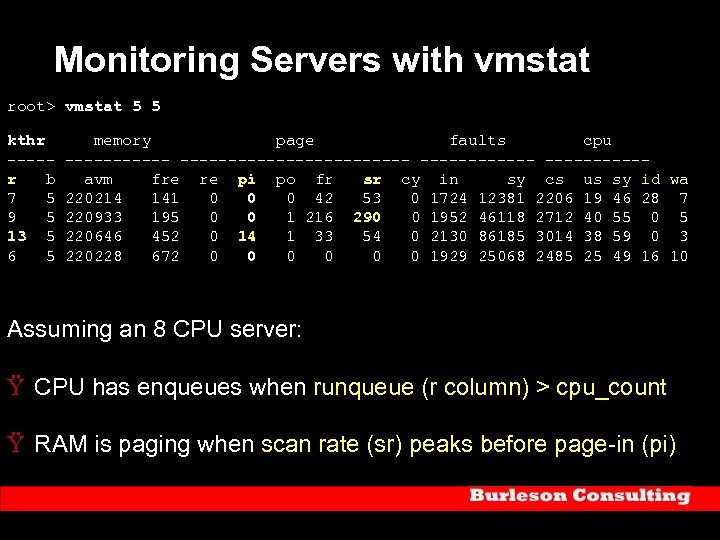 Monitoring Servers with vmstat root> vmstat 5 5 kthr memory page faults cpu ------------ ------r b avm fre re pi po fr sr cy in sy cs us sy id wa 7 5 220214 141 0 0 0 42 53 0 1724 12381 2206 19 46 28 7 9 5 220933 195 0 0 1 216 290 0 1952 46118 2712 40 55 0 5 13 5 220646 452 0 14 1 33 54 0 2130 86185 3014 38 59 0 3 6 5 220228 672 0 0 0 1929 25068 2485 25 49 16 10 Assuming an 8 CPU server: Ÿ CPU has enqueues when runqueue (r column) > cpu_count Ÿ RAM is paging when scan rate (sr) peaks before page-in (pi)
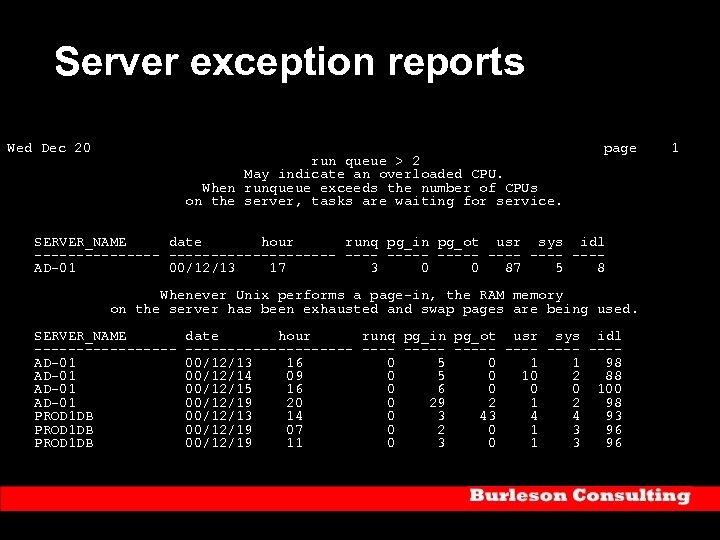 Server exception reports Wed Dec 20 page 1 run queue > 2 May indicate an overloaded CPU. When runqueue exceeds the number of CPUs on the server, tasks are waiting for service. SERVER_NAME date hour runq pg_in pg_ot usr sys idl -------------------- ---- AD-01 00/12/13 17 3 0 0 87 5 8 Whenever Unix performs a page-in, the RAM memory on the server has been exhausted and swap pages are being used. SERVER_NAME date hour runq pg_in pg_ot usr sys idl -------------------- ---- AD-01 00/12/13 16 0 5 0 1 1 98 AD-01 00/12/14 09 0 5 0 10 2 88 AD-01 00/12/15 16 0 6 0 0 0 100 AD-01 00/12/19 20 0 29 2 1 2 98 PROD 1 DB 00/12/13 14 0 3 4 4 93 PROD 1 DB 00/12/19 07 0 2 0 1 3 96 PROD 1 DB 00/12/19 11 0 3 0 1 3 96
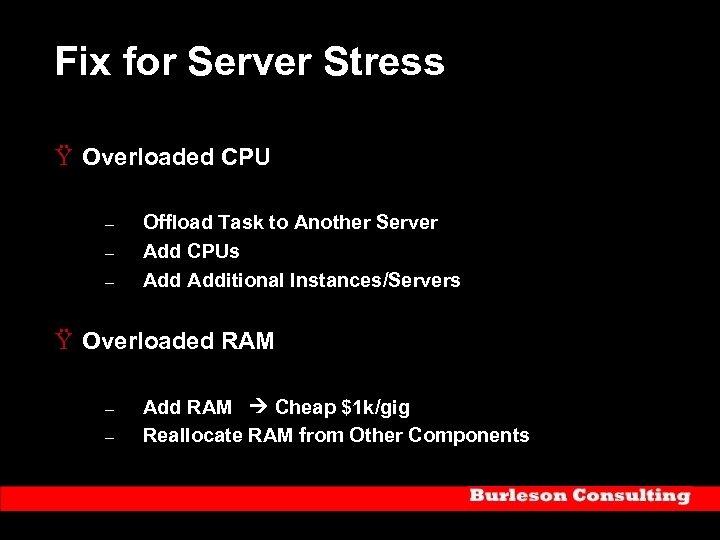 Fix for Server Stress Ÿ Overloaded CPU – – – Offload Task to Another Server Add CPUs Additional Instances/Servers Ÿ Overloaded RAM – – Add RAM Cheap $1 k/gig Reallocate RAM from Other Components
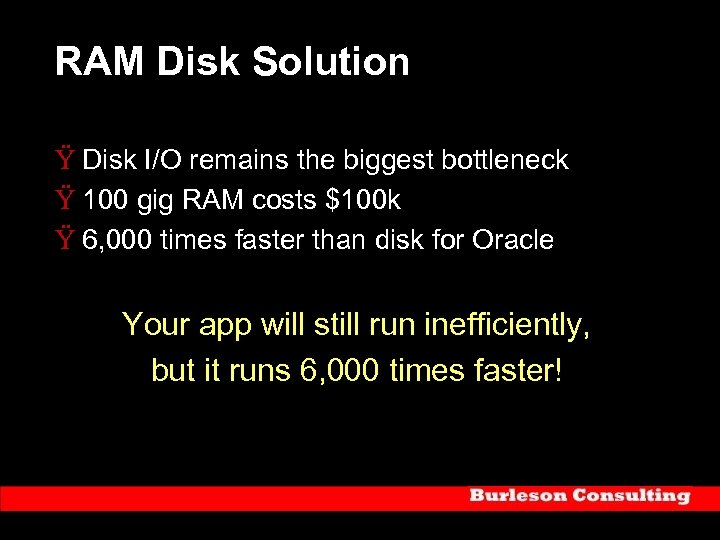 RAM Disk Solution Ÿ Disk I/O remains the biggest bottleneck Ÿ 100 gig RAM costs $100 k Ÿ 6, 000 times faster than disk for Oracle Your app will still run inefficiently, but it runs 6, 000 times faster!
 UNIX server Monitoring rules: Ÿ The UNIX vmstat utility provides a wealth of information about the ongoing performance of the Oracle 9 i. AS server. Ÿ The vmstat run queue value (r) can indicate a CPU shortage whenever the run queue exceeds the number of CUs on the server. Ÿ The vmstat page in values (pi) can indicate a RAM memory shortage. Ÿ You can easily define vmstat extension table to hold historical server information and use a UNIX shell script to periodically collect server performance information. Ÿ The UNIX server information can be used to generate alert reports and long-term trend reports.
 Details on Oracle server Monitoring: Oracle 9 i UNIX Administration Handbook By Don Burleson Ÿ In the OW bookstore!
 Oracle. AS Case Study
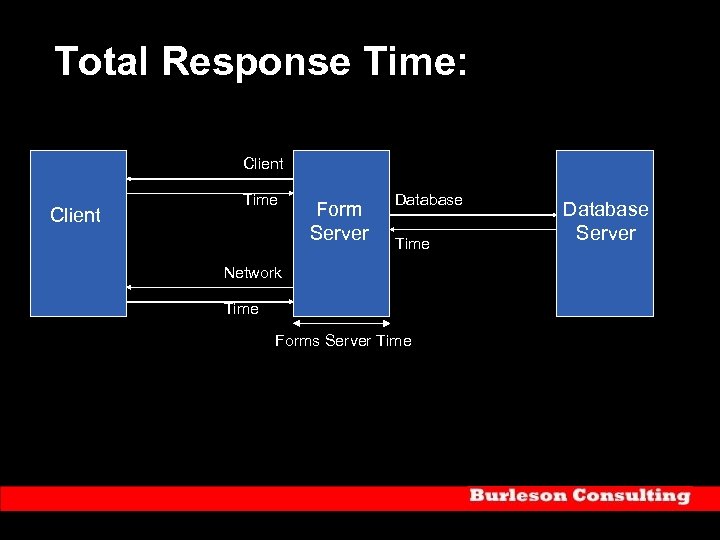
 Response-time monitoring example with Forms Server: Ÿ Database Time Ÿ Forms Server Time Ÿ Network Time Ÿ Client Time
 Total Response Time: Client Time Form Server Database Time Network Time Forms Server Time Database Server
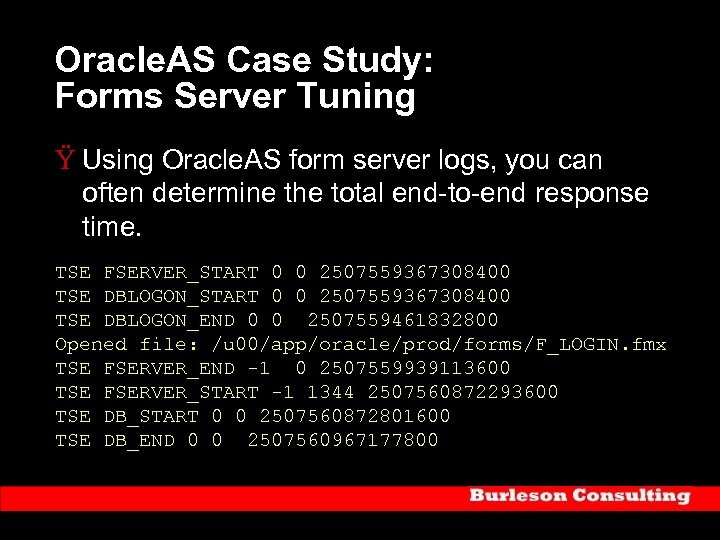 Oracle. AS Case Study: Forms Server Tuning Ÿ Using Oracle. AS form server logs, you can often determine the total end-to-end response time. TSE FSERVER_START 0 0 2507559367308400 TSE DBLOGON_END 0 0 2507559461832800 Opened file: /u 00/app/oracle/prod/forms/F_LOGIN. fmx TSE FSERVER_END -1 0 2507559939113600 TSE FSERVER_START -1 1344 2507560872293600 TSE DB_START 0 0 2507560872801600 TSE DB_END 0 0 2507560967177800
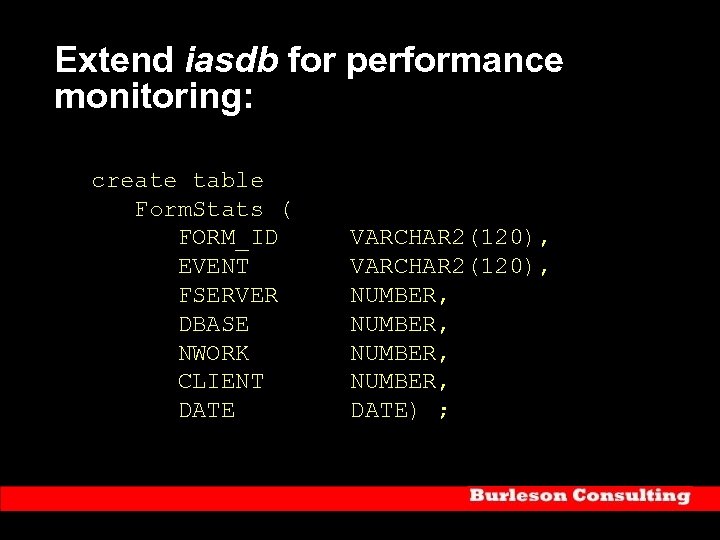 Extend iasdb for performance monitoring: create table Form. Stats ( FORM_ID VARCHAR 2(120), EVENT VARCHAR 2(120), FSERVER NUMBER, DBASE NUMBER, NWORK NUMBER, CLIENT NUMBER, DATE) ;
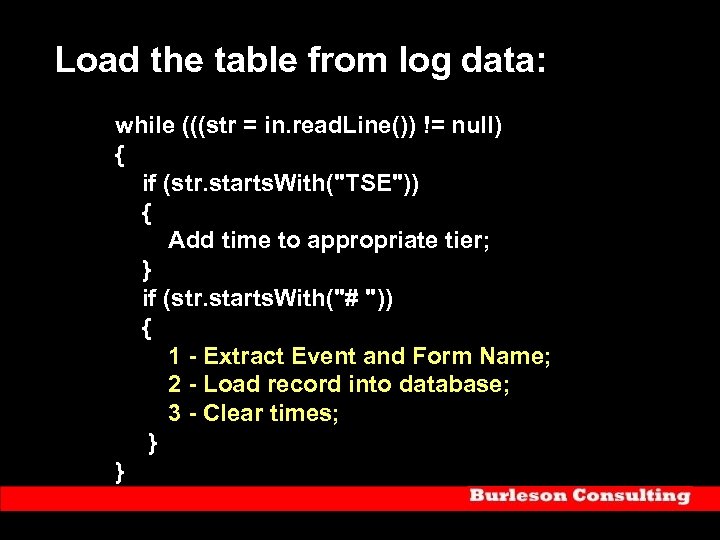 Load the table from log data: while (((str = in. read. Line()) != null) { if (str. starts. With("TSE")) { Add time to appropriate tier; } if (str. starts. With("# ")) { 1 - Extract Event and Form Name; 2 - Load record into database; 3 - Clear times; } }
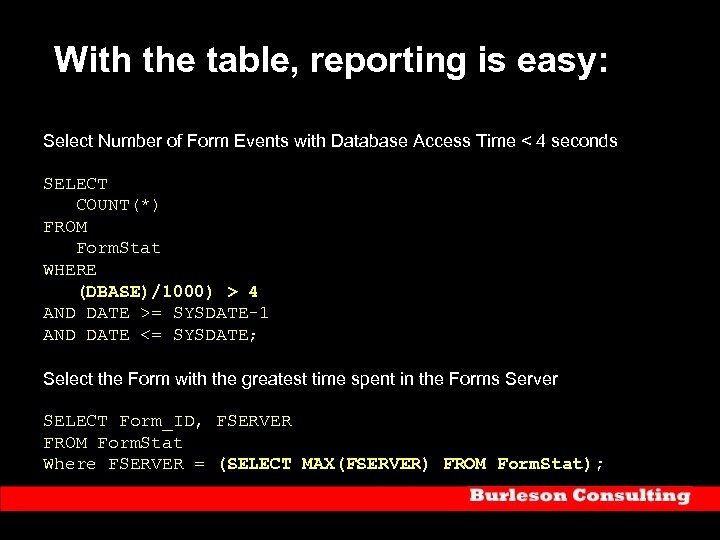 With the table, reporting is easy: Select Number of Form Events with Database Access Time < 4 seconds SELECT COUNT(*) FROM Form. Stat WHERE (DBASE)/1000) > 4 AND DATE >= SYSDATE-1 AND DATE <= SYSDATE; Select the Form with the greatest time spent in the Forms Server SELECT Form_ID, FSERVER FROM Form. Stat Where FSERVER = (SELECT MAX(FSERVER) FROM Form. Stat);
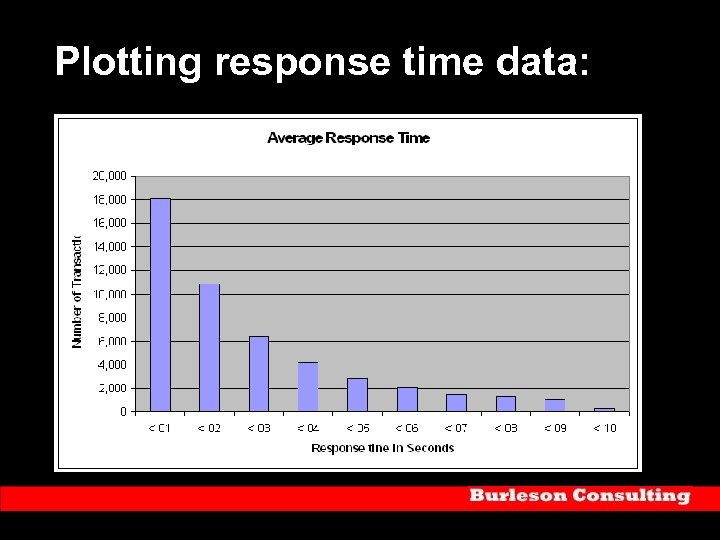 Plotting response time data:
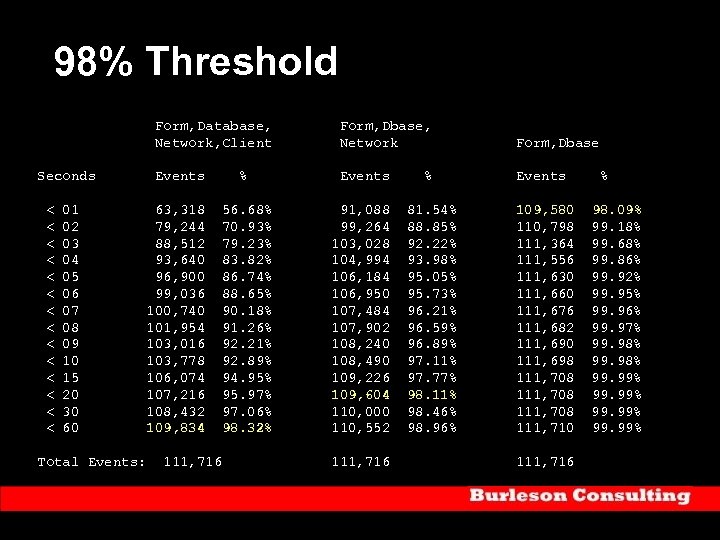 98% Threshold Form, Database, Form, Dbase, Network, Client Network Form, Dbase Seconds Events % < 01 63, 318 56. 68% 91, 088 81. 54% 109, 580 98. 09% < 02 79, 244 70. 93% 99, 264 88. 85% 110, 798 99. 18% < 03 88, 512 79. 23% 103, 028 92. 22% 111, 364 99. 68% < 04 93, 640 83. 82% 104, 994 93. 98% 111, 556 99. 86% < 05 96, 900 86. 74% 106, 184 95. 05% 111, 630 99. 92% < 06 99, 036 88. 65% 106, 950 95. 73% 111, 660 99. 95% < 07 100, 740 90. 18% 107, 484 96. 21% 111, 676 99. 96% < 08 101, 954 91. 26% 107, 902 96. 59% 111, 682 99. 97% < 09 103, 016 92. 21% 108, 240 96. 89% 111, 690 99. 98% < 10 103, 778 92. 89% 108, 490 97. 11% 111, 698 99. 98% < 15 106, 074 94. 95% 109, 226 97. 77% 111, 708 99. 99% < 20 107, 216 95. 97% 109, 604 98. 11% 111, 708 99. 99% < 30 108, 432 97. 06% 110, 000 98. 46% 111, 708 99. 99% < 60 109, 834 98. 32% 110, 552 98. 96% 111, 710 99. 99% Total Events: 111, 716
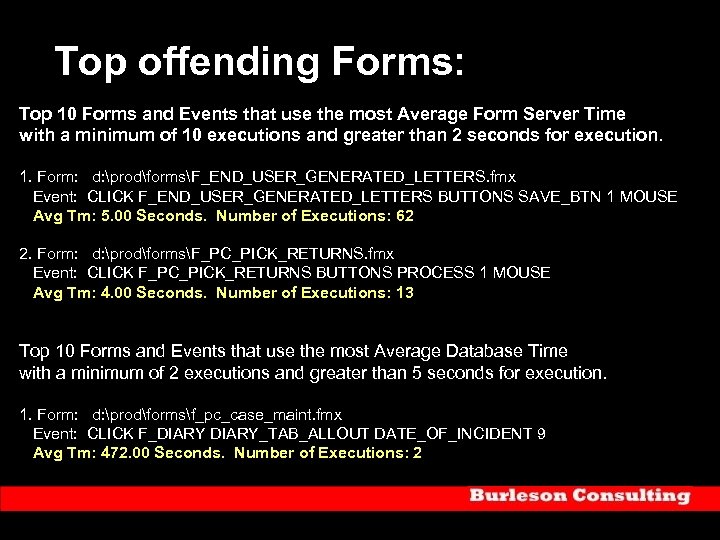 Top offending Forms: Top 10 Forms and Events that use the most Average Form Server Time with a minimum of 10 executions and greater than 2 seconds for execution. 1. Form: d: prodformsF_END_USER_GENERATED_LETTERS. fmx Event: CLICK F_END_USER_GENERATED_LETTERS BUTTONS SAVE_BTN 1 MOUSE Avg Tm: 5. 00 Seconds. Number of Executions: 62 2. Form: d: prodformsF_PC_PICK_RETURNS. fmx Event: CLICK F_PC_PICK_RETURNS BUTTONS PROCESS 1 MOUSE Avg Tm: 4. 00 Seconds. Number of Executions: 13 Top 10 Forms and Events that use the most Average Database Time with a minimum of 2 executions and greater than 5 seconds for execution. 1. Form: d: prodformsf_pc_case_maint. fmx Event: CLICK F_DIARY_TAB_ALLOUT DATE_OF_INCIDENT 9 Avg Tm: 472. 00 Seconds. Number of Executions: 2
 Conclusions Ÿ Develop a proactive, time-based performance data collection scheme. Real-time OEM and Aggrespy metrics are of little use. Ÿ Optimize by adjusting RAM resources parameters. Ÿ Once the system is optimized, server monitoring is critical Ÿ Server Load Balancing is Critical to properly scale Oracle 9 i. AS
 Current Books by Don Burleson My web site: dba-oracle. com E-mail me at : don@burleson. cc


