

4ad66192218605a535305d73ceedcfbf.ppt
- Количество слайдов: 37
 Present status of the 37 Ar neutrino SAGE source experiment
 PHYSICAL REVIEW C VOLUME 38, NUMBER 5 NOVEMBER 1988 37 Ar as a calibration source for solar neutrino detectors W. Haxton Institute for Nuclear Theory, Department of Physics, FM-15, University of Washington, Seattle Washington 98195 (Received 18 July 1988; revised manuscript received 12 September 1988) I discuss the possibility that a high-intensity 811 -ke. V 37 Ar neutrino source, produced by neutron capture on separated 36 Ar , could be used to calibrate the 7 Be solar neutrino capture cross sections of 71 Ga, 127 I, and other detectors
 The advantages of a 37 Ar source compared to a 51 Cr source 1. A major advantage is that the desired active isotope must be chemically separated from the target following irradiation. Thus a 37 Ar source, in contrast to a 51 Cr source can be made practically free of radioactive impurities. 2. A 37 Ar compared to 51 Cr have the half-life longer (35 d compared to 27 d). 3. The neutrino energy is greater (811 ke. V compared to 747 ke. V), thus giving a higher cross section. 4. The decay is purely to the ground state (100% compared to 90%), thus giving a mono-energetic neutrino source, and that there are no accompanying gamma rays (except for inner bremsstrahlung), thus requiring little shielding and yielding a very compact source. Decay modes of 37 Ar and the energy released
 Haxton’ proposal immediately attracted our attention and we considered in detail a practical method to make an intense 37 Ar source by the (n, α) capture reaction on 40 Ca at a reactor with a high flux of fast neutrons.
 J. N. Abdurashitov, V. N. Gavrin, S. V. Girin, V. V. Gorbachev, P. P. Gurkina, T. V. Ibragimova, A. V. Kalikhov, N. G. Khairnasov, T. V. Knodel, V. A. Matveev, I. N. Mirmov, A. A. Shikhin, E. P. Veretenkin, V. M. Vermul, V. E. Yants, and G. T. Zatsepin Institute for Nuclear Research of the Russian Academy of Sciences, Moscow 117312, Russia T. J. Bowles, S. R. Elliott, and W. A. Teasdale Los Alamos National Laboratory, Los Alamos, NM 87545 USA J. S. Nico National Institute of Standards and Technology, Gaithersburg, MD 20899 USA B. T. Cleveland, W. C. Haxton, and J. E Wilkerson Department of Physics, University of Washington, Seattle, WA 98195 USA A. Suzuki Research Center for Neutrino Science, Tohoku University, Aramaki, Aoba, Sendai, Japan K. Lande Department of Physics and Astronomy, University of Pennsylvania, Philadelphia, PA 19104 USA Yu. S. Khomyakov, V. M. Poplavsky, and V. V. Popov Institute of Physics and Power Engineering, Obninsk 249020, Kaluga region, Russia O. V. Mishin, A. N. Petrov, B. A. Vasiliev, and S. A. Voronov ОКБ Mechanical Engineering, Nizhny Novgorod 603074, Russia A. I. Karpenko, V. V. Maltsev, N. N. Oshkanov, and A. M. Tuchkov Beloyarsk Nuclear Power Plant, Zarechny 624250, Sverdlovsk region, Russia V. I. Barsanov, A. A. Janelidze, A. V. Korenkova, N. A. Kotelnikov, S. Yu. Markov, V. V. Selin, Z. N. Shakirov, A. A. Zamyatina, and S. B. Zlokazov Institute of Nuclear Materials, Zarechny 624250, Sverdlovsk region, Russia Project: “Calibration and testing of the technology for the preparation of an intense neutrino source based on 37 Ar isotope as well as for the calibration of gallium detector of solar neutrinos”
 Source production Beloyarsk Nuclear Power Plant BN-600 Fast Neutron Reactor The source was made by irradiating calcium oxide in the fast neutron breeder reactor BN-600 at Zarechny, Russia.
 37 Ar production cross-section The total fast flux at this reactor is 2. 3 · 1015 neutrons/(cm 2 · s), of which 1, 7 · 1014 neutrons/(cm 2 · s) have energy above the 2 Me. V threshold of the production reaction 40 Ca (n, α) 37 Ar.
 Map of BN-600 Reactor Nineteen irradiation assemblies, each of which contained 17. 3 kg of Ca. O (12. 36 kg Ca), were placed in the blanket zone of the reactor. Irradiation began on 31 October 2003 and continued until 12 April 2004, the normal reactor operating cycle. After a cooling period of a week, the assemblies were removed from the reactor and moved to a hot cell of BNPP where ampoules with irradiated target were taken out from assemblies and moved to extraction facility of the Institute of Nuclear Materials, where each ampoule was cut open in a vacuum system and the Ca. O dissolved in nitric acid.
 37 Ar was extracted from acid solution by a He purge and then stored on charcoal at LN 2 temperature. When the extractions from all the assemblies had been completed, the 37 Ar was purified by flowing over zeolite at room temperature, followed by two Ti absorbers, operating at 400 -450°C and 900 -950°C. The purified 37 Ar, whose volume was ~ 2. 5 l, was then adsorbed on another charcoal trap and measurements of gas volume and isotopic composition were made.
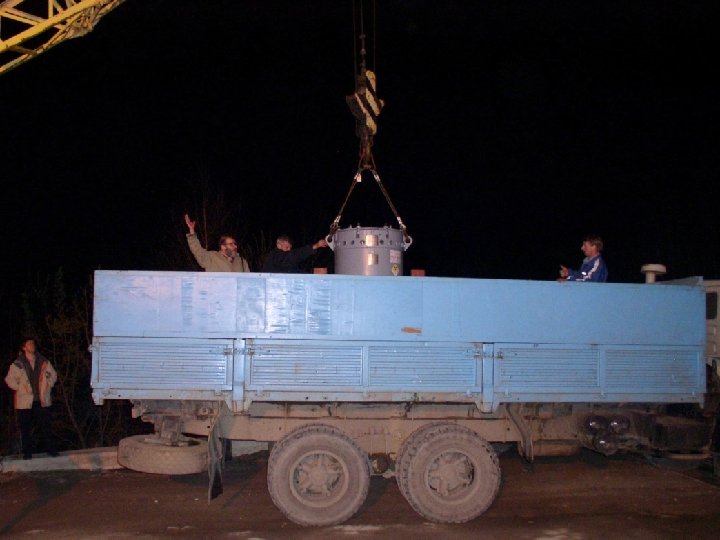
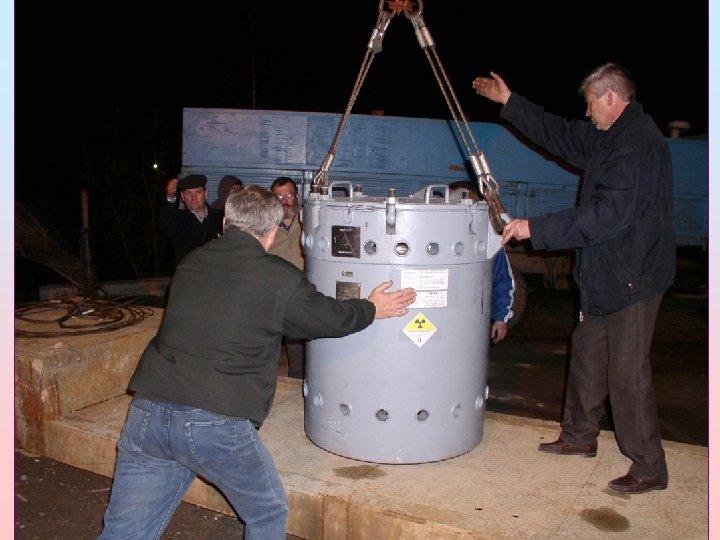
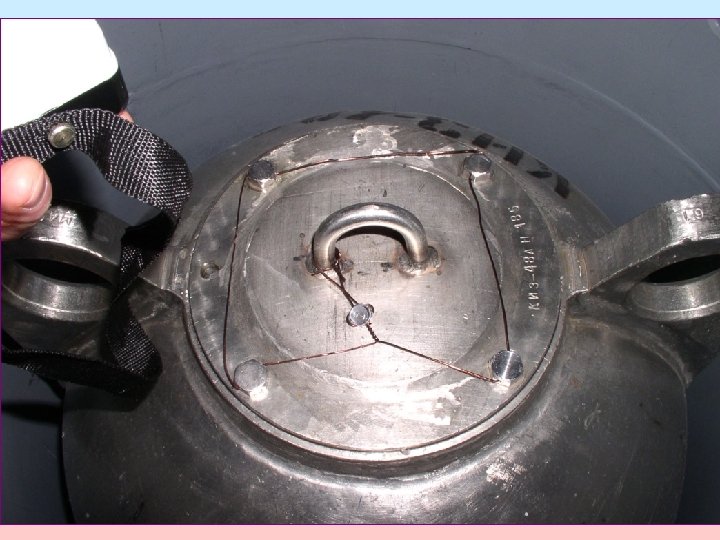
 As the last steps of source fabrication, the purified Ar was transferred to a pre-weighed source holder, which consisted of a stainless steel vessel with a volume of ~180 ml. Inside this vessel was 40 g of activated charcoal onto which the purified 37 Ar was cryopumped. When essentially all the 37 Ar had been adsorbed, the vessel was closed by compressing three separate knife-edge seals, two onto copper gaskets and one onto a lead gasket. The source holder was then weighed to determine the amount of 37 Ar contained within. To complete the source, the source holder was placed within two concentric stainless steel vessels with a Pb shield between them. These two vessels were welded shut and the heat output of the finished source was measured with a calorimeter. These procedures were completed on 29 April and the source was immediately flown by chartered plane to the Mineral Water airport, close to the experimental facility at the Baksan Neutrino Observatory in the northern Caucasus mountains.
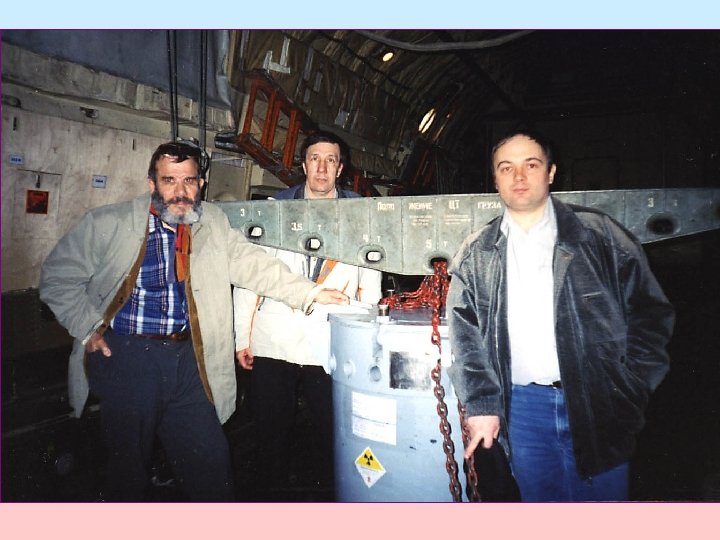
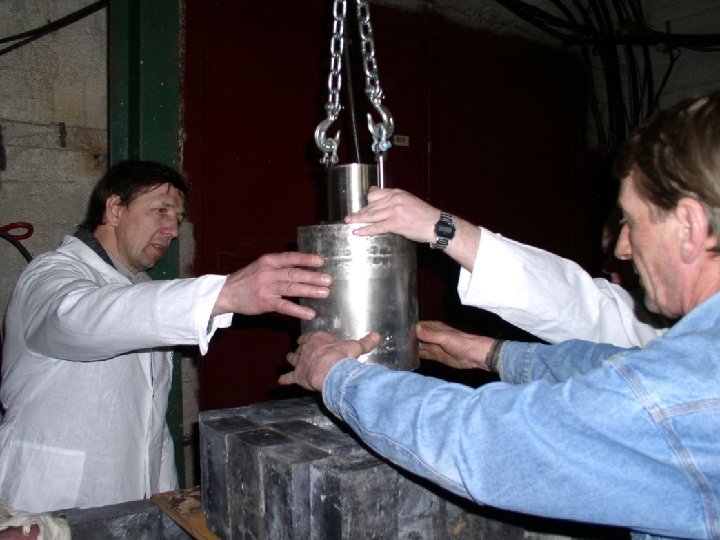
 with") S. Zlokazov, V. Gavrin, A. Korenkova, Z. Shakirov, V. Barsanov (left to right) with 37 Ar source before its delivery from the IRM
S. Zlokazov, V. Gavrin, A. Korenkova, Z. Shakirov, V. Barsanov (left to right) with 37 Ar source before its delivery from the IRM
 A plan view of the reactors layout in the laboratory
 Measured production rate Ten extractions were made. Exactly the same procedures were used to extract 71 Ge, to measure efficiency of extraction, to select candidates 71 Ge events as we use for solar neutrino runs. The times of occurrence of the candidate 71 Ge events were analyzed with our standard maximum-likelihood program (Cleveland, 83) to separate the 71 Ge 11. 4 -d decay events from a constant rate background. This is the same program that we used to analyze the runs with the 51 Cr source and use to analyze all solar neutrino data.
 Results of analysis of L- and K-peak events. All production rates are referred to the time of the start of the first exposure. The parameter Nw 2 measures the goodness of fit of the sequence of event times. The probability was inferred from Nw 2 by simulation. For all runs combined the best fit rate is 11. 0 +1. 0/-0. 9 atoms of 71 Ge produced by the source at the reference time. The uncertainty is purely statistical and is given with 68% confidence.
 Upper panel: energy vs rise-time histogram of all events after time cuts observed in all ten exposures during the first 30 days after extraction. The live time is 263. 1 days and 443 events are shown. The expected location of the 71 Ge L and К peaks based on the 55 Fe calibrations is shown darkened. Lower panel: the same histogram for the 227 events that occurred during an equal live-time interval beginning at day 100 after extraction. The 71 Ge has decayed away and is absent. The number of events outside the peaks is about the same in both panels as these are mainly due to background.
 Summary of the contributions to the systematic uncertainty in the measured neutrino capture rate. The quadratic combination of all these systematic uncertainties is +5. 2/-5. 4%. The measured production rate in the K and L peaks, including both statistical and systematic errors, is thus pmeasured = 11. 0 +1. 0/-0. 9 (stat) ± 0. 6 (syst)
 In the first method, carried") Measurement of source activity A. Measurements at Zarechny (1) In the first method, carried out after argon purification, and while the gas was being put into the source holder, the total volume of gas and its isotopic composition were measured. The composition was determined with a mass spectrometer. The difference in pressure between before filling the source holder and after filling implied the volume of gas in the holder was 2. 665± 0. 048 l at STP. Combining this with the isotopic composition and correcting for decay between the time of volume measurement and the reference time gives a source activity of 409± 6 k. Ci at 04: 00 on 30 April 2004. The stated uncertainty has 68% confidence and includes all known systematics. Gas content of the 37 Ar source 47. 5 h prior to the reference time in percent by volume. The uncertainty shown is statistical; there additional systematic components whose sum is no more than 0. 8%. 37 Ar 38 Ar 39 Ar 40 Ar H 2 0. 26 ± 0. 07 96. 57 ± 0. 13 1. 87 ± 0. 06 0. 35 ± 0. 03 0. 95 ± 0. 03 (2) In the second method, the source holder was evacuated and weighed before filling and then weighed again after filling with the extracted gas sample. The difference in mass was 4. 400± 0. 042 g at the time of filling (06: 25 on 28 April), from which the activity is calculated to be 412± 4 k. Ci at the reference time.
Measurement of source activity A. Measurements at Zarechny (1) In the first method, carried out after argon purification, and while the gas was being put into the source holder, the total volume of gas and its isotopic composition were measured. The composition was determined with a mass spectrometer. The difference in pressure between before filling the source holder and after filling implied the volume of gas in the holder was 2. 665± 0. 048 l at STP. Combining this with the isotopic composition and correcting for decay between the time of volume measurement and the reference time gives a source activity of 409± 6 k. Ci at 04: 00 on 30 April 2004. The stated uncertainty has 68% confidence and includes all known systematics. Gas content of the 37 Ar source 47. 5 h prior to the reference time in percent by volume. The uncertainty shown is statistical; there additional systematic components whose sum is no more than 0. 8%. 37 Ar 38 Ar 39 Ar 40 Ar H 2 0. 26 ± 0. 07 96. 57 ± 0. 13 1. 87 ± 0. 06 0. 35 ± 0. 03 0. 95 ± 0. 03 (2) In the second method, the source holder was evacuated and weighed before filling and then weighed again after filling with the extracted gas sample. The difference in mass was 4. 400± 0. 042 g at the time of filling (06: 25 on 28 April), from which the activity is calculated to be 412± 4 k. Ci at the reference time.
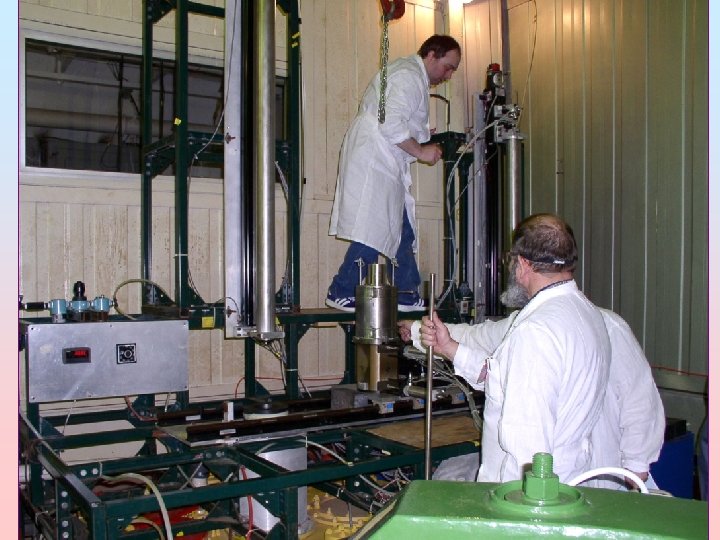
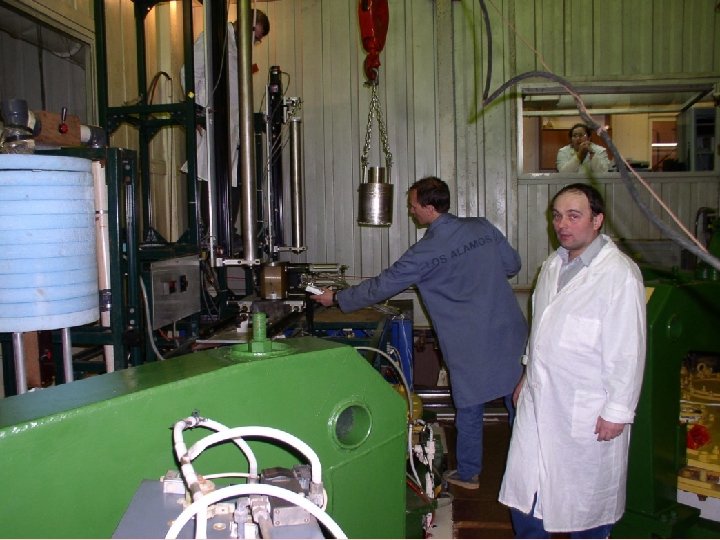
 In the third method, the heat output of the") A. Measurements at Zarechny (3) In the third method, the heat output of the source was measured in a massive calorimeter specially built for this purpose. The calorimeter was calibrated using electrical heaters of known power and thermocouple EMF over the range of (6 -8) W (the expected source power) was found to have the constant value 0. 1019± 0. 0002 W/m. V. Stabilization of the calorimeter with the source required only 3 h and the measured thermocouple EMF was 65. 9 m. V at 22: 00 on 28 April 2004. Applying a decay factor of 0. 9740 gives a power of 6. 54± 0. 04 W at our reference time. Using the conversion factor gives the source activity at this time as 405± 4 k. Ci. The error estimate includes the calibration uncertainty, the errors in the calorimeter measuring circuits, and the uncertainties in both decay energy and 37 Ar half-life. Summary of measurements at Zarechny Measurement method Volume of gas Mass of gas Calorimetry Activity (k. Ci 37 Ar at 04: 00 on 30 April 2004) 409 ± 6 412 ± 4 405 ± 4 The weighted average value is 409 ± 3 k. Ci
A. Measurements at Zarechny (3) In the third method, the heat output of the source was measured in a massive calorimeter specially built for this purpose. The calorimeter was calibrated using electrical heaters of known power and thermocouple EMF over the range of (6 -8) W (the expected source power) was found to have the constant value 0. 1019± 0. 0002 W/m. V. Stabilization of the calorimeter with the source required only 3 h and the measured thermocouple EMF was 65. 9 m. V at 22: 00 on 28 April 2004. Applying a decay factor of 0. 9740 gives a power of 6. 54± 0. 04 W at our reference time. Using the conversion factor gives the source activity at this time as 405± 4 k. Ci. The error estimate includes the calibration uncertainty, the errors in the calorimeter measuring circuits, and the uncertainties in both decay energy and 37 Ar half-life. Summary of measurements at Zarechny Measurement method Volume of gas Mass of gas Calorimetry Activity (k. Ci 37 Ar at 04: 00 on 30 April 2004) 409 ± 6 412 ± 4 405 ± 4 The weighted average value is 409 ± 3 k. Ci
 B. Calorimetric measurement at Baksan Calibration curve of the calorimeter at Baksan. The solid curve is a weighted least-squares fit to a 2 nd-degree polynomial. p(v) = a+bv+cv 2 gives a = 0. 022± 0. 011 W, b = 0. 1409 ± 0. 0022 W/m. V, and c = 0. 00028 ± 0. 00007 W/m. V 2. The uncertainties were used as weight factors in this fit and χ2 is 19. 5 with 26 degrees of freedom (probability = 81%).
 0 20 40 60 80") Time since 04: 00 on 30 April 2004 (d) 0 20 40 60 80 100 120 140 If a weighted fit is made to this data with a decaying exponential whose halflife is fixed at 35. 04 d (the half-life of 37 Ar), then the power at the reference time is 6. 907± 0. 013 W. χ2 for this fit is 11. 2 with 10 degrees of freedom (probability = 34%). As a check, the same fit was made allowing the decay constant to be a free variable, along with the power at the reference time. The resultant best fit half-life is 34. 80± 0. 20 d, in agreement with the known value. χ2/DOF = 9. 8/9 for this fit.
Time since 04: 00 on 30 April 2004 (d) 0 20 40 60 80 100 120 140 If a weighted fit is made to this data with a decaying exponential whose halflife is fixed at 35. 04 d (the half-life of 37 Ar), then the power at the reference time is 6. 907± 0. 013 W. χ2 for this fit is 11. 2 with 10 degrees of freedom (probability = 34%). As a check, the same fit was made allowing the decay constant to be a free variable, along with the power at the reference time. The resultant best fit half-life is 34. 80± 0. 20 d, in agreement with the known value. χ2/DOF = 9. 8/9 for this fit.
 Using the energy release and the conversion factors and 3. 7 · 1010 decays of 37 Ar/(Ci · s), the inferred source activity at the reference time was 426. 9± 0. 8 k. Ci. The quoted uncertainty here of 0. 2% is solely from the measurement errors. There are several additional systematic uncertainties that must be included in a full error estimate. - the differences in thermal properties between the source and the calibration heaters; - in the energy release; - incomplete absorption of the IB component of energy release; - in the 37 Ar half-life; - in the capture of some of the gamma rays from the source in the other part of the calorimeter ____________________ We assign a total error of ~ +/- 2% or +/- 9 k. Ci The final result of calorimetric measurements at Baksan is 426. 9± 9
 C. Measurement by 37 Ar counting The 37 Ar source was returned to the fabrication facility in December 2004. The source holder was cut open in a vacuum system, the entire gas sample was removed, and samples of the gas were taken for activity measurement in proportional counters. At this time the 37 Ar had decayed by a factor of 300. Because the specific activity was still very high, it was necessary to make several volume divisions to reduce the count rate to a value that was measurable in a proportional counter.
 Four samples were taken in two proportional counters using different methods of volume division. Assuming an 37 Ar half life of 35. 04 d, the inferred source strength at the reference time is 383. 3 ± 4. 3 k. Ci where the uncertainty includes all known systematic effects except for the half-life. Since the time delay from the reference time to the time of these measurements was 288 d, this result is rather sensitive to the value of the half-life that is used in the decay correction. The 37 Ar half-life uncertainty in the most recent data compilation for this nuclear mass is given as ± 0. 04 d, which leads to an additional uncertainty in the source strength of ± 0. 6%.
 D. Measurements in progress Another sample will have the 37 Ar content determined by the method of isotopic dilution. E. Summary of source strength measurements Summary of different activity measurements. The stated uncertainty includes all known systematics. Measurement Activity (k. Ci 37 Ar at method 04: 00 on 30 April 2004) ________________________________ Volume of gas 409 ± 6 Mass of gas 412 ± 4 Calorimetry at Zarechny 405 ± 4 Calorimetry at Baksan 427 ± 9 Proportional counter 383 ± 4 The five completed activity measurements are given in the Table. The three Zarechny measurements agree quite well, but the Baksan calorimetric measurement is distinctly higher and the proportional counter measurement is distinctly lower. The large spread among these measurements must be due to presently undetermined systematic effects; further work is underway to attempt to understand the causes of this disagreement. Until this disagreement is resolved, the weighted average value of the Zarechny measurements, 409 ± 3 k. Ci, will be used. k. Ci
 Predicted production rate Values and uncertainties of the terms that enter the calculation of the predicted production rate. All uncertainties are symmetric except for the cross section. Assuming a source activity of 409± 3 k. Ci, and combining the uncertainty terms in quadrature, the predicted production rate is thus ppredicted = 14. 0 +1. 0/ -0. 4 atoms of 71 Ge produced per day.
 Upper panel: comparison of measured total production rate for each extraction with predicted rate. Lower panel: measured rates from the 37 Ar source extrapolated back to the start of the first extraction. The combined results for events in the L- and К- peaks and for all events are shown separately at the right and compared to the predicted rate.
 Comparison of source experiments with Ga. Values for the 37 Ar source marked with a dagger (t) are preliminary. When two uncertainties are given, the first is statistical and the second is systematic. When one uncertainty is given, statistical and systematic uncertainties have been combined in quadrature.
 and") Acknowledgments We wish to thank Alexander Rumyantsev (Federal Agency of Atomic Energy, Russia) and Valery Rubakov (Institute for Nuclear Research RAS, Russia) for their vigorous and continuous support for the 37 Ar project. This work was partially funded by grants from the USA, Japan, and Russia and carried out under the auspices of the International Science and Technology Center (Project No. 1431).
Acknowledgments We wish to thank Alexander Rumyantsev (Federal Agency of Atomic Energy, Russia) and Valery Rubakov (Institute for Nuclear Research RAS, Russia) for their vigorous and continuous support for the 37 Ar project. This work was partially funded by grants from the USA, Japan, and Russia and carried out under the auspices of the International Science and Technology Center (Project No. 1431).