9156f1eb65ba45789871d60c290ade8b.ppt
- Количество слайдов: 128

Preparatory works for the register-based census Eric Schulte Nordholt Statistics Netherlands Division Socio-economic and spatial statistics e. schultenordholt@cbs. nl Consultation presentations in Tallinn (25 August 2014)

Contents General • Introduction and big data • The role of statistical registers • Combing registers and sample survey data • Workflow of a register-based census • Quality of registers • Effects on demographic and social statistics • Cleansing, processing and data quality revisited • Communications aspects • Register-based statistics on earnings 2

Contents Introduction and big data • Introduction to Statistics Netherlands • Statistics Netherlands: facts and figures • Institutional organisation • Act of 3 January 2004 • Organisational chart per 1 January 2012 • Examples of registers • Innovation programme • Innovation in statistics • Heatmaps • Modernisation in an international context 3

Introduction to Statistics Netherlands (1) The Central Statistical Office (CBS) • about 95% of all official statistics in the Netherlands • no regional offices • two buildings: The Hague (in the West) 4

Introduction to Statistics Netherlands (2) and Heerlen (in the South); both have about 1000 employees Mission The mission of Statistics Netherlands is to publish reliable and coherent statistical information that meets the needs of society. Position of the Statistical Office Statistics Netherlands is since 2004 a semi-independent organisation (still government funding) with about 2000 employees 5

Statistics Netherlands: facts and figures Statistics Netherlands (CBS): established in 1899 • Responsible for methodology and dissemination • Responsible for EU statistics in NL – only statistical authority Annual budget 2013: € 199 mln. • 90% financed by central government • 10% income commissioned work Staff (31. 12. 2013): 2067 persons (1835 fte) • Average age: 50. 5 years • Men - women: 61. 7% - 38. 3% • Staff with higher qualifications: 73. 5% 6

Institutional organisation Minister of Economic Affairs: system responsibility; legislation and budget (we are strictly independent from but funded by central government) CCS: responsible for national statistical programme; supervisory board of CBS Director-general CBS: responsible for methodology, dissemination and the management of CBS EU: EU legislation and EU programme; important influence on the national progamme → Centralized system, CBS only statistical authority 7

Act of 3 January 2004 Autonomous Agency with legal personality Getting the data • • Free access to (government) administrative sources Obligation to use administrative data Business are compelled to reply to our surveys Administrative fines Confidentiality • Strict guarantee of confidentiality for data subject • Access to confidential data for scientific research 8

Organisational chart per 1 January 2012 DG Methods and statistical policy Policy staff Data collection Economy, businesses and national accounts Socio-economic and spatial statistics Statistics Netherlands Finance & control, HRM and communication Process development, IT and methodology 9

Examples of registers Three kinds of registers • Population Register (PR) • Job register • Self-employed register • Education register • Occupation register • Income register • Social security register • Unemployment register • Pension register • Other registers on persons, families and households • Housing register • Other registers on properties, buildings and dwellings • General business register • Other registers on enterprises and establishments Common identifier: (numerical) address 10

Innovation programme 75 ideas via Po. C to implementation Innovation lab Funnel approach 11

Innovation in statistics Internet robots Social media Traffic loops Smartphones 12

Heatmaps Salary level -> Graphical presentation of large data gives new insights Tested on salary data Example: salary by age and sex Age -> 13

Modernisation in an international context (1) Big Data project with UNECE and EU – Netherlands leads WP 1 result: paper on usability of big data in official statistics Research at Statistics Netherlands into social media and telephone data delivers promising results 14

Modernisation in an international context (2) UNECE CSPA project (Common Statistical Production Architecture) – The Netherlands participates in Architecture Working Group Internal programme to implement CSPA – – Two services (Business Register Sample, Data editing) Runtime environment (simple, not complicated) Architecture/Modelling support GSIM and GSBPM implementation (gradual) 15

Contents The role of statistical registers • What is a register? • Updating • Administrative registers • Statistical registers • Base registers • Main statistical base registers in register-based countries • Specialised registers 16

What is a register? Definition of register • Systematic collection of unit level data organized in such a way that • updating is possible Units • Units must be uniquely identified – Preferably by identification codes • Example: Resident persons in a country – Identified according to rules of Central Population Register • Units = objects 17

Updating Processing unit level information to keep track of changes in units and their attributes • New units (new born, immigrants) added • Exiting units (dead, emigrants) “removed” – Classified as “not active” • Changes in attributes • Corrections • Updating only for units that had changes • Updating when changes arise (“continuously”) • A traditional census file is not a register: all data are collected at unit level for a point in time or a period – New data collected for next census – Not updated as a register 18

Administrative registers • Primarily used in administrative information systems • Used in production of goods or services in public or private sector • Used for decisions on individuals (persons, buildings, enterprises) • Administrative registers used for statistics – Often countrywide registers in public sector – Operated by the state or by local authorities Administrative data sources • All kinds of data sources used for administrative purposes • Nowadays normally registers Register owner • Authority responsible for an administrative register = Register keeper 19

Statistical registers Created by processing data from administrative registers for statistical purposes – Could be based on one single register – Normally based on combined data from several registers Primary register – Administrative register or – Statistical register where no central administrative register exists • Register of education Secondary register – Other statistical registers 20

Base registers Opposite: specialised register Administrative base registers • Basic, common resource for public administration • Keeping stock of the population • Maintain identification information Statistical base registers • Based on the corresponding administrative base register/registers • Great importance for the whole statistical system 21

Main statistical base registers in register-based countries Population register: (C)PR ID: Personal identification number Business register ID: Business identification numbers (for enterprises and establishments) Property register Real estates, buildings, dwellings and addresses ID for linking to persons and establishments: numerical address 22

Specialised registers (1) Specialised registers are • serving one specific purpose – or a clearly defined group of purposes • containing data for defined subject areas • linked to one (or more) basic register(s) – a car may be owned by a person or by a company • receiving information on population and some basic data from base register(s) 23

Specialised registers (2) Examples • Registers on persons – Tax – Educational attainment – Social security – Health • Business registers – Business tax – Value added tax – Trade • Registers on sub-populations – Farms, hospitals, schools 24

Contents Combining registers and sample survey data • Census tables • Micro macro method 25

Census tables (1) Preliminary work before tabulating Census Programme definitions: not always clear and unambiguous, e. g. economic activity Priority rules • (characteristics of) main job (highest wage) • employee or employer • job or (partially) unemployed • job or attending education • job or retired • engaged in family duties or retired • age restrictions Tabulating register variables: Simply straightforward counting from SSD register data 26

Census tables (2) Tabulating survey (and register) variables Mass imputation? • Pro’s: reproducible results • Con’s: danger of oddities in estimates (e. g. highly educated baby) Traditional Weighting? • Pro’s: simple, reproducible results (if same microdata and weights) • Con’s: no overall numerical consistency between survey and register estimates Demand for overall numerical consistency • one figure for one phenomenon idea • all tables based on different sources (e. g. surveys) should be mutually consistent 27

Census tables (3) Ethnicity: register Education: survey 1 and survey 2 Employment status: survey 2 Estimate: T 1: educ x ethnic and T 2: educ x employ ethnic 1. . . k Register educ x ethnic not. NL NL Total educ. Lo 20 29 9 42 29 71 Survey 2 51 Total Survey 1 employ 1. . . m 49 educ. Hi educ. Lo. . . Hi 100 employ x educ ethnic Total not. NL 30 NL employed nonemployed Total educ. Lo 70 32 20 52 educ. Hi 28 20 48 Total 60 40 28 100

Census tables (4) Repeated Weighting (RW) : tool to achieve numerical consistency (VRD-software) Basic principles of RW: • estimate table on most reliable source (mostly source with most records, e. g. register) • estimate tables by calibrating on common margins of the current table and tables already estimated (auxiliary information) • repeatedly use of regression estimator: - initial weights (e. g. survey weights) calibrated as minimal as possible - lower variances - no excessive increase of (non-response) bias (as long as cell size>>0) • each table has its own set of weights 29

Census tables (5) Calibrate on ethnic, then on educ x ethnic 1. . . k educ. Lo. . . Hi Register Survey 1 employ 1. . . m 2 educ x ethnic not. NL NL Total educ. Lo 20 30 50 educ. Hi 10 40 50 Total 30 70 Survey 2 100 employ x educ Total not. NL 30 70 nonemployed 31 19 50 educ. Hi NL employed educ. Lo 1 ethnic 3 Total 30 20 50 Total 61 39 100 30

Micro macro method (1) Repeated Weighting works nicely, but in the 2011 Census a new requirement was introduced: hypercubes (= high dimensional tables) Problem: Very detailed tables contain many sample zeros that RW cannot handle Solution 1: estimate subhypercubes Solution 2: micro macro method (an IPF method) was introduced to estimate the interior of subhypercubes containing LFS variables 31

Micro macro method (2) Results of the micro macro method are published if two conditions are fullfilled: 1. table margins estimated with RW are small enough 2. number of records in estmated cells are large enough Criteria: 1. estimated relative inaccuracy of at most 20 percent (i. e. the estimated margins amount to 40 percent at most) which corresponds to a threshold of 25 persons 2. only table cells based on 5 or more persons are published 32

Workflow of a register-based census Volkstelling 2011 (\Ssb 1 fssb 10PROJECTENVT 2011) Overzicht projectdocumentatie \ssb 1 fssb 10PROJECTENVT 2011DocumEUROSTATVerordeningen • Verordeningen: Regulation (EC) No 763 2008 Verordening Volks- en Woningtellingen • Regulation (EC) No 1201 2009 Implementatieverordening • Regulation (EU) No 519 2010 Verordening hypercubes • Regulation (EU) No 1151 2010 Verordening kwaliteitsrapportage Extra informatie: Explanatory notes (incl. regulations) Guidelines voor quality hypercubes • KS-RA-11 -006 -EN • Metadata_guidelines_v 2. 0 • Uitwerkingen verordening: 20110524_Verordeningen vs facultatieve aspecten • 20140227_Hypercubes en bestanden • 20140303_Inventarisatie bronnen VT 2011 v 0. p 7 • 20131216_Uitwerking kwaliteitshypercubes \Ssb 1 fssb 10PROJECTENVT 2011DocumPLANNING_EN_ORGANISATIEWBP WBP-melding: Wbpvolkstelling 2011 20120710_JZEL_ESLE_GGB WBP-meldingsformulier Volkstelling 2011 • 20120710_JZEL_ESLE_PIA Volkstelling 2011 • • 33

Gehanteerde methode: VRD: \Ssb 1 fssb 10PROJECTENVT 2011DocumVRD-Handleiding • Bascula 4 Manual • Handleiding. VRD 1. 4 • VRD 1. 5 • Handleiding. Aanvulling. VRD 2. 0 Micro-macro methode: \Ssb 1 fssb 10PROJECTENVT 2011DocumSCHATTINGSMETHODEN Documentatie methoden • 20121204_micro macro methode Versie 3 (een micro-macro methode voor het schatten van de VT 2011) • 20130422_gebruikershandleiding • 20130528_Stappenplan_MET_VOORSTEL_TUSSENMARGINALEN • 20130418_Technische_Beschrijving • Gebruiksaanwijzingen - twee megacubes • Tweedimensionale vs. meerdimensionale onderbouw marginalen • Evaluatie micro macro methode_2 (verbeterde toepassing van de micro-macro methode) • review_micromacro (review code micromacromethode) • Nota lege cellen V 9 (het lege cellen probleem bij de volkstellingen) Weging EBB: \Ssb 1 fssb 10PROJECTENVT 2011DocumSCHATTINGSMETHODEN Documentatie methoden • Nota Weging EBB VT 2011_Nieuw (Weging EBB Variabelen voor VT 2011) Census hub: \Ssb 1 fssb 10PROJECTENVT 2011DocumSDMXCensus hub 20120716_Gebruikersinstructie Census data import tool 34

Totaal overzicht processen Stap 1: SSB-analysebestand Stap 2: Hercoderingen detailniveaus Woningen (register) Personen (EBB®ister) Stap 5: VRD-nabewerkingen Aanmaken metadatabase, tussenniveaus, samenvoegen zeldzame categorieën, geaggregeerd, met telveld, wegschrijven in blokken Schattingen in VRD & macro-integratieprogrammatuur, per (sub)hypercube Check op plausibiliteit en VRD-marges i. v. m. publicatiecriteria, wegwerken tussenniveaus Naamgeving variabelen en detailniveaus volgens DSD-richtlijnen Stap 4: VRD & macro-integratie Naamgeving variabelen en detailniveaus volgens DSD-richtlijnen Personen (register) Stap 3: VRD-proof maken

Stap 6: DSD-coderingen Woningen (5 register hypercubes) Stap 7: Populatiebestanden Naamgeving codes volgens DSD-richtlijnen 1) Woonverblijven 2) Conv. woningen 3) Bew. conv. woningen Stap 8: Hypercubes Stap 9: Tau-ARGUS Afzonderlijke hypercubes met benodigde variabelen geaggregeerd, met telveld Aanmaken alle Marginalen Afzonderlijke hypercubes met benodigde variabelen geaggregeerd, met telveld Aanmaken alle marginalen met benodigde variab. Personen (32 register hypercubes) Naamgeving codes volgens DSD-richtlijnen 1) Personen 2) Particuliere huish. 3) Gezinnen met benodigde variab. Personen (23 geschatte hypercubes) Naamgeving codes volgens DSD-richtlijnen Aanmaken alle marginalen en afronden

Stap 10: Samenvoegen sub-stukjes hypercubes Stap 11: Nabewerking Stap 12: Census hub In totaal 136. 013. 260 cellen Woningen (5 register hypercubes) 1) Verschillende 0’en definiëren/aanmaken Plaatsing in SDMX in Census hub Personen (32 register hypercubes) 1) Gevoelige categorieën samenvoegen 2) Verschillende 0’en definiëren/aanmaken Plaatsing in SDMX in Census hub Personen (23 geschatte hypercubes) Samenvoegen sub-stukken hypercubes en verwijderen overlap in marginalen 1) Lokaal onderdrukken o. b. v. VRD-marges 2) Gevoelige categorieën samenvoegen 3) Verschillende 0’en definiëren/aanmaken Plaatsing in SDMX in Census hub Aanvullend zijn 21 kwaliteitshypercubes samengesteld en in de Census hub geplaats

Werkzaamheden Opgeleverde (tussen) bestanden Bijbehorende documentatie 5 registerhypercubes Woningen Stap 1 t/m 7: \Ssb 2 fssb 26SATSETVT 20112010DATA (1: analysebestanden VT 2011; 7: populatiebestanden VT 2011) Stap 8: \Ssb 1 fssb 10PROJECTENVT 2011Hypercubes TellingenDATA Stap 9: \Ssb 1 fssb 10PROJECTENVT 2011Hypercubes MarginalenDATA (nabewerkingDATA) Stap 1 t/m 7: \Ssb 2 fssb 26SATSETVT 2011 (Controles: 2010DOCUMControles_analysebestanden) Stap 8 en 9: \Ssb 1 fssb 10PROJECTENVT 2011Hypercubes HOUSINGCENSUSANAV 1 (7. 570. 481 woningen; 18 -3 -2013) Proces: 20140128_Globaal analyseplan VT 2011 – SSB-variabelen 20140128_Globaal analyseplan VT 2011 – buiten SSB om 20130328_Overzicht variabelen & bronnen VT 2011 20130114_Volkstelling Constructie woonvariabelen 20140225_Werkzaamheden Samenstellen Analysebestanden VT 2011 Controles: 20130716_Controle HOUSINGCENSUSANAV 1 41(BCW), 53(CW), 54(BCW), 59(W), 60(CW) Analysebestand (stap 1) HOUSINGCENSUSWOONVERBLIJVENREGV 1 Hercoderingen detailniveaus (7. 030. 917 woonverblijven; 26 -4 -2013) (stap 2), HOUSINGCENSUSCONVENTIONELEWONINGENREGV 1 DSD-coderingen (7. 459. 694 conventionele woningen ; 26 -4 -2013) (stap 6), HOUSINGCENSUSBEWOONDECONVENTIONELEWONINGENREGV 1 Populatiebestanden (6. 939. 487 bewoonde conventionele woningen ; 26 -4 -2013) (stap 7) Proces, incl. controles: 20140501_Werkzaamheden Populatiebestanden VT 2011 (basis) Hypercubes (stap 8) HC 41 ZM (14. 249 records; 6 -5 -2013) HC 53 ZM (3. 591 records; 6 -5 -2013) HC 54 ZM (18. 723 records; 6 -5 -2013) HC 59 ZM (1. 619 records; 6 -5 -2013) HC 60 ZM (3. 858 records; 6 -5 -2013) Proces: 20140619_Werkzaamheden Samenstellen Basishypercubes VT 2011 Aanmaken marginalen m. b. v. Tau-ARGUS (stap 9) HC 41 CH (3. 317. 714 regels; 31 -7 -2013) HC 53 CH (12. 473 regels; 23 -7 -2013) HC 54 CH (182. 195 regels; 31 -7 -2013) HC 59 CH (2. 324 regels; 23 -7 -2013) HC 60 CH (9. 540 regels; 23 -7 -2013) Proces: 20140619_Werkzaamheden Bepalen Marginalen en Nabewerkingen VT 2011

Werkzaamheden Opgeleverde (tussen) bestanden Bijbehorende documentatie 5 registerhypercubes Woningen Stap 11: \Ssb 1 fssb 10PROJECTENVT 2011Hypercubes MarginalenDATA Stap 12: \Ssb 1 fssb 10PROJECTENVT 2011Hypercubes Census. Hub Stap 11: \Ssb 1 fssb 10PROJECTENVT 2011Hypercubes Stap 12: \Ssb 1 fssb 10PROJECTENVT 2011DocumSDMXCensus hub (controles: \\Ssb 1 fssb 10PROJECTENVT 2011Hypercubes Controles_Hypercubes) Nabewerking (stap 11) HC 41 CH (keuzemogelijkheid variabelen) HC 54 CH (keuzemogelijkheid variabelen) Proces: 20140619_Werkzaamheden Bepalen Marginalen en Nabewerkingen VT 2011 Census hub (stap 12) HC 41 (3. 317. 712 cellen) HC 53 (12. 471 cellen) HC 54 (182. 193 cellen) HC 59 (2. 322 cellen) HC 60 (9. 538 cellen) Proces: 20120716_Gebruikersinstructie Census data import tool 41(BCW), 53(CW), 54(BCW), 59(W), 60(CW) Controles: 20140130_Controles hypercubes Woonruimten

Contents Quality of registers • Quality in official statistics • Data collection methods • Costs • Response burden • Product quality • Register-based statistics compared to statistical surveys • Combining research • Data considerations in the Dutch Census of 2011 • Introduction to the quality framework • Results Source hyper dimension • Results Metadata hyper dimension • Results Data hyper dimension • Conclusions 40

Quality in official statistics Definition of quality in statistics according to Eurostat “Code of practice” Product quality – Relevance – Accuracy – Timeliness and punctuality – Comparability and coherence – Accessibility and clarity Process quality – Best methods – Cost efficiency – Low response burden 41

Data collection methods Options • Census/full coverage statistical survey • Sample survey • Administrative registers Administrative data are collected for administrative purposes • Register-based statistics is secondary use of existing data Decision on data collection method is a compromise between • Cost efficiency • Response burden • Product quality 42

Costs Current situation in many countries • The NSIs have experienced budget cuts / restrictions • Users demand new and more detailed statistics • Must increase efficiency in production of statistics Administrative data • Almost no costs for data collection (for the NSI) • Use resources on improving existing data instead of collecting data for statistical purposes – Supplement and correct existing data – Most resources used in establishing register-based statistical systems – But: systems must be maintained Register-based statistics is not free of charge but normally less expensive than sample surveys and especially than traditional censuses 43

Response burden Use of administrative data means no additional response burden For companies – “Reporting to authorities takes too much time” For citizens – “The authorities should not ask for information that I have already given” For the NSI – Increasing non-response problems in sample surveys and censuses 44

Product quality (1) Relevance • Register data is based on administrative definitions that may differ from statistical definitions – Units, coverage, variables, time references etc • “We have the right answers, but can we answer the right questions? ” • “The authorities picture of the world? ” • Combining data from different registers to improve relevance • In some cases: additional data collection is necessary 45

Product quality (2) Accuracy • Registers normally have good quality for administrative purposes • Improving accuracy by combining data from several registers – Editing for statistical purposes 46

Product quality (3) Timeliness and punctuality • Production time sometimes longer than for statistical surveys – Administrative process may take time (example: tax data) – Delay in updating of registers – Data extraction: necessary to wait some weeks or months and sometimes even longer 47

Product quality (4) Comparability and coherence • Building a coherent register-based statistical system • Harmonising with statistics based on other sources – Experiences in the Netherlands Accessibility and clarity • Almost independent of data sources used 48

Register-based statistics compared to statistical surveys (1) • Costs (++) • Response burden (++) • Relevance (-) – Not all variables are included in registers – Less direct control over data content • Accuracy (0) • Timeliness (-) 49

Register-based statistics compared to statistical surveys (2) Administrative registers offers • Total coverage at a low cost – Statistics for small groups possible (compared to sample surveys) • Annual (or more frequent) data for all variables – Annual “censuses” • To produce statistics based on administrative data has proved to be efficient • Register-based statistics have to be supplemented by information from sample surveys 50

Combining research Development of a quality framework for administrative data Data decisions on secundary sources in the Dutch Virtual Census of 2011 51

Data considerations in the Dutch Census of 2011 (1) Last traditional census: 1971 Unwillingness (nonresponse) and reduction of expenses no more traditional censuses Alternative: virtual census 1981 and 1991: Population Register and surveys Development 90’s: more registers → 2001 and 2011: integrated set of registers and surveys European Census Act → hypercubes 52

Data considerations in the Dutch Census of 2011 (2) Registers: Population Register (PR), >16. 6 million records Jobs file, containing all employees Self-employed file, containing all self-employed Unemployment Benefit Register (UR) Social Security Register (SR) Education Register (ER) New Housing Register (HR) Surveys: Survey on Employment and Earnings (SEE) stopped Labour Force Survey (LFS) Housing survey (HS) 53

Introduction to the quality framework A UR CE D SO TA METADATA: Focuses on the (availability of the) information required to SOURCE: - Focus on data source as a whole understand use the - Contact information related data in the data source - Delivery related aspects - and more DATA: - Technical checks - Accuracy related issues 54

Results Source hyper dimension Low frequency of delivery Suffers Purpose seriously from dataprovider selective unclear undercoverage Important variables are missing 55

Results Metadata hyperdimension Time period in source can’t be transferred easily to the time point needed Time differences in reporting periods Unique keys can’t be easily used for linking 56

Results Data hyper dimension - completeness 57

Results Data hyper dimension – accuracy 58

Results Data hyper dimension – accuracy 59

Conclusions Quality of official statistics is an important aspect, especially when use is made of integrated data The virtual census has proved to be a successful concept in the Netherlands The quality framework is a useful tool for making data decisions in the virtual census The quality study will be extended to be able to determine how all census variables will be derived 60

Contents Effects on demographic and social statistics • Requirements for modern social statistics • Driving forces • Policy implications • Life cycle model • Relevant statistical information for policy and society • Strategy for data collection • Secondary data • How to get consistency of different data sources? • Prototype of a micro database • Conclusions 61

Requirements for modern social statistics Product quality (Eurostat Code of Practice): 1. Relevance 2. Accuracy 3. Timeliness and punctuality 4. Comparability and coherence 5. Accessibility and clarity 62

Driving forces More coherence, more thematic publications, more detail (small areas, population groups) and more flexibility in the statistical output (will lead to a better product) ICT developments: more registers High nonresponse rates in social surveys To cut down processing costs: standardisation To lower response burden: less questions, EDI (or EDC) and diminish ‘irritation factor’ 63

Policy implications • From primary to secondary data collection – Wherever possible use data available in existing registers and other administrative sources – Primary data collection only, if no (timely) data available (or of bad quality) – Statistics Netherlands Act • From traditional to electronic data collection • Standardisation of statistical processes; multidata-source statistics; efficient sampling • Challenges must be faced while the available budget is constantly being reduced 64

Life cycle model (1) Labour market position Education - Working/non Income working - Occupation Health Consumption Demography - Economic activity - Year of birth Social - Nationality Demography capital Housing - Household composition Time use … Well-being - Etc. 65 Labour market position

Life cycle model (2) Labour market position Education Income Health Consumption Demography Housing Time use … Social capital Well-being 66

Life cycle model (3) me Ti Cases T+2 T Variables T+1 67

Life cycle model (4) 68

Life cycle model (5) Analysis possibilities: • State • Transitions between states • Duration time in a certain state e m Ti 69

Life cycle model (6) e T im 70

Relevant statistical information for policy and society • Domain specific • Transitions and durations within a domain • Relations between domains • Relations between transitions and durations between domains • Monitor information (long period) 71

Strategy for data collection (1) • Start with registers (e. g. population register, housing register, business register) • Add data from other administrative sources • Add data from business and household surveys • Match all these data at the micro level • Create a ‘data clearing house’ within the statistical office 72

Strategy for data collection (2) Variables Registers . . n All inhabitants Netherlands 1 Surveys 73

Strategy for data collection (3) Matching method for individual data RIN Longitudinal Administrative or Population Register survey data 74

Secondary data (1) Quality • Quality may be good for some basic registers, but not for all registers; monitoring quality is important • No sampling errors • No unit nonresponse • Many sources of non-sampling errors remain: – Item nonresponse – Measurement errors – Coverage errors 75

Secondary data (2) Challenges • Impact on the organisation, coordination, crossing departmental boundaries, change in culture • Influence of a statistical office on contents of registers is limited • Communication with register holders, e. g. about quality and changes • Quality control system (control surveys? ) • Comprehensive, standardised metadata system • Version control system for updates • Changing form surveys to registers without causing a trend break 76

How to get consistency of different data sources? • Harmonisation! (coverage, definitions, reference periods, etc. ) • Editing of all records at micro level by automated procedures • Only edit what needs to be edited (clear instructions are necessary!) • Make use of the technique of repeated weighting for survey data 77

Prototype of a micro database (1) X 1…XK Y 1…YM Z 1…ZR U 1…US LFS HS 78

Prototype of a micro database (2) Output inspired harmonisation: the one figure for one phenomenon idea Stat. Line: all statistical information on the web (via home page of Statistics Netherlands) http: //www. cbs. nl/en-GB/menu/home/default. htm 79

Conclusions Social statistics develop in the direction of a permanent virtual census to be able to produce: – More crosstables over different domains – More longitudinal information – More flexible policy relevant output 80

Contents Cleansing, processing and data quality revisited • Definition and driving forces of the SSD • The scope of the SSD • The process • Linking the sources • Micro integration • Estimation aspects • Statistical confidentiality • Conclusions 81

Definition and driving forces of the SSD Definition: set of integrated microdata files with coherent and detailed demographic and socio-economic data on persons, households, jobs and benefits No remaining internal conflicting information Driving forces: • Virtual Census of 2001 • Better products: more coherence and flexibility 82

The scope of the SSD All relevant variables in the life cycle • Demography • Health • Education • Labour market position • Income • Consumption • Housing • Time use • Etc. 83

The process Already discussed: – Specify the information needed – Collection of registers – Surveys only additional Still to discuss: – Linking the sources – Micro integration – Estimation aspects – Statistical confidentiality 84

Linking the sources (1) • The Population Register is the backbone of the system for persons • All other files are matched exactly to the Population Register, • such that the true matches are maximised (aim: no missed matches) and the false matches (mismatches) are minimised 85

Linking the sources (2) Matching variables: • Social security and fiscal (SOFI) number (effectiveness close to 100%), since 2007 Citizen Service Number • Other personal identifiers: sex, date of birth, and address (effectiveness close to 100%) • Number of mismatches very low (close to 0%) 86

Micro integration (1) The aim of micro integration is: – To check the linked data and modify incorrect records, – in such a way that the results that are to be published are of higher quality than the original sources 87

Micro integration (2) To fulfil this demand an integrated process of: • data editing, • derivation of statistical variables, • and imputation is executed 88

Micro integration (3) Constraints and limitations: - Only variables that are to be published are micro integrated - Identity rules are necessary, e. g. the same variable in two sources or a relationship between two or more variables in one or more sources - No mass imputation 89

Estimation aspects Surveys are samples from the population If surveys are enriched with register information, estimations of the register part of the enriched survey will lead to inconsistencies with the counts from the entire register Statistics Netherlands developed the method of repeated weighting to solve these inconsistencies (aim: numerically consistent estimations) 90

Statistical confidentiality IDs Variables Characteristics Administrative sources Identifiers (PINs, sex, date of birth, address) IDs Variables Household surveys PERSONS BACKBONE full range of all persons as from 1995 IDs in sources are replaced by random Record Identification Numbers (RINs) 91

Conclusions The SSD diminishes the administrative burden and increases: – The efficiency of statistics production – The accuracy of statistical outputs – The possibilities for social policy research Safeguarding confidentiality is vital for the process of record linkage 92

Contents Communication aspects (1) • History of the Dutch Census • The Dutch Census of 2011 • Data sources • Combining sources: micro linkage • Combining sources: micro integration • Conditions facilitating use of administrative sources • Miscellaneous aspects • Result on 2011 economic activity 93

Contents Communication aspects (2) • Comparison with other countries • Comparison with other years • Data integration activities between the 2001 Census and the 2011 Census • Preparing the 2011 Census • Conclusions 94

History of the Dutch Census (1) TRADITIONAL CENSUS Ministry of Home Affairs: 1829, 1839, 1849, 1859, 1869, 1879 and 1889 Statistics Netherlands: 1899, 1909, 1920, 1930, 1947, 1960 and 1971 Unwillingness (nonresponse) and reduction expenses no more traditional censuses 95

History of the Dutch Census (2) ALTERNATIVE: VIRTUAL CENSUS 1981 and 1991: limited virtual censuses based on Population Register and surveys development 90’s: more registers → integrated set of registers and surveys, SSD 2001 and 2011: complete virtual censuses based on the SSD with information at the municipality level 96

The Dutch Census of 2011 is based on the Social Statistical Database (SSD) which • is a set of integrated microdata files with coherent and detailed demographic and socio-economic data on persons, households, jobs and benefits • has no remaining internal conflicting information is part of the European Census • Eurostat: coordinator of EU, accession and EFTA countries in the European Census Rounds • Census Table Programme, every 10 years Social statistics in the Netherlands develop in the direction of a permanent Virtual Census to be able to produce: • More crosstables over different domains • More longitudinal information • More flexible policy relevant output 97

Data sources Registers: • Population Register (PR) → illegal people excluded, homeless counted at last known address • Jobs file, containing all employees • Self-employed file, containing all self-employed • Fiscal administration • Social Security administrations • Pensions and life insurance benefits • Housing registers Surveys: • Survey on Employment and Earnings (SEE) stopped • Labour Force Survey data around Census Day • Housing surveys no longer necessary for the Census 98

Combining sources: micro linkage • Linkage key: Registers Citizen Service Number, unique Surveys Sex, date of birth, address (postal code and house number) • Linkage key replaced by RIN-person • Linkage strategy Optimizing number of matches Minimizing number of mismatches and missed matches 99

Combining sources: micro integration • Collecting data from several sources more comprehensive and coherent information on aspects of a person’s life • Compare sources - coverage - conflicting information (reliability of sources) • Integration rules - checks - adjustments - imputations • Optimal use of information quality improves • Example: job period vs. benefit period 100

Conditions facilitating use of administrative sources • Legal base (Statistics Act) • Public approval (‘Big Brother is watching you’) • Cooperation among authorities (mainly government organisations) • Comprehensive and reliable register system (administrative versus statistical quality) • Unified identification system (preferably unique ID-numbers) 101

Miscellaneous aspects (1) • Stable identifiers • Stability of registers • Only edit what needs to be edited (by automated procedures) • Dates of real events versus dates of registration • Derived variables (example: current activity status) • Impact on the organisation (change of culture) • Communication with register holders 102

Miscellaneous aspects (2) Output inspired harmonisation (coverage, definitions, reference periods): the one figure for one phenomenon idea Stat. Line: all statistical information on the web (via home page of Statistics Netherlands) http: //www. cbs. nl/en-GB/menu/home/default. htm 103

Result on 2011 economic activity 8. 9% 4. 1% Employed 16. 6% Unemployed 49. 1% Under 15 years Pension or capital income recipients Students (not economically active) Homemakers and others 17. 5% 3. 8% 104

Comparison with other countries Traditional Census (complete enumeration): Most countries in the world (including the UK and the US) Traditional Census (partial enumeration) and Registers: Some countries (e. g. Germany, Poland Switzerland) Rolling Census: France Fully or largely register-based (Virtual) Census: Five Nordic countries (Iceland, Norway, Sweden, Finland Denmark), the Netherlands, Belgium, Austria and Slovenia 105

Comparison with other years Inhabitants and household size Number of inhabitants (x mln) / Mean houshold size 18 16 14 12 10 8 6 4 2 0 1829 1839 1849 1859 1879 1889 1899 1909 1920 1930 1947 1960 1971 1981 1991 2001 2011 Census year Number of inhabitants Mean household size 106

Data integration activities between the 2001 Census and the 2011 Census (1) • Tables (http: //www. cbs. nl/nl. NL/menu/themas/dossiers/his torischereeksen/publicaties/volkstelli ng-2001/2003 -volkstellingexcel. htm) • Book and extra chapter (http: //www. cbs. nl/nl. NL/menu/themas/dossiers/his torischereeksen/publicaties/volkstelli ng-2001/2001 -b 57 -pub. htm) 107

Data integration activities between the 2001 Census and the 2011 Census (2) • Integrated Public Use Microdata Series (https: //international. ipums. org/international) • Lectures (Conferences, Universities, Research institutes, Statististical offices) • ESTP-course Registers in Statistics (Oslo) • International Statistical Seminar Eustat in Bilbao (http: //www. eustat. es/prodserv/seminario_i. html) • Digitalizing (http: //www. volkstellingen. nl/en/) • Recommendations and register-based statistics • CENEX on ISAD (http: //cenex-isad. istat. it) • European census regulations 108

Preparing the 2011 Census • Sources (the PR as backbone of the census, changes in contents and quality of registers, remaining information from LFS) • Estimation method (repeated weighting, new version of the software, fall-back option of weighting to PR, zero cells problem) • Statistical Disclosure Control of the hypercubes (Workshop on SDC of Census Data in April 2012) • Tabular data in SDMX format and the Census Hub 109
Conclusions (1) • A Dutch Virtual Census: yes, we can! • Micro integration remains important • Repeated weighting was a success Advantages: • Relatively cheap (small cost per inhabitant) • Quick (short production time) Disadvantages: • Dependent on register holders (statistics is not their priority), timeliness of registers, concepts and population of registers may differ from what is needed (keep good relations with the register holders!) • Publication of small subpopulations sometimes difficult or even impossible because of limited information 110
Conclusions (2) Other aspects: • Less attention for the results of a virtual census than for a traditional one • Difficult to keep knowledge and software up-todate (Census is running every ten years) • Enormous international interest in virtual censuses • A lot of interesting census work in the coming years! 111
Contents Register-based statistics on earnings • Social questions • History of the Structure of Earnings Survey • Repeated weighting in the Structure of Earnings Survey • Advantages and disadvantages of SSD and repeated weighting • Structure of Earnings Survey sources • Example hourly wages by age and level of education • Conclusions 112

Social questions • Wage differences between men and women • Does extra eduation pay off? • Wage differences between occupations 113
History of the Structure of Earnings Survey 70 ies: 80 ies: Separate large scale survey Survey on top of the Yearly Wage Survey 90 ies: European Structure of Earnings Survey 1995 (matching available sources), repeated for 1996 and 1997, for 1998 the SSD and repeated weighting were used for the first time • European Structure of Earnings Survey 2002, 2006, 2010, 2014, etc. • Large demand for structure of earnings data 114
Repeated weighting in the Structure of Earnings Survey (1) Aim: Estimate survey results consistently given the register totals Problem: Not possible with traditional weighting (too many restrictions) Solution: • Different weights for different tables • Calibrate on earlier calculated tables • Tables that can be estimated with a large reliability have to be estimated first 115
Repeated weighting in the Structure of Earnings Survey (2) Conditions: • Datasets contain unique matching key • Inconsistencies between sources have been solved • Variables and questionnaires have been harmonised • Complete meta information, also about the survey design • Hierarchic classification levels • Sufficient records in cells in tables to estimate 116
Repeated weighting in the Structure of Earnings Survey (3) Preparation SQL database • Import source data sets in database • Recode • Match at record level • Define target population • Aggregate from register data sets • Make rectangular data blocks SPSS • Define block weights VRD • Software developed for repeated weighting 117

Repeated weighting in the Structure of Earnings Survey (4) SSD register data sets Surveys Read in SQL database Match, edit, make rectangular blocks Block 2 Block 3 Block 4 Block 1 118

Repeated weighting in the Structure of Earnings Survey (5) Block 2 Block 1 Block 3 Block 4 Meta information VRD Bascula Output to Excel 119
Advantages and disadvantages of SSD and repeated weighting (1) Advantages of SSD: • Maximal use of registers • Variance reduction • Better nonresponse correction • New tables • Harmonisation of surveys 120
Advantages and disadvantages of SSD and repeated weighting (2) Advantages of repeated weighting: • Numerically consistent estimations • Better estimations • Requires strict hierarchy of variables (statistical disclosure control!) • Suitable estimation method for defined sets of tables • Software to estimate sets of tables 121
Advantages and disadvantages of SSD and repeated weighting (3) Disadvantages: • Estimation process more complicated • Method cannot be repeated easily by others • Method not suitable in all situations (few records, many empty cells) • Consistency between all SSD tables impossible 122
Structure of Earnings Survey sources (1) Jobs and wages of employees by • Level of education • Level of occupation Registers • Population register (PR) • Job register (SSD) Surveys • Survey on Employment and Wages (SEW) • Labour Force Survey (LFS) 123
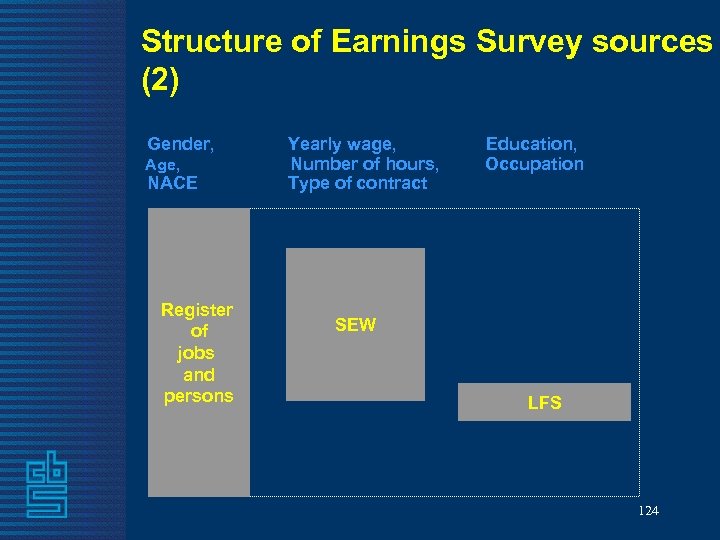
Structure of Earnings Survey sources (2) Gender, Yearly wage, Education, Age, Number of hours, Occupation NACE Type of contract Register of jobs and persons SEW LFS 124
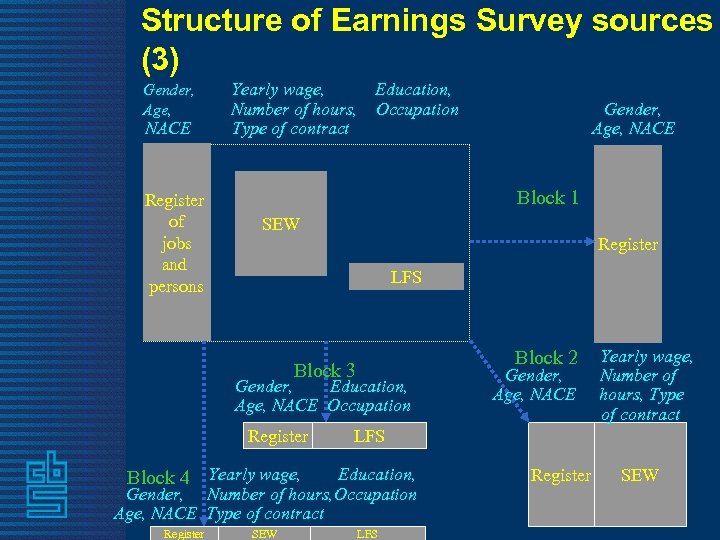
Structure of Earnings Survey sources (3) Gender, Age, NACE Register of jobs and persons Yearly wage, Education, Number of hours, Occupation Type of contract Block 1 SEW Register LFS Block 2 Block 3 Gender, Education, Age, NACE Occupation Register Education, Gender, Number of hours, Occupation Age, NACE Type of contract SEW Gender, Age, NACE Yearly wage, Number of hours, Type of contract LFS Block 4 Yearly wage, Register Gender, Age, NACE LFS Register SEW 125
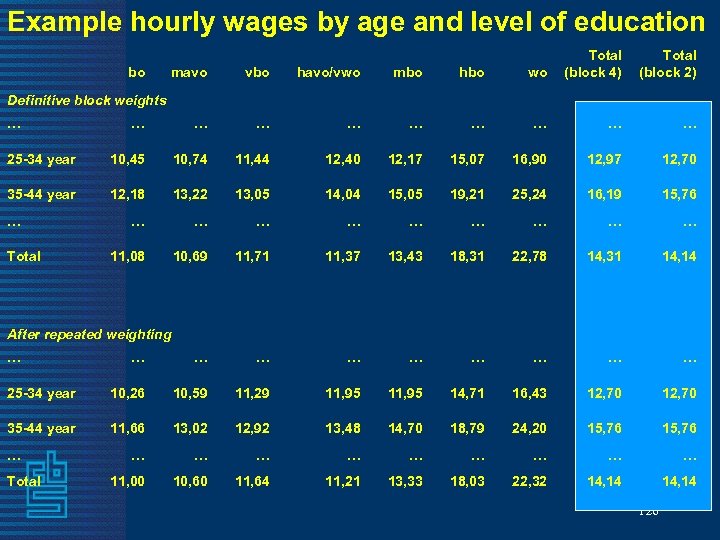
Example hourly wages by age and level of education bo Total (block 4) (block 2) mavo vbo havo/vwo mbo hbo wo … … … … … 25 -34 year 10, 45 10, 74 11, 44 12, 40 12, 17 15, 07 16, 90 12, 97 12, 70 35 -44 year 12, 18 13, 22 13, 05 14, 04 15, 05 19, 21 25, 24 16, 19 15, 76 … … … … … 11, 08 10, 69 11, 71 11, 37 13, 43 18, 31 22, 78 14, 31 14, 14 … … … … … 25 -34 year 10, 26 10, 59 11, 29 11, 95 14, 71 16, 43 12, 70 35 -44 year 11, 66 13, 02 12, 92 13, 48 14, 70 18, 79 24, 20 15, 76 … … … … … 11, 00 10, 60 11, 64 11, 21 13, 33 18, 03 22, 32 14, 14 Definitive block weights … … Total After repeated weighting … … Total 126

Conclusions • Repeated weighting is well possible for the SES • Social questions have been answered • Interesting source for researchers 127

Time for questions and discussion 128
9156f1eb65ba45789871d60c290ade8b.ppt