

931c88235bcf82626cfde826089b7ecf.ppt
- Количество слайдов: 64
 Preparation, Storage, Characterization and Use of Two-surface Reflectance Standards for VUV and EUV Optics David D. Allred 1, , E. Strein 1, Nicole Brimhall 1, Zach Strother 2 and R. Steven Turley 1 Brigham Young University and 2 Georgia Institute of Technology
 IMAGE Extreme Ultraviolet Imager http: //euv. lpl. arizona. edu/euv/index. html IMAGE Extreme Ultraviolet Imager Earth's plasmasphere at 30. 4 nm. This image from the Extreme Ultraviolet Imager was taken at 07: 34 UTC on 24 May 2000, at a range of 6. 0 Earth radii from the center of Earth and a magnetic latitude of 73 N. The Sun is to the lower right, and Earth's shadow extends through the plasmasphere toward the upper left. The bright ring near the center is an aurora, and includes emissions at wavelengths other than 30. 4 nm. (From Sandel, B. R. , et al. , Space Sci. Rev. , 109, 25, 2003. ) He. II is singly ionized He. Trapped in the Earth’s Magnetosphere it scatters light from sun’s corona due to 1 s to 2 p transition
 Reflecting at 30. 4 & Antireflecting at 58. 4 nm D. D. Allred, R. S. Turley, M. B. Squires, “Dual-function EUV multilayer mirrors for the IMAGE mission, ” in EUV, X-Ray and Neutron Optics and Courses, Carolyn A. Macdonald, Kenneth A. Goldberg, Juan R. Maldonado, H. Heather Chen-Mayer, Stephen P. Vernon, Editors, Proceedings of SPIE Vol. 3767, 280 -287 (1999). pdf
 Our Goal – EUV Applications: there are scientists in China & US wanting Earth-observing Lunar. EUV Lithography n n Extreme Ultraviolet Optics has several applications. These Include: EUV Astronomy ¨ EUV Lithography ¨ EUV Astronomy ¨ Soft X-ray Microscopes n A Better Understanding of materials for EUV applications is needed. The Earth’s magnetosphere in the EUV Soft X-ray Microscopes
 Introduction: Extreme Ultraviolet Optics and Optical Constants § § Two examples § § IMAGE satellite 2000 (above) Th. O 2 optical constants (right) Optical constants of compounds in the EUV are typically unknown, incomplete, or inaccurate. This can be important for those designing EUV optics for applications such as astronomy, lithography, or microscopy.
 BYU researchers have addressed the following concerns for those who would do some VUV/EUV (Vacuum/Extreme Ultraviolet) optics in a conventional laboratory as opposed to a large synchrotron facility: 1. Standards- Zach Strother (NSF-REU 07) 2. Mirror cleaning and storage. Liz Strein 3. Modeling 4. Sources/ spectrometers
 Standards: Desirable Qualities Robust n Stable n Cleanable n Cheap n Easy to Fabricate n Easy to Characterize n First studied is Si. O 2 on Si- that is (thermally oxidized Si) n
 J. Tveekrem, “Contamination effects on EUV optics, ” NASA Technical Report TP-1999 -209264, 1999. Used with permission.
 light on silicon incident light") Calculated reflectance for 41. 3 nm (30 e. V) light on silicon incident light reflected light organic Si. O 2 Workers in x ray and EUV frequently measure from glancing angle as in figure. reflectance Si E. Gullikson, X-Ray Interactions with Matter, http: //henke. lbl. gov/optical_constants Accessed 27 Feb 2008. (calculated with the bilayer program)
Calculated reflectance for 41. 3 nm (30 e. V) light on silicon incident light reflected light organic Si. O 2 Workers in x ray and EUV frequently measure from glancing angle as in figure. reflectance Si E. Gullikson, X-Ray Interactions with Matter, http: //henke. lbl. gov/optical_constants Accessed 27 Feb 2008. (calculated with the bilayer program)
 Outline of cleaning section Motivation: Dirt is clear in EUV n Techniques/Methods: VUV lamp n Results n
 X-ray Photoelectron Spectrometer (XPS) Ellipsometer Evactron Plasma Cleaner") Instrumentation Excimer UV lamp (cleans samples) X-ray Photoelectron Spectrometer (XPS) Ellipsometer Evactron Plasma Cleaner (cleans XPS antechamber)
Instrumentation Excimer UV lamp (cleans samples) X-ray Photoelectron Spectrometer (XPS) Ellipsometer Evactron Plasma Cleaner (cleans XPS antechamber)
 Excimer Lamp Cleaning technique n The excimer lamp creates ozone and atomic oxygen by exposing oxygen to 172 nm photons. • These products oxidize the organic adventitious carbon on the samples thus freeing the Si. O sample of its organic contamination n 2 Adapted from http: //ecl. web. psi. ch/Nano. Kat/Ni_Al 2 O 3_ethanol_1. jpg O
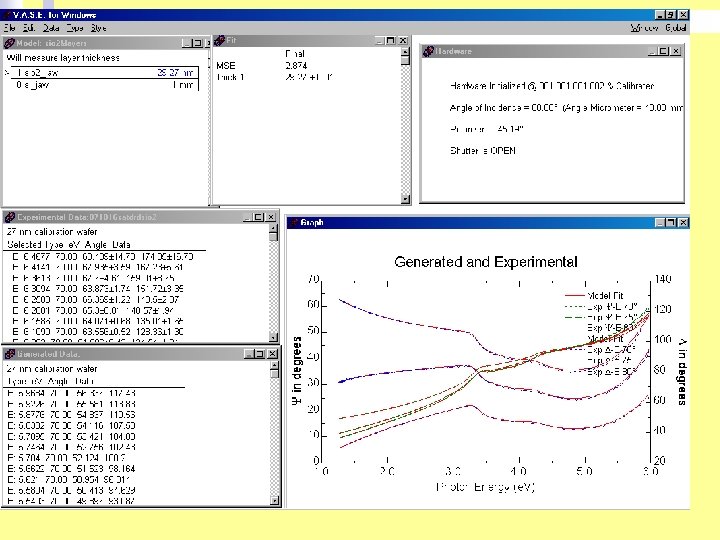
 Ellipsometry Looks at how polarized light changes when it reflects from a surface. n Used to determine the relative change in thickness for the “apparent oxide” on a sample n “apparent oxide” layer organic Si. O 2 Si Substrate Adapted from http: //users. aber. ac. uk/tej/ellipso 5. gif
 Before excimer lamp Si 2 p After excimer lamp Si 2 p
 Correlation between characterization methods
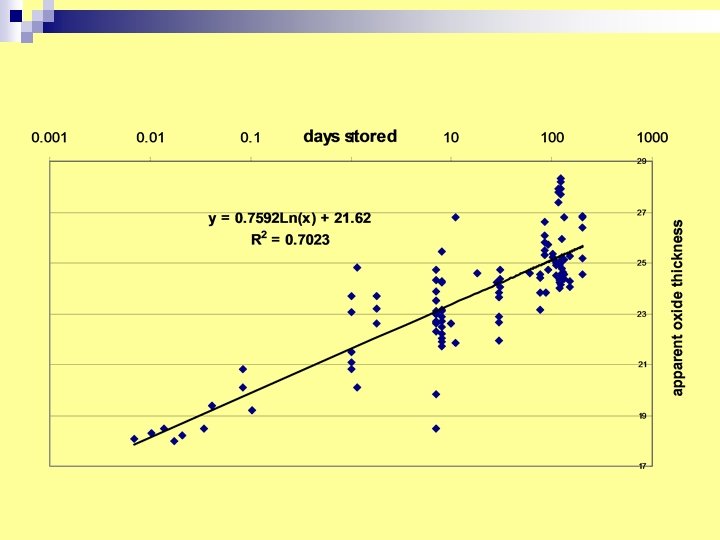
 how the “apparent oxide” thickness decreases with exposure time
 Application to Source development
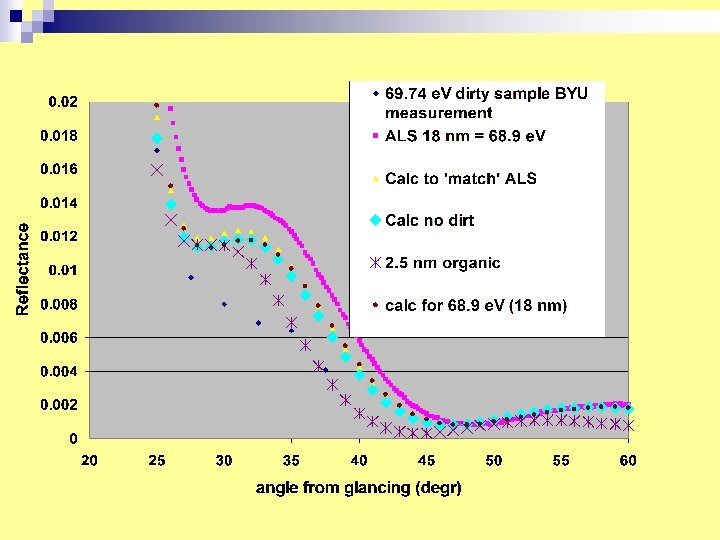
 Comparison after cleanup
 Take-home message of cleaning portion n n 5 min under lamp cleans off most of the last couple of angstroms of AC Correlation between characterization techniques (there are big problems when the characterization instruments change the nature of a sample) Cleanliness is important but can be achieved. Cleanup right before measurement is important.
 Sources of EUV light § Synchrotron Source High flux Wide, continuous wavelength range Not local, expensive to run, large footprint § Fixed polarization § § Plasma Source Low Flux Wide wavelength range, only a few wavelengths in the range § Local § Unpolarized § § § High Harmonics: femtosecond laser § Fairly high flux § Wide wavelength range, good spacing of wavelengths throughout the range § Local § Easily rotatable linear polarization
 polarimeter that employs") Overview and Conclusions § We have constructed an extreme ultraviolet (EUV) polarimeter that employs laser-generated high-order harmonics as the light source. § This instrument represents a potential ‘in-house’ instrument at facilities developing EUV thin films. § The source has high flux, a wavelength range from 8 -62 nm, and easily rotatable linear polarization. § The instrument has a versatile positioning system and can measure reflectance of multiple wavelengths of light simultaneously. § We have compared reflectance data with that taken at the Advanced Light Source (ALS) and with calculated data. These measurements agree well.
Overview and Conclusions § We have constructed an extreme ultraviolet (EUV) polarimeter that employs laser-generated high-order harmonics as the light source. § This instrument represents a potential ‘in-house’ instrument at facilities developing EUV thin films. § The source has high flux, a wavelength range from 8 -62 nm, and easily rotatable linear polarization. § The instrument has a versatile positioning system and can measure reflectance of multiple wavelengths of light simultaneously. § We have compared reflectance data with that taken at the Advanced Light Source (ALS) and with calculated data. These measurements agree well.
 Introduction: Extreme Ultraviolet Optics and Optical Constants § § Two examples § § IMAGE satellite 2000 (above) Th. O 2 optical constants (right) Optical constants in the EUV are typically unknown, incomplete, or inaccurate. This is important for those designing EUV optics for applications such as astronomy, lithography, or microscopy.
 Optical Constants Optical constants are determined by measuring reflectance as a function of angle of a sample at a fixed wavelength and polarization, then fitting this data to the Fresnel equations. EUV light incident angle (Θ) sample
 Sources of EUV light § Synchrotron Source High flux Wide, continuous wavelength range Not local, expensive to run, large footprint § Fixed polarization § § Plasma Source Low Flux Wide wavelength range, only a few wavelengths in the range § Local § Unpolarized § § § High Harmonics Fairly high flux Wide wavelength range, good spacing of wavelengths throughout the range § Local § Easily rotatable linear polarization § §
 High Harmonic Generation EUV Grating EUV Generation EUV Light 800 n Wavelength range from 8 -62 nm nm, 30 fs, 10 m. J n Flux of 6 x 10⁸ photons/second Laser Pulses n MCP Detector Easily rotatable linear polarization Gas (He, Ne, Ar) § § § λ = 800 nm / q § Orders 37 to 77 Wavelengths of 10 -22 nm § Fairly high flux Wide wavelength range with good spacing of wavelengths within the range Easily rotatable linear polarization Small footprint, low cost of operation Potential ‘in-house’ instrument at facilities developing EUV thin films
 Instrument Overview EUV generation f=100 cm focusing lens dual rotation stages turbo pumps secondary gas cell gas (He, Ne, Ar) sample 800 nm, 30 fs, 10 m. J laser pulses EUV grating rotatable half aperture -wave plate turbo pump MCP CCD n n n Easily rotatable linear polarization Ability to measure reflectance of multiple wavelengths simultaneously Extensive scanning ability
 Polarimeter Positioning System § The positioning system is made up of six motors, each controlled by a single computer. § The diffraction grating is placed after the sample, allowing simultaneous reflectance measurements at multiple wavelengths.
 Controlled Harmonic Attenuator We increase the dynamic range of our detection system with a secondary gas cell that acts as a controlled harmonic attenuator. 90% secondary gas cell 0. 01%
 Laser Power Discriminator Stability of our high harmonic source is important to the accuracy of polarimetry measurements. § § Averaging 100 shots decreases variation to about 7%. § A sample of the incident laser beam is imaged in real time simultaneously with harmonics to provide per-shot energy monitoring Shot-to-shot variations in the laser pulse energy lead to about 37% variation in harmonic signal. To further increase repeatability, we implemented a laser energy discriminator, decreasing variations to about 2%.
 Reflectance Measurements § Sample: § § High-harmonic generation parameters: § § thermally oxidized silicon, 27. 4 nm Si. O 2 layer. 100 torr helium gas Measurement parameters: § all measurements averaged over 100 shots where the variation in the laser power was +/-5% § secondary gas cell pressures ranged in value from 0 to 2. 8 torr (attenuation of about 3 orders of magnitude) § dark signal taken simultaneously with measurements § measurements taken on three separate days to examine possible systematics in repeatability.
 Compare
 Conclusions n We have constructed a new instrument that uses high-order harmonics to measure optical properties of materials in the EUV. n Our source has a wide wavelength range, high flux, and easily rotatable linear polarization. n Our instrument has a sophisticated positioning system and is efficient in that simultaneous reflectance measurements can be made at multiple wavelengths. n We have compared reflectance measurements with those taken at the ALS and computed data. These measurements agree.
 Future Work § Investigate a new measurement technique § § It may, however, be possible to measure a very accurate ratio of p- to spolarized reflectance. Our instrument has the capability to quickly toggle between polarizations to measure a very accurate ratio. § § In some regions where reflectance is very low, it may be difficult to measure absolute reflectance accurately (at near-normal angles, absolute reflectance is often on the order of 10 -4). Variation in the laser source or harmonic generation parameters over time scales longer than minutes will no longer be a concern. Also, dynamic range issues will no longer be a problem. Measure optical properties of materials in this wavelength range § Optical constants § Bonding effects on optical properties § Oxidation rates § Roughness effects
 Thank you We would like to recognize NSF grant PHY 0457316 and Brigham Young University for supporting this project.
 High Harmonics: Schematic
 High Harmonics: Horizontal Wavelength Sorting n Helium Gas
 Synchrotron vs. Polarimeter Data
 But there were some steps along the way:
 J. Tveekrem, “Contamination effects on EUV optics, ” NASA Technical Report TP-1999 -209264, 1999. Used with permission.
 light on silicon incident light") Calculated reflectance for 41. 3 nm (30 e. V) light on silicon incident light reflected light organic Si. O 2 reflectance Si E. Gullikson, X-Ray Interactions with Matter, http: //henke. lbl. gov/optical_constants Accessed 27 Feb 2008. (calculated with the bilayer program)
Calculated reflectance for 41. 3 nm (30 e. V) light on silicon incident light reflected light organic Si. O 2 reflectance Si E. Gullikson, X-Ray Interactions with Matter, http: //henke. lbl. gov/optical_constants Accessed 27 Feb 2008. (calculated with the bilayer program)
 Ellipsometer Excimer UV lamp (cleans samples) Evactron Plasma Cleaner") Instrumentation X-ray Photoelectron Spectrometer (XPS) Ellipsometer Excimer UV lamp (cleans samples) Evactron Plasma Cleaner (cleans XPS antechamber)
Instrumentation X-ray Photoelectron Spectrometer (XPS) Ellipsometer Excimer UV lamp (cleans samples) Evactron Plasma Cleaner (cleans XPS antechamber)
 Excimer Lamp Cleaning technique n The excimer lamp creates ozone and oxygen radicals by exposing oxygen to 172 nm photons. • These products oxidize the organic adventitious carbon on the samples thus freeing the Si. O sample of its organic contamination n O 2 Adapted from http: //ecl. web. psi. ch/Nano. Kat/Ni_Al 2 O 3_ethanol_1. jpg
 Ellipsometry Looks at how polarized light changes when it reflects from a surface. n Used to determine the relative change in thickness for the “apparent oxide” on a sample n “apparent oxide” layer organic Si. O 2 Si Substrate Adapted from http: //users. aber. ac. uk/tej/ellipso 5. gif
 Detects the speed of electrons ripped off from a sample’s") X-ray Photoelectron Spectroscopy (XPS) Detects the speed of electrons ripped off from a sample’s surface by x rays. n Used to determine the chemical composition of a sample. n http: //www. almaden. ibm. com/st/scientific_services/materials_analysis/xps/XPS. gif
X-ray Photoelectron Spectroscopy (XPS) Detects the speed of electrons ripped off from a sample’s surface by x rays. n Used to determine the chemical composition of a sample. n http: //www. almaden. ibm. com/st/scientific_services/materials_analysis/xps/XPS. gif
 Need for Evactron: Deposition rate on the samples exposed to the XPS antechamber
 Evactron C De. Contaminator n Plasma clean the XPS chamber http: //www. evactron. com/63193/image 2. gif
 Acknowledgements n n n n Amy Grigg Mike Keenlyside at Surface Physics Resonance LTD for the excimer lamp Gabe Morgan and Ron Vane for their loan of the Evactron C De-Contamination System Dr. Matt Linford Lei Pei The department of Physical and Mathematical Sciences for funding
 Storage data Storage time: 10 min to 19 days Most samples began with an apparent oxide layer ≤ 1. 83 nm
 Genetic Algorithm Genome Material Thickness Original Population Strong Performers become parents Strong Performers becomes parents Poor Performers discarded etc.
 Paratt Recursion Polarization S P
/a-C(5) 304 584 R Angle") Modeled Reflectance: Mg(37)/a-C(5) 304 584 R Angle
Modeled Reflectance: Mg(37)/a-C(5) 304 584 R Angle
 a-C/Mg : S vs. P polarization P S
 Mg/a-C Barriers/Limitations n a-C : variable optical and thickness properties based on deposition and origin. n Mg : rapid oxidation complicates production, characterization of bilayer.
 Other potential Bilayer partners Fe, Ti – concerns about oxidation n Ni – magnetic properties problematic for sputtering deposition n Si – strong possibilities, models show many bilayers with strong interference peaks n
/Ru(20) 304 584 R Angle") Modeled Reflectance: Si(46)/Ru(20) 304 584 R Angle
Modeled Reflectance: Si(46)/Ru(20) 304 584 R Angle
 Ru/Si : S vs. P Polarization n P S
 Si/Si. O 2
 Si/Si. O 2
 Conclusions n n Polarimeter allows for accurate EUV data collection in conventional laboratories a-C/Mg is optically effective but difficult to produce Si/Ru is optically effective, can be produced with single sputtering source Si. O 2 on Si wafer is a good, easily obtainable standard
 Acknowledgments n n n NSF REU program at BYU summer 2007. Dept of Physics and Astronomy BYU Prof. R. Steven Turley, Joseph Muhlestein and Elise Martin for measurements at the ALS. Additional thanks to Eric Gullikson, Andrew Aquila and others at the ALS, and to the ALS for time on beamline 6. 3. 2. Prof. Justin Peatross, Prof. Michael Ware, Matthew Turner, and Nick Herrick for addition help in setting up the polarimeter.