0b80d71161dd3691b3f3c7a81a7536c8.ppt
- Количество слайдов: 27
 ANALYSIS OF PATENT TONG AND BAR CLEANING") PRELIMINARY COMPARISON OF GEOGRAPHIC INFORMATION SYSTEM (GIS) ANALYSIS OF PATENT TONG AND BAR CLEANING OYSTER POPULATION ESTIMATES IN THE UPPER CHESAPEAKE BAY Allen, S, H. Lane, J. Goodwin, M. Chen, M. L. Kellogg, K. T. Paynter MEES Program, 0105 Cole Field House, University of Maryland, College Park, MD 20742
PRELIMINARY COMPARISON OF GEOGRAPHIC INFORMATION SYSTEM (GIS) ANALYSIS OF PATENT TONG AND BAR CLEANING OYSTER POPULATION ESTIMATES IN THE UPPER CHESAPEAKE BAY Allen, S, H. Lane, J. Goodwin, M. Chen, M. L. Kellogg, K. T. Paynter MEES Program, 0105 Cole Field House, University of Maryland, College Park, MD 20742
 Introduction • Oysters are of vital importance to the health of the Chesapeake Bay • Oyster abundance in the bay has been on the decline since the late 1800’s • Currently, there is no standard method for population estimation
 Goal: Pilot Study Explore methods of oyster population estimation
 Objectives • Ground truth patent tong sub-sampling • Estimate & compare oyster bar populations using two methods (Leslie/De. Lury and GIS) • Determine the feasibility & reliability of estimates based on patent tong sampling
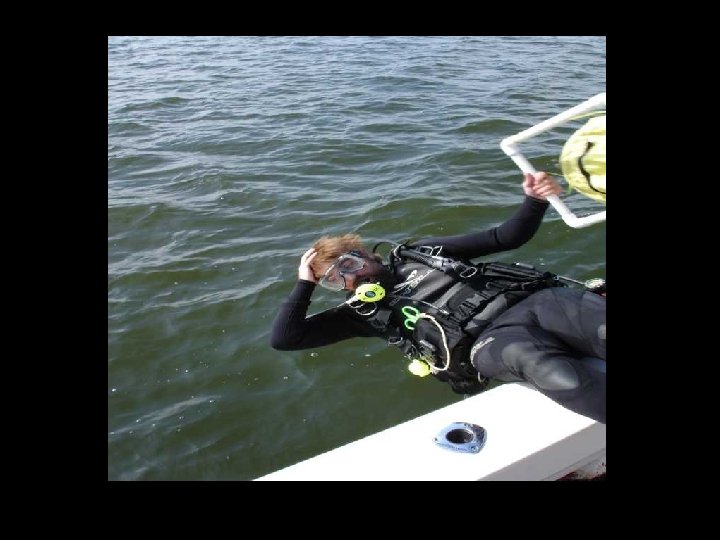
 Patent Tonging • Modern method of oyster harvesting • Allows for sampling of a greater area than with divers
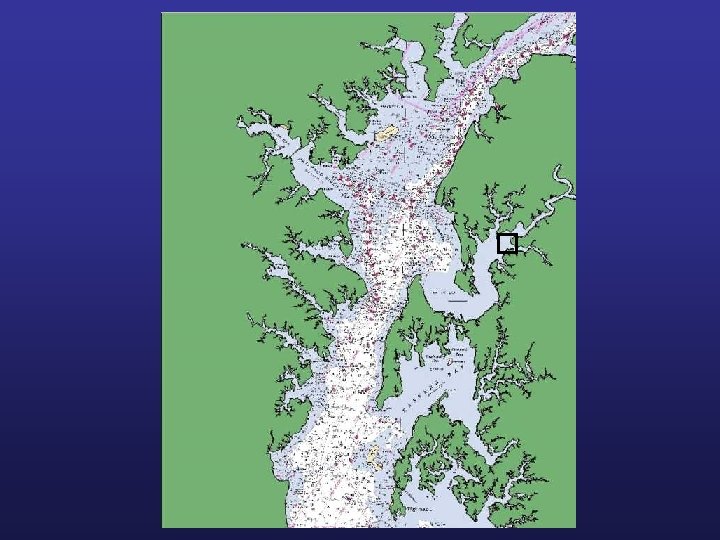
 Washington, D. C.
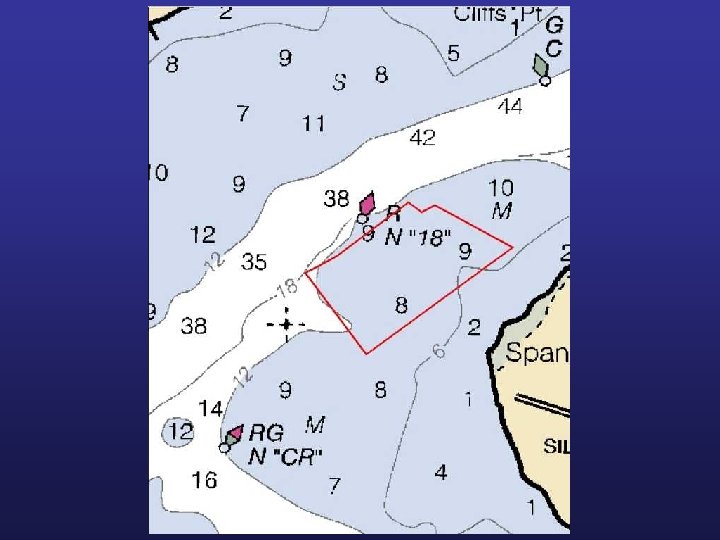
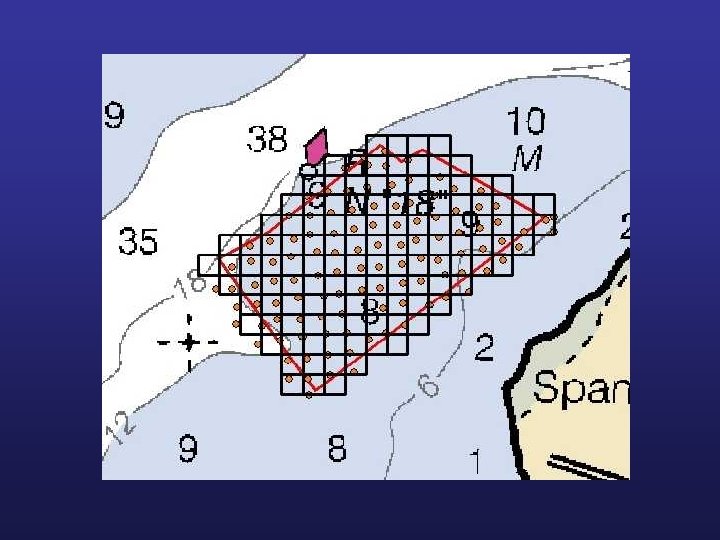
 Patent Tong Survey • Created a grid over the oyster bar that was to be Bar Cleaned • Conducted transects along grid lines with the Patent Tong boat. • All Patent Tong grab locations were marked with a GPS • All oysters collected were counted and measured
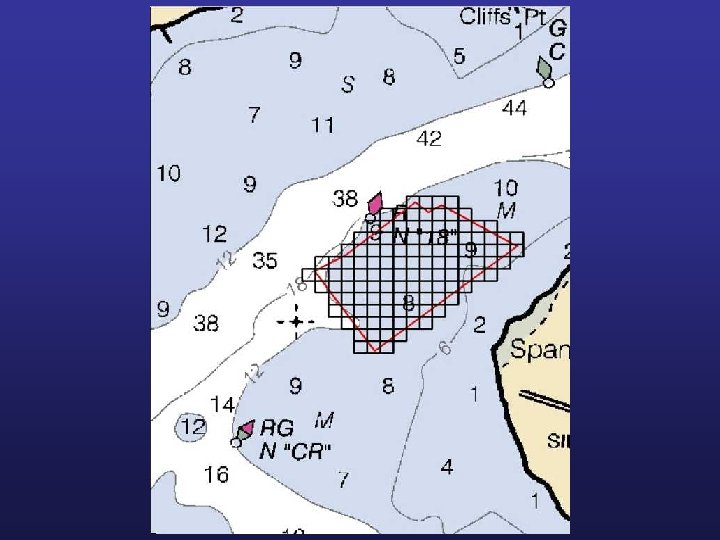
 Patent Tong Survey • Created a grid over the oyster bar that was to be Bar Cleaned • Conducted transects along grid lines with the Patent Tong boat • All Patent Tong grab locations were marked with a GPS • All oysters collected were counted and measured
 What is GIS? GIS is a computer system capable of assembling, storing, manipulating, and displaying geographically referenced information (spatial data).
 GIS Oyster Bar Population Estimates • Raw patent tong data = number of oysters per sampling point • Oyster bar population was estimated using Inverse Distance Weighting (IDW) interpolation
 Initial Population Estimates • GIS Inverse Distance Weighting Interpolation of Patent Tong data GIS IDW Estimation (bu) Spaniards Point 358 Durdin 98 Carpenter's Island 24
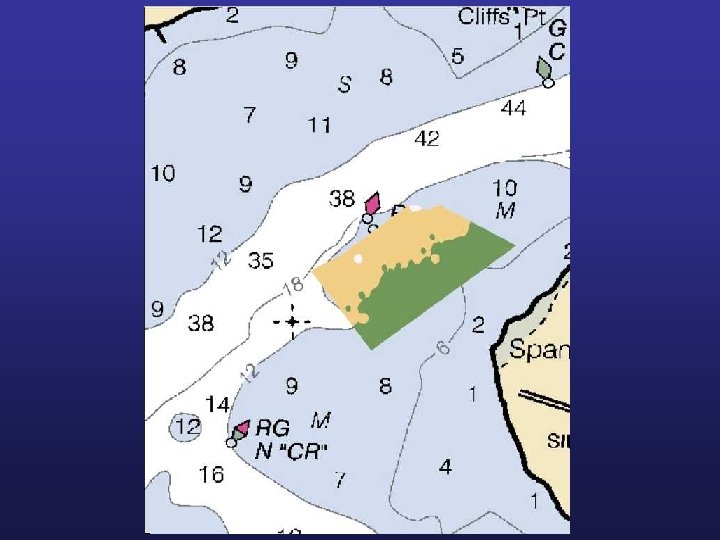
 Bar Cleaning • Important for oyster restoration in Maryland portion of the Chesapeake • Removal of as many existing oysters as feasible from an oyster bar
 Bar Cleaning • Allows for destructive sampling of an oyster bar • Three oyster bars were exhaustively dredged • Total number of bushels recovered was recorded

 Initial Population Estimates • Bar Cleaning data • Leslie and De. Lury Models Bar Cleaning Removal (bu) D initial population (bu) L initial population (bu) Spaniards Point 3077 3534 3298 Durdin 580 1742 675 Carpenter's Island 544 1279 799
 D initial population (bu) L") Results Oyster Bar Population Estimates Bar Cleaning Removal (bu) D initial population (bu) L initial population (bu) GIS initial population (bu) Spaniards Point 3077 3534 3298 358 Durdin 580 1742 675 98 Carpenter's Island 544 1279 799 24
Results Oyster Bar Population Estimates Bar Cleaning Removal (bu) D initial population (bu) L initial population (bu) GIS initial population (bu) Spaniards Point 3077 3534 3298 358 Durdin 580 1742 675 98 Carpenter's Island 544 1279 799 24
 By GIS initial population (bu) Linear Fit") Bivariate Fit of D initial population (bu) By GIS initial population (bu) Linear Fit D initial population (bu) = 1098. 8594 + 6. 788379 GIS initial population (bu) Summary of Fit RSquare 0. 999715 RSquare Adj 0. 999429 Root Mean Square Error 28. 45784 Mean of Response Observations (or Sum Wgts) 2185 3
Bivariate Fit of D initial population (bu) By GIS initial population (bu) Linear Fit D initial population (bu) = 1098. 8594 + 6. 788379 GIS initial population (bu) Summary of Fit RSquare 0. 999715 RSquare Adj 0. 999429 Root Mean Square Error 28. 45784 Mean of Response Observations (or Sum Wgts) 2185 3
 D initial population (bu) L") Results Oyster Bar Population Estimates Bar Cleaning Removal (bu) D initial population (bu) L initial population (bu) GIS initial population (bu) Spaniards Point 3077 3534 3298 358 Durdin 580 1742 675 98 Carpenter's Island 544 1279 799 24 Correlation Matrix D initial population L initial population (bu) bu) GIS initial population (bu) D initial population (bu) 1 0. 9719 0. 9999 L initial population (bu) - 1 0. 9678 GIS initial population (bu) - - 1
Results Oyster Bar Population Estimates Bar Cleaning Removal (bu) D initial population (bu) L initial population (bu) GIS initial population (bu) Spaniards Point 3077 3534 3298 358 Durdin 580 1742 675 98 Carpenter's Island 544 1279 799 24 Correlation Matrix D initial population L initial population (bu) bu) GIS initial population (bu) D initial population (bu) 1 0. 9719 0. 9999 L initial population (bu) - 1 0. 9678 GIS initial population (bu) - - 1
 • Determine the relationship between oyster") Future Direction • Need more data (oyster bars) • Determine the relationship between oyster bar population estimates - bar cleaning and patent tong sampling • Any suggestions are welcome
Future Direction • Need more data (oyster bars) • Determine the relationship between oyster bar population estimates - bar cleaning and patent tong sampling • Any suggestions are welcome
 Acknowledgments Maryland Waterman’s Assoc. Ø Larry Simns, Jeff Baker Oyster Recovery Partnership The Paynter Lab