

d97da4352739b67680dc6028dcea7eeb.ppt
- Количество слайдов: 39
 Prejudice and the Economics of Discrimination Kerwin Charles Jonathan Guryan University of Chicago and NBER March, 2008
 § Formulates taste") Introduction § Modern economic analysis of discrimination begins with Becker (1957) § Formulates taste for discrimination as an aversion to cross-racial contact § Shows how prejudice & racial distaste translate into discrimination in a competitive market § A few of Becker’s insights § Market tends to sort to minimize effect of tastes § Prejudiced have incentive to find firm with fewer blacks § Blacks have incentive to find less-prejudiced firm § Segregation important mediator and distinct from wage discrimination § Markets with more black workers should have lower black wages § Marginal, not average, discriminator determines wage difference § Left tail of prejudice distribution should matter § Not median or right tail
Introduction § Modern economic analysis of discrimination begins with Becker (1957) § Formulates taste for discrimination as an aversion to cross-racial contact § Shows how prejudice & racial distaste translate into discrimination in a competitive market § A few of Becker’s insights § Market tends to sort to minimize effect of tastes § Prejudiced have incentive to find firm with fewer blacks § Blacks have incentive to find less-prejudiced firm § Segregation important mediator and distinct from wage discrimination § Markets with more black workers should have lower black wages § Marginal, not average, discriminator determines wage difference § Left tail of prejudice distribution should matter § Not median or right tail
 An intriguing empirical facts
 Introduction § We perform empirical tests of main predictions of Becker’s model § Collect data on prejudice (racial preferences) from the GSS § To our knowledge, first test of Becker’s predictions about relationship between prejudice and wages gaps at the market level § Data remarkably consistent with predictions of the model § Black wages relatively lower in markets w/higher fraction black workforce § Black wages relatively lower in more prejudiced labor markets § Wage gaps related to the left tail of prejudice distribution (less prejudiced), not to median or right tail (more prejudiced) § Not simply that black wages lower in more prejudiced areas § Fact that gaps related to prejudice of 10 th but not 50 th or 90 th percentile prejudice argues strongly for mechanism described in Becker (1957) § Results robust to controls for skill differences, other possible biases
 Introduction § Before jumping to empirical work we want to think carefully about the economic model behind these relationships § We will review Becker (1957) § Lay out main testable predictions § Address the “long run” free-entry prediction of the model § Staple of textbook treatments of Becker (1957) § Others have introduced complexities, frictions to the model to show that prejudice can have persistent effect on wages § Black (1995), Goldberg (1982), Lang, Manove & Dickens (2000)
 The Employer Discrimination Model
 Equilibrium") (Short-Run) Equilibrium
(Short-Run) Equilibrium
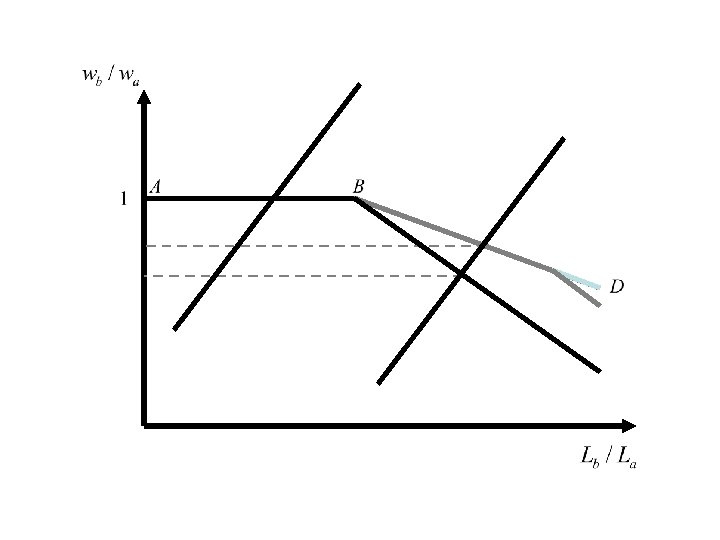
 Conventional Long Run Equilibrium
 Empirical implications 1. Since whether a person is an “employer” or “worker” is endogenous, relevant distribution of prejudice is among whites overall 2. Holding racial preferences in the market constant, increases in fraction of workforce that is black should lead to lower black wages 3. Because market induces sorting/segregation, left tail of prejudice distribution should matter for wage gaps § Median and right tail of racial preference distribution should not matter for wage gaps 4. If segregation is key, more integrated labor markets should have larger wage gaps
 § § Almost-annual survey of approx.") Empirical analysis: Data § General Social Survey (GSS) § § Almost-annual survey of approx. 1, 500 Battery of questions, we select subset of 26 on prejudice § Example questions: § § § Would you vote for an otherwise qualified black person for president? Do you support a law outlawing interracial marriage? How strongly would you object if a family member brought a black friend home for dinner? How would it make you feel if a close relative were planning to marry a black person? Would you object to sending your child to a school that had a few blacks/was half black/was mostly black? Not include government-related questions like: Do you think the government spends too much to help blacks? § May think government spends too much on everything.
Empirical analysis: Data § General Social Survey (GSS) § § Almost-annual survey of approx. 1, 500 Battery of questions, we select subset of 26 on prejudice § Example questions: § § § Would you vote for an otherwise qualified black person for president? Do you support a law outlawing interracial marriage? How strongly would you object if a family member brought a black friend home for dinner? How would it make you feel if a close relative were planning to marry a black person? Would you object to sending your child to a school that had a few blacks/was half black/was mostly black? Not include government-related questions like: Do you think the government spends too much to help blacks? § May think government spends too much on everything.
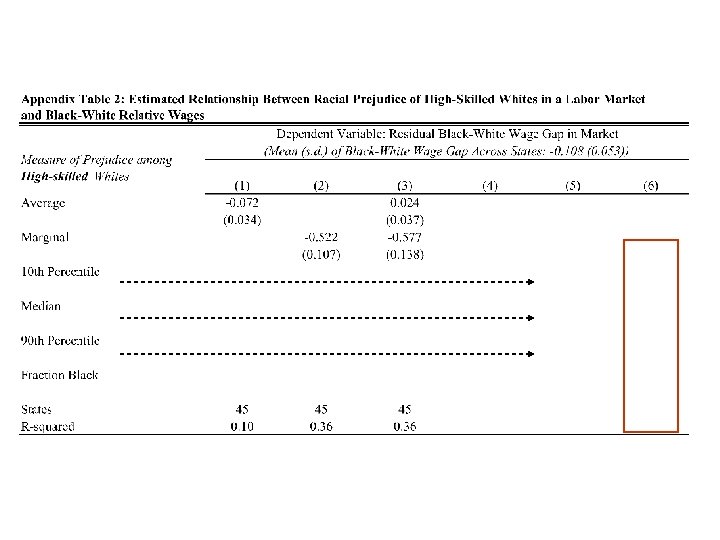
 Empirical analysis: Prejudice indices § We create indices of prejudice from these questions § § § State and Census-division-level indices § § All whites White high-skilled (education ≥ 16) Various measures § § § 45 states, 9 Census divisions For two subgroups § § § Normalize by mean in 1977 and standard deviation Take the observation-level sum Average Median 10 th percentile 90 th percentile Marginal: pth percentile of § (p = fraction black in state or Census division) § Suggested in Becker Using a subset of four questions asked together in 11 years, each of above also at region*year level and to compute the marginal, 10 th, 50 th, 90 th
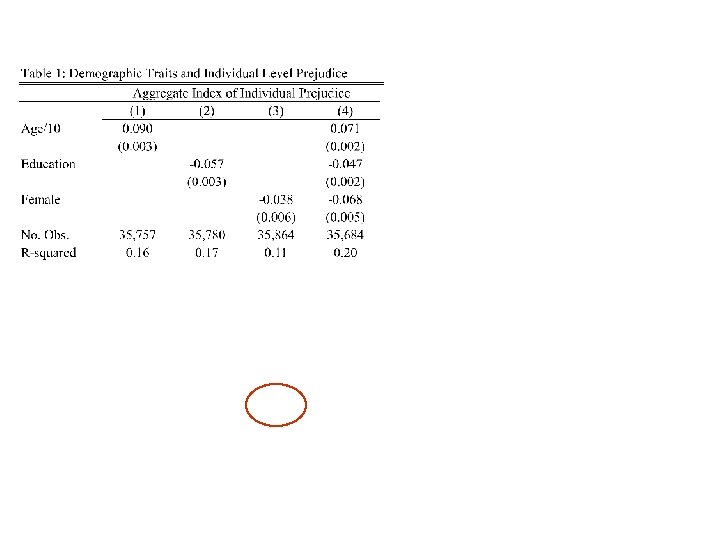
 Figure 1: Trends in responses to GSS prejudice questions
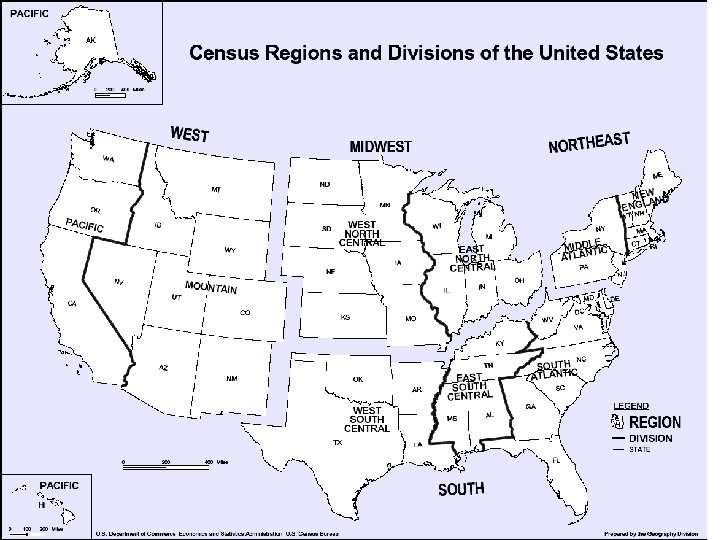
 Figure 2: Trends in prejudice by Census division
 CDF’s of Prejudice Across Census Divisions
 Quantitative Difference in Prejudice Across Regions § Big. § The median East South Central (MS, AL, TN, KY) White has the same level of prejudice as a white at the 81 st percentile of the New England prejudice distribution § Median New Englander has same level of prejudice as 26 th percentile White from East South Central § So you say, maybe it’s not really prejudice…Who says how racist they really are? § Well, differences by region in willingness to say things that might be thought racist just as striking.
 Figure 3: Plot of the regional B-W wage gap against a regional index of prejudice
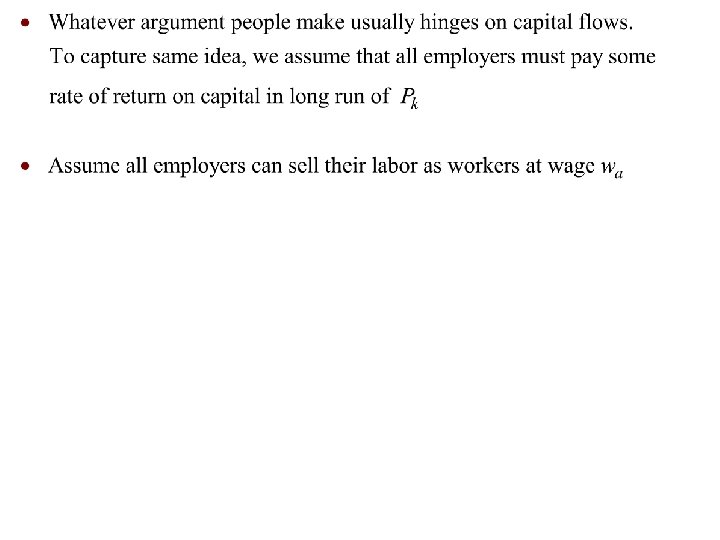
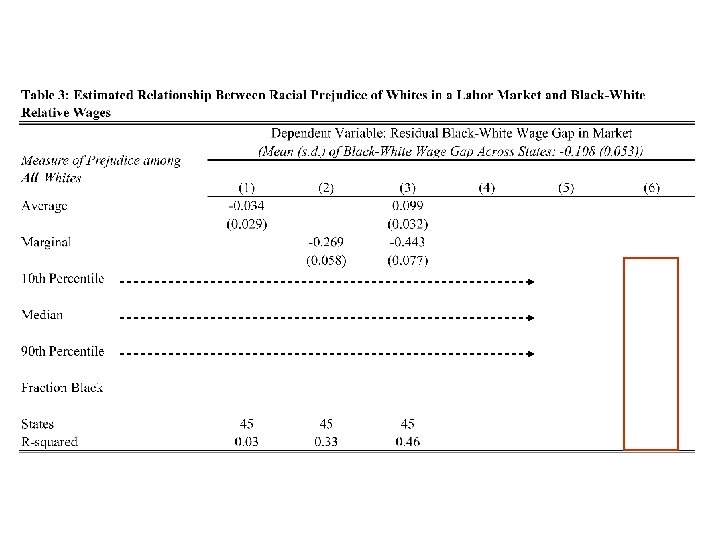
 Labor Market Prejudice and Wage Gaps § Merge Prejudice indices to Current Population Survey (CPS) § § Estimate Relationship Between Market Wages and Prejudice in Two Steps. § § 1973 -1978 May 1979 -2002 Merged Outgoing Rotation Group Compute hourly wage for full-time men, 16 -64 Estimate regression of log wages on education, quadratic in exp, race*year effects, black dummy for each state. Take estimated black dummies (there are 45 because some states not identified in GSS) and regress those on measures of prejudice. Weight by the precision of the wage-gap estimate. Why this way? § § § Alternative all in one step. Log wages on X, black dummy, and interaction between black dummy and prejudice measure. Since variation in prejudice all at state, standard errors may be too small. Turns out not to matter.
 Labor Market Prejudice and Wage Gaps § Assess whether equilibrium associations are consistent with predictions of prejudice model. § § Black wages lower in markets with more black workers Beyond averages: Left tail of prejudice distribution should matter; right tail should not Later, try to address most obvious alternative explanations. § § Black wages lower in more prejudiced markets. Prejudice correlated with unobserved skills Endogenous racial migration patterns Labor force participation Finally, directly investigate the role of workplace segregation, as implied by the model
 Two Specification Issues § Non-employment: Big Racial Differences in LFP. Wages for workers differentially reflect market wages black and white workers can command. § Firm Size Differences. Unprejudiced firms may be larger because of lower costs. Marginal would thus be smaller than pth percentile. § Similar reasoning if there are black entrepreneurs… “Unprejudiced” firms effectively larger.
 Robustness Check 1: Wage Gap Estimated by Median Regression (similar to Neal and Johnson, 1996). Log Wage for not-employed set to 0.
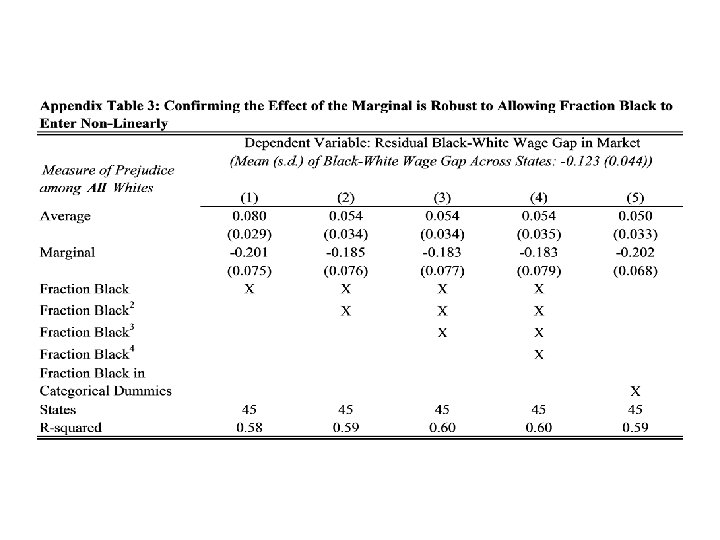
 Robustness Check 2: Marginal Computed as 0. 8 times pth percentile. [Katz/Murphy estimates of elasticity of substitution of -1. 5 between high and low skill workers, and black-white wage gap of about 0. 2 log pts, implies that if all of gap caused by prejudice, need 0. 77 of them relative to constant firm size case. ]
") Alternative Explanation § We argue that the results reflect equilibrium effect of (especially marginal) prejudice on racial wage gaps § Main Alternative stories: § Prejudiced places may be types of places where racial skill differences big for other reasons. § Places with large black populations may have low wages for some unmeasured reason. § Some of the action in our results driven by South/non-South comparisons. Who knows what’s going on in South? § Checks § For racial shares, use racial makeup from 1920 to construct marginal, and instrument for current fraction black with fraction from 1920. § Add measures of skill to models: NAEP reading and math scores. § Restrict analysis to Southern states. § Add controls for racial differences in school quality: student teacher ratios as in Card-Krueger school quality papers. § Restricted to Southern states.
Alternative Explanation § We argue that the results reflect equilibrium effect of (especially marginal) prejudice on racial wage gaps § Main Alternative stories: § Prejudiced places may be types of places where racial skill differences big for other reasons. § Places with large black populations may have low wages for some unmeasured reason. § Some of the action in our results driven by South/non-South comparisons. Who knows what’s going on in South? § Checks § For racial shares, use racial makeup from 1920 to construct marginal, and instrument for current fraction black with fraction from 1920. § Add measures of skill to models: NAEP reading and math scores. § Restrict analysis to Southern states. § Add controls for racial differences in school quality: student teacher ratios as in Card-Krueger school quality papers. § Restricted to Southern states.
 Possible correlation of skill differences with Fraction Black or Prejudice: - Instruments: 1920 % black, marginal computed with 1920 % black. Possible that Current Skills gaps related to number of Blacks long ago? Possible.
 Possible correlation of skill differences with Fraction Black or Prejudice: - Controlling for racial differences in NAEP scores
 Possible correlation of skill differences with Fraction Black or Prejudice: - Restrict analysis to Southern states.
 Possible correlation of skill differences with Fraction Black or Prejudice: - Control for school quality differences in Southern states.
 Effect of measured workplace segregation:
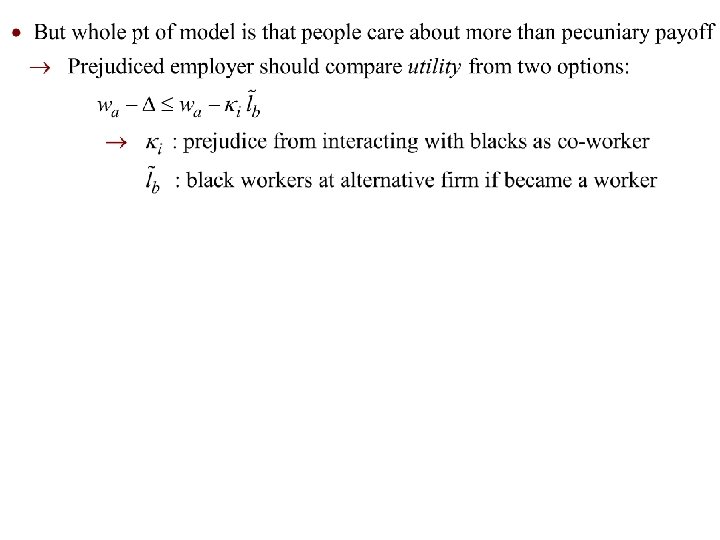
 Summary: Theory § Traditional conclusion that competition will drive discriminating employers out of business rests partially on assumption of role-dependent preferences § § Assumes discriminators become color-blind with respect to their co-workers Outside option of prejudiced employer important § Relaxing this assumption leads to a model like Becker’s of employee discrimination § Impediments to segregation may lead to a persistent wage gap caused by discriminatory tastes
 Summary: Empirical § We show patterns of prejudice using the GSS § South appears more prejudiced, Northeast and West less so § Black-white wage gap is § § § Largest in most prejudiced regions of the US Largest in areas with more black workers Related to variation in left tail of prejudice distribution (i. e. 10 th percentile) Not related to median or right tail (i. e. 90 th percentile) conditional on 10 th Related to the prejudice of the “marginal” discriminator, as defined in Becker (1957) Larger in more areas where workplace is more integrated § Survives alternative specifications, robustness tests. § Overall, data are remarkably consistent with the predictions of Becker (1957)
 Ongoing work § Here we have assumed role independent preferences § An alternative is that prejudiced care more about the race of those at or above them in hierarchy § § Firms have incentive to create gaps in hierarchy (“Glass Ceiling”) Implications for how firms/industries integrate – not smoothly § Do things look similar for gender preferences? § Where does prejudice come from? § Puzzle? : Relative Black wages in the South appear to have converged to North. Not clear if racial preferences have converged on average or not. § § Blacks appear to be moving back to the South. 10 th / 25 th percentiles of prejudice may have converged
 Trends in 10 th/25 th percentiles of prejudice by region