4eaeec6cd13425153786f61087a862df.ppt
- Количество слайдов: 77
Practical Malware Analysis Ch 9: Olly. Dbg Last modified 10 -20 -14
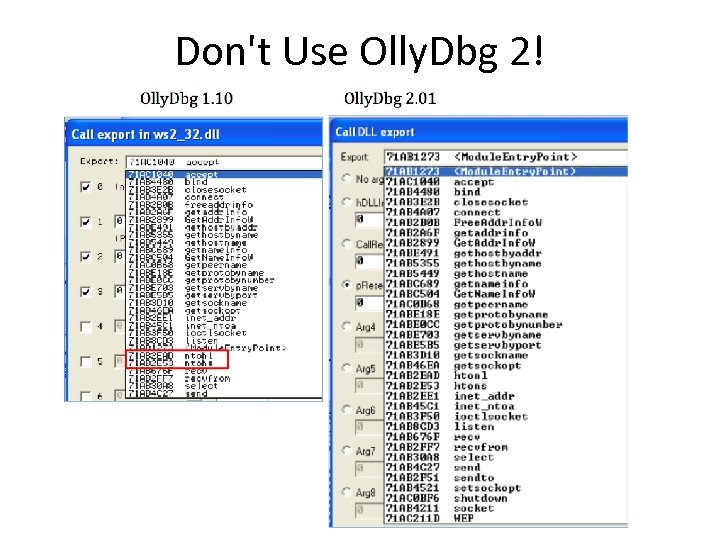
History • Olly. Dbg was developed more than a decade ago • First used to crack software and to develop exploits • The Olly. Dbg 1. 1 source code was purchased by Immunity and rebranded as Immunity Debugger • The two products are very similar

Don't Use Olly. Dbg 2!
Loading Malware
Ways to Debug Malware • You can load EXEs or DLLs directly into Olly. Dbg • If the malware is already running, you can attach Olly. Dbg to the running process

Opening an EXE • File, Open • Add command-line arguments if needed • Olly. Dbg will stop at the entry point, Win. Main, if it can be determined • Otherwise it will break at the entry point defined in the PE Header – Configurable in Options, Debugging Options
Attaching to a Running Process • File, Attach • Olly. Dbg breaks in and pauses the program and all threads – If you catch it in DLL, set a breakpoint on access to the entire code section to get to the interesting code
Reloading a File • Ctrl+F 2 reloads the current executable • F 2 sets a breakpoint

The Olly. Dbg Interface
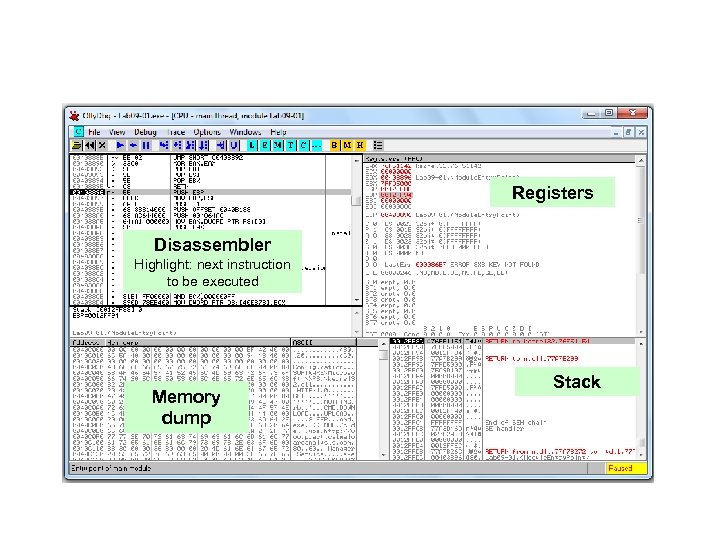
Registers Disassembler Highlight: next instruction to be executed Memory dump Stack
Modifying Data • Disassembler window – Press spacebar • Registers or Stack – Right-click, modify • Memory dump – Right-click, Binary, Edit – Ctrl+G to go to a memory location – Right-click a memory address in another pane and click "Follow in dump"

Memory Map View, Memory Map
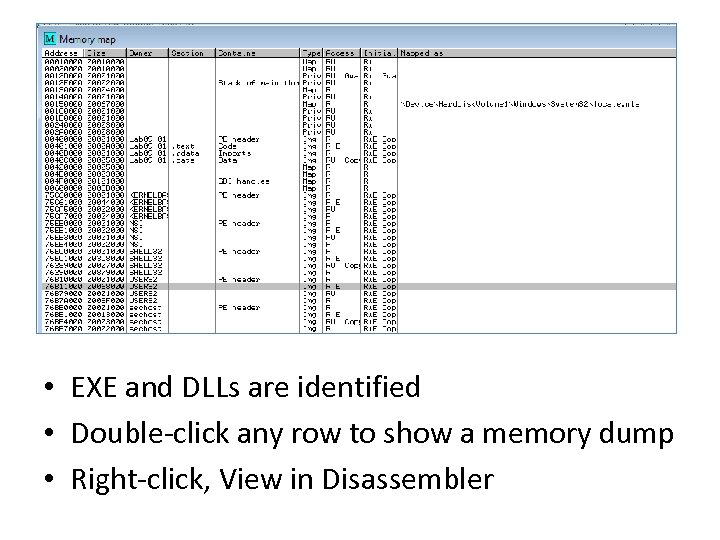
• EXE and DLLs are identified • Double-click any row to show a memory dump • Right-click, View in Disassembler
Rebasing • Rebasing occurs when a module is not loaded at its preferred base address • PE files have a preferred base address – The image base in the PE header – Usually the file is loaded at that address – Most EXEs are designed to be loaded at 0 x 00400000 • EXEs that support Address Space Layout Randomization (ASLR) will often be relocated
DLL Rebasing • DLLs are more commonly relocated – Because a single application may import many DLLs – Windows DLLs have different base addresses to avoid this – Third-party DLLs often have the same preferred base address
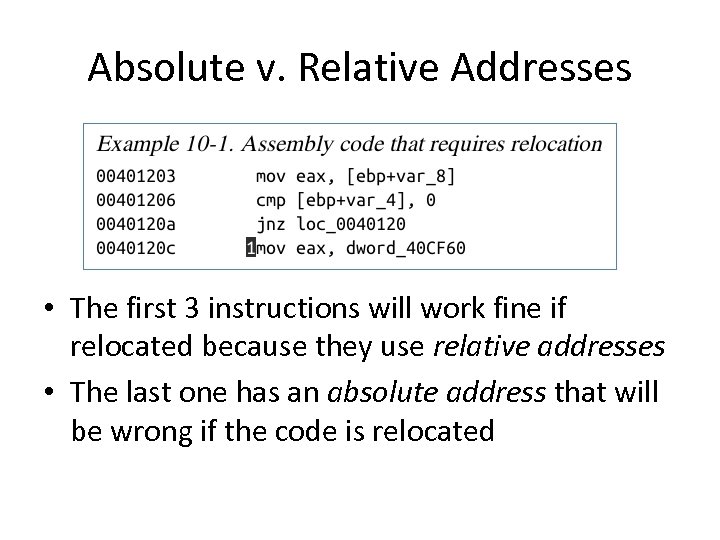
Absolute v. Relative Addresses • The first 3 instructions will work fine if relocated because they use relative addresses • The last one has an absolute address that will be wrong if the code is relocated
Fix-up Locations • Most DLLS have a list of fix-up locations in the. reloc section of the PE header – These are instructions that must be changed when code is relocated • DLLs are loaded after the EXE and in any order • You cannot predict where DLLs will be located in memory if they are rebased
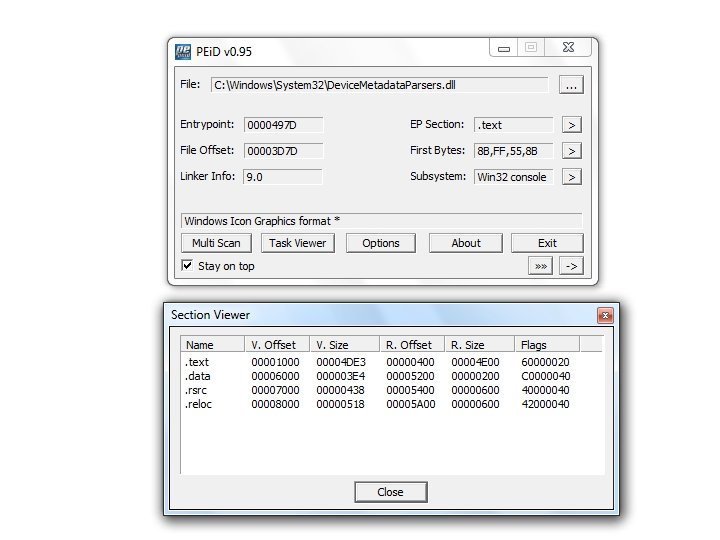
DLL Rebasing • DLLS can have their. reloc removed – Such a DLL cannot be relocated – Must load at its preferred base address • Relocating DLLs is bad for performance – Adds to load time – So good programmers specify non-default base addresses when compiling DLLs
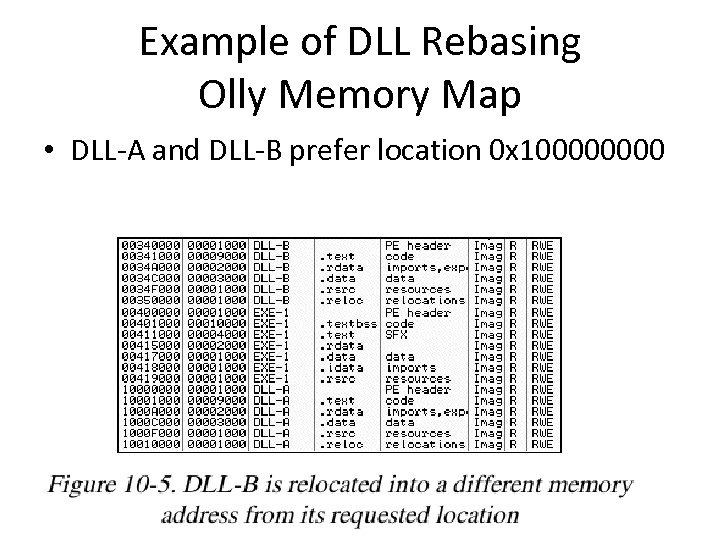
Example of DLL Rebasing Olly Memory Map • DLL-A and DLL-B prefer location 0 x 10000
IDA Pro • IDA Pro is not attached to a real running process • It doesn't know about rebasing • If you use Olly. Dbg and IDA Pro at the same time, you may get different results – To avoid this, use the "Manual Load" option in IDA Pro – Specify the virtual base address manually
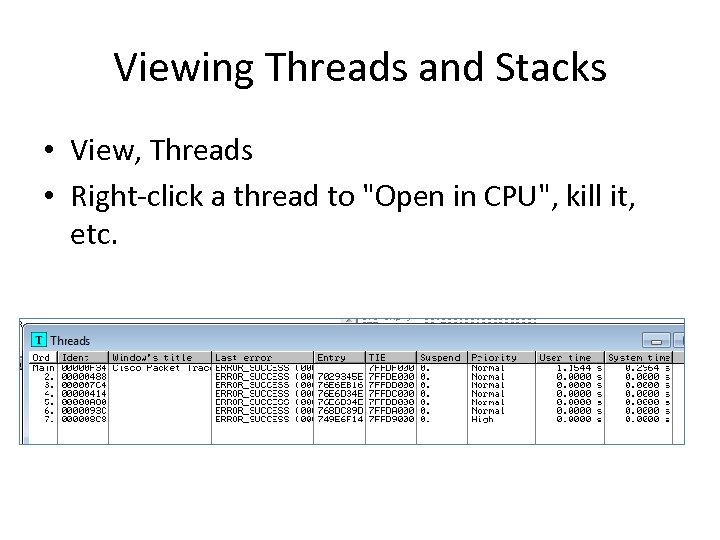
Viewing Threads and Stacks • View, Threads • Right-click a thread to "Open in CPU", kill it, etc.
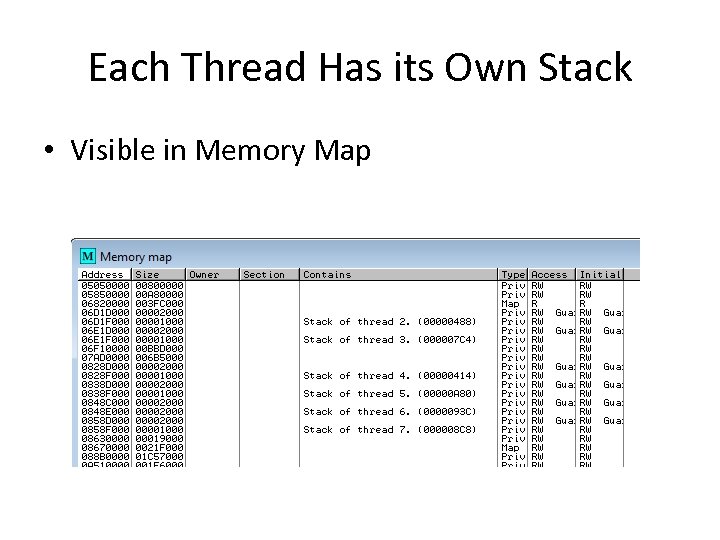
Each Thread Has its Own Stack • Visible in Memory Map

Executing Code
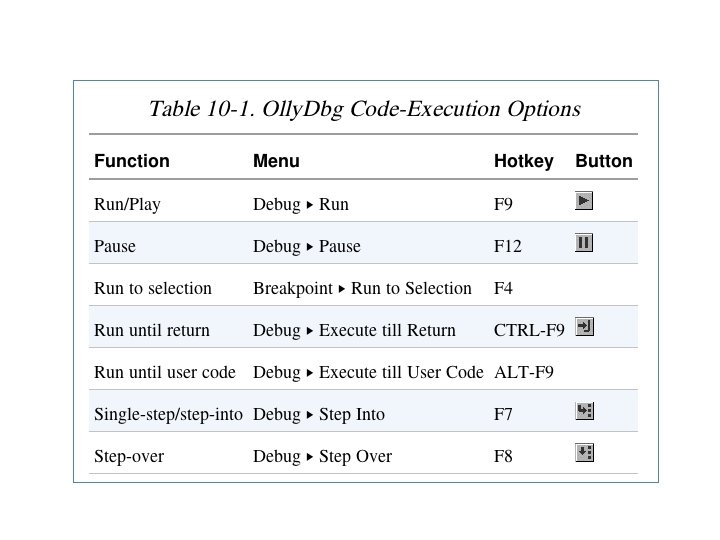
Run and Pause • You could Run a program and click Pause when it's where you want it to be • But that's sloppy and might leave you somewhere uninteresting, such as inside library code • Setting breakpoints is much better
Run and Run to Selection • Run is useful to resume execution after hitting a breakpoint • Run to Selection will execute until just before the selected instruction is executed – If the selection is never executed, it will run indefinitely
Execute till Return • Pauses execution until just before the current function is set to return • Can be useful if you want to finish the current function and stop • But if the function never ends, the program will continue to run indefinitely
Execute till User Code • Useful if you get lost in library code during debugging • Program will continue to run until it hit compiled malware code – Typically the. text section
Stepping Through Code • F 7 -- Single-step (also called step-into) • F 8 -- Step-over – Stepping-over means all the code is executed, but you don't see it happen • Some malware is designed to fool you, by calling routines and never returning, so stepping over will miss the most important part

Breakpoints
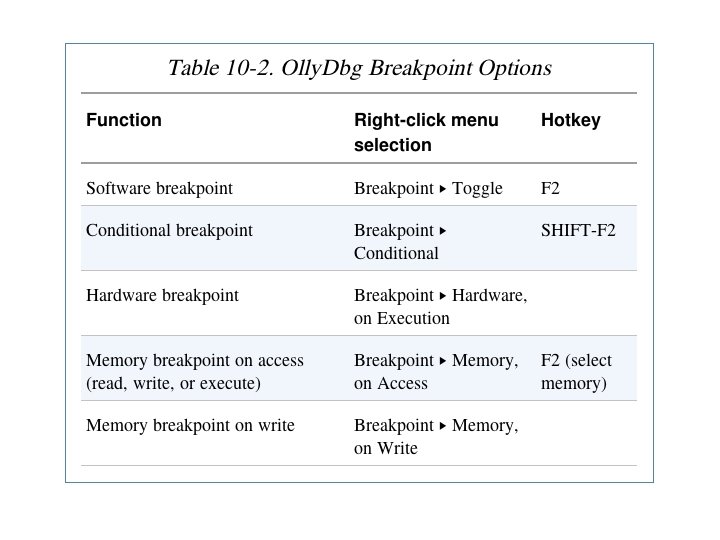
Types of Breakpoints • • Software breakpoints Hardware breakpoints Conditional breakpoints Breakpoints on memory • F 2 – Add or remove a breakpoint
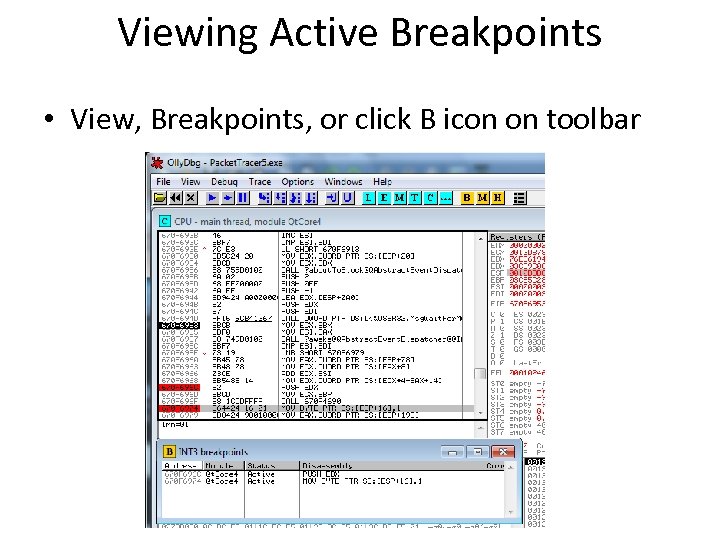
Viewing Active Breakpoints • View, Breakpoints, or click B icon on toolbar
Saving Breakpoints • When you close Olly. Dbg, it saves your breakpoints • If you open the same file again, the breakpoints are still available
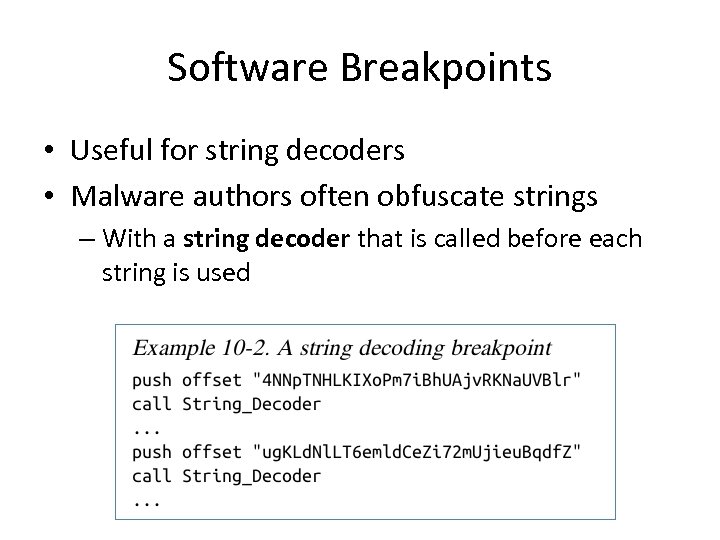
Software Breakpoints • Useful for string decoders • Malware authors often obfuscate strings – With a string decoder that is called before each string is used

String Decoders • Put a breakpoint at the end of the decoder routine • The string becomes readable on the stack Each time you press Play in Olly. Dbg, the program will execute and will break when a string is decoded for use • This method will only reveal strings as they are used

Conditional Breakpoints • Breaks only when a condition is true • Ex: Poison Ivy backdoor – Poison Ivy allocates memory to house the shellcode it receives from Command Control (C&C) servers – Most memory allocations are for other purposes and uninteresting – Set a conditional breakpoint at the Virtual. Alloc function in Kernel 32. dll
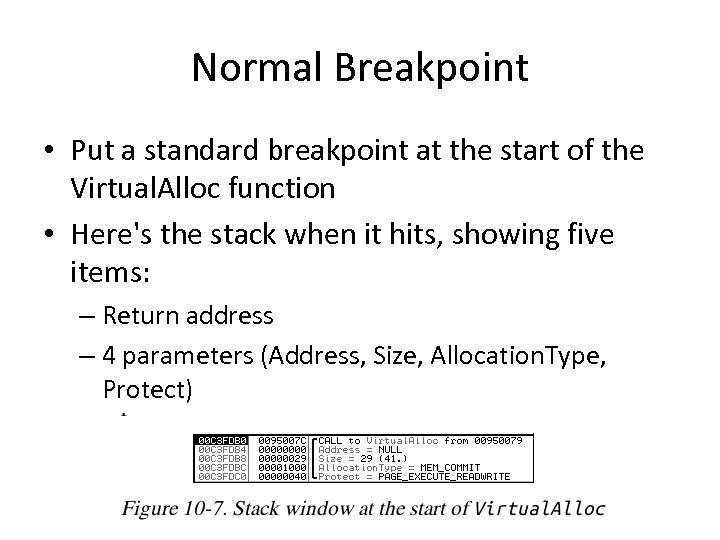
Normal Breakpoint • Put a standard breakpoint at the start of the Virtual. Alloc function • Here's the stack when it hits, showing five items: – Return address – 4 parameters (Address, Size, Allocation. Type, Protect)
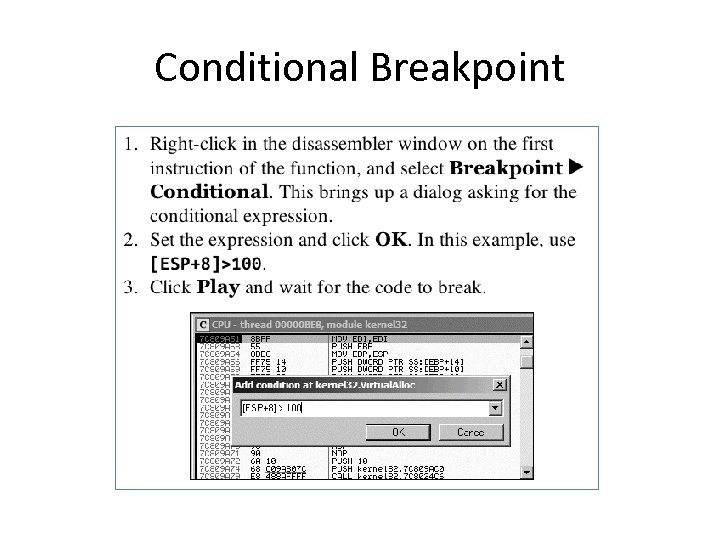
Conditional Breakpoint
Hardware Breakpints • • • Don't alter code, stack, or any target resource Don't slow down execution But you can only set 4 at a time Click Breakpoint, "Hardware, on Execution" You can set Olly. Dbg to use hardware breakpoints by default in Debugging Options – Useful if malware uses anti-debugging techniques
Memory Breakpoints • Code breaks on access to specified memory location • Olly. Dbg supports software and hardware memory breakpoints • Can break on read, write, execute, or any access • Right-click memory location, click Breakpoint, "Memory, on Access"

Memory Breakpoints • You can only set one memory breakpoint at a time • Olly. Dbg implements memory breakpoints by changing the attributes of memory blocks • This technique is not reliable and has considerable overhead • Use memory breakpoints sparingly
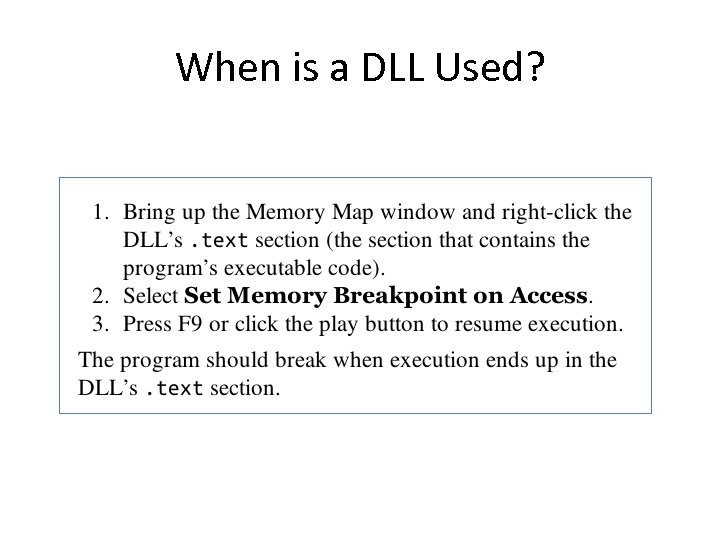
When is a DLL Used?
Loading DLLs
loaddll. exe • DLLs cannot be executed directly • Olly. Dbg uses a dummy loaddll. exe program to load them • Breaks at the DLL entry point DLLMain once the DLL is loaded • Press Play to run DLLMain and initialize the DLL for use
Demo • Get Olly. Dbg 1. 10, NOT 2. 00 or 2. 01 – Link Ch 9 a • Use Win XP or Win 7 • In Olly. Dbg, open c: windowssystem 32ws 2_32. dll • Debug, Call DLL Export – it fails • Reload the DLL, click Run button once • Debug, Call DLL Export – now it works
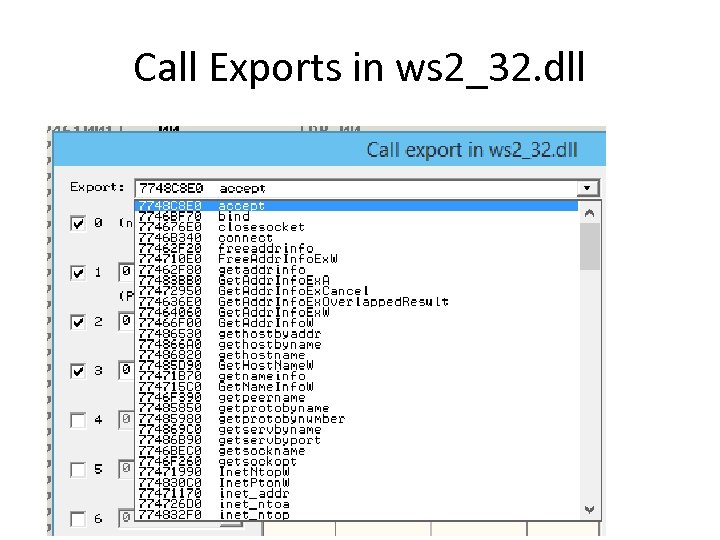
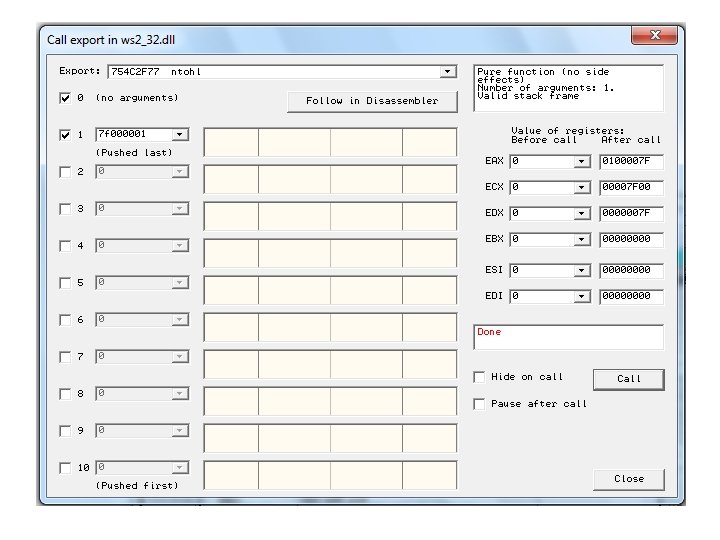
Call Exports in ws 2_32. dll
ntohl • Converts a 32 -bit number from network to host byte order • Click argument 1, type in 7 f 000001 – 127. 0. 0. 1 in "network" byte order • Click "Follow in Disassembler" to see the code • Click "Call" to run the function • Answer in EAX
Don't Use Olly. Dbg 2!

Tracing
Tracing • Powerful debugging technique • Records detailed execution information • Types of Tracing – Standard Back Trace – Call Stack Trace – Run Trace
Standard Back Trace • You move through the disassembler with the Step Into and Step Over buttons • Olly. Dbg is recording your movement • Use minus key on keyboard to see previous instructions – But you won't see previous register values • Plus key takes you forward – If you used Step Over, you cannot go back and decide to step into
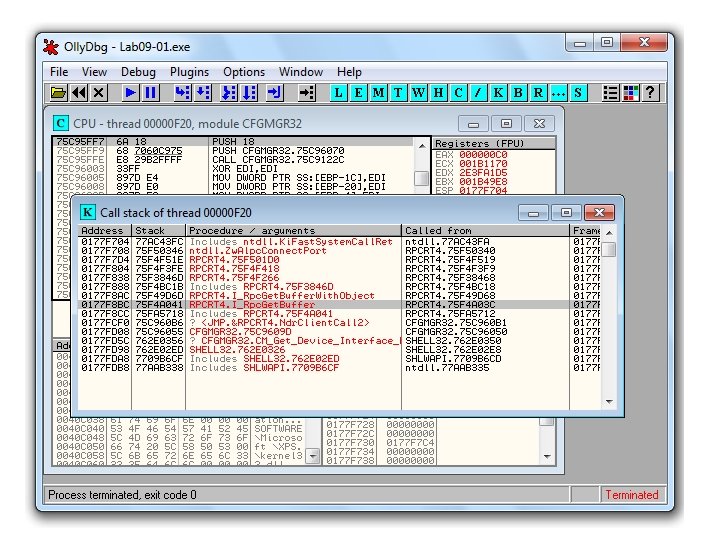
Call Stack Trace • Views the execution path to a given function • Click View, Call Stack • Displays the sequence of calls to reach your current location
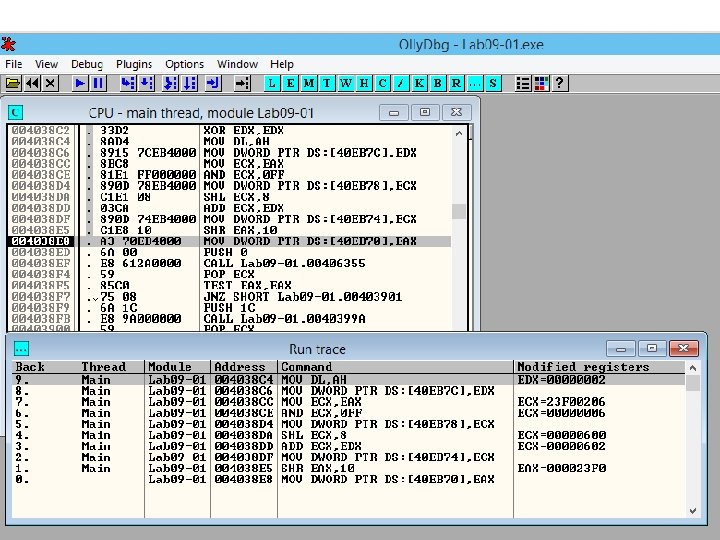
Run Trace • Code runs, and Olly. Dbg saves every executed instruction and all changes to registers and flags • Highlight code, right-click, Run Trace, Add Selection • After code executes, View, Run Trace – To see instructions that were executed – + and - keys to step forward and backwards
Trace Into and Trace Over • Buttons below "Options" • Easier to use than Add Selection • If you don't set breakpoints, Olly. Dbg will attempt to trace the entire program, which could take a long time and a lot of memory
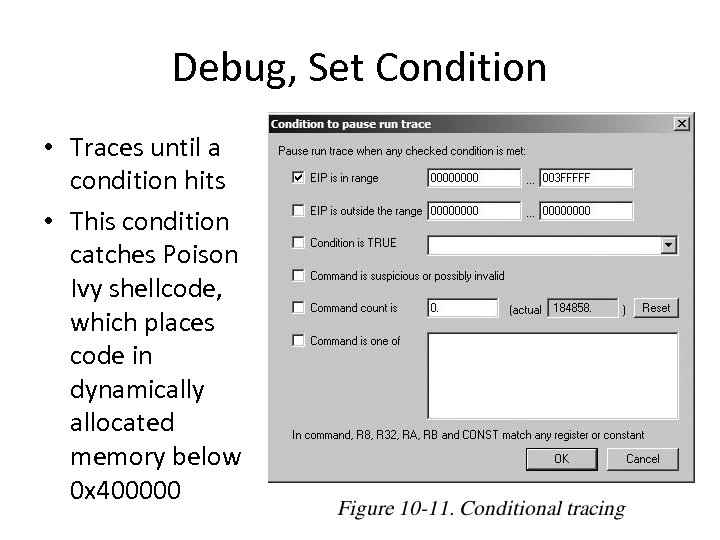
Debug, Set Condition • Traces until a condition hits • This condition catches Poison Ivy shellcode, which places code in dynamically allocated memory below 0 x 400000

Exception Handling
When an Exception Occurs • Olly. Dbg will stop the program • You have these options to pass the exception into the program: – Shift+F 7 Step into exception – Shift+F 8: Step over exception – Shift+F 9: Run exception handler • Often you just ignore all exceptions in malware analysis – We aren't trying to fix problems in code

Patching
Binary Edit
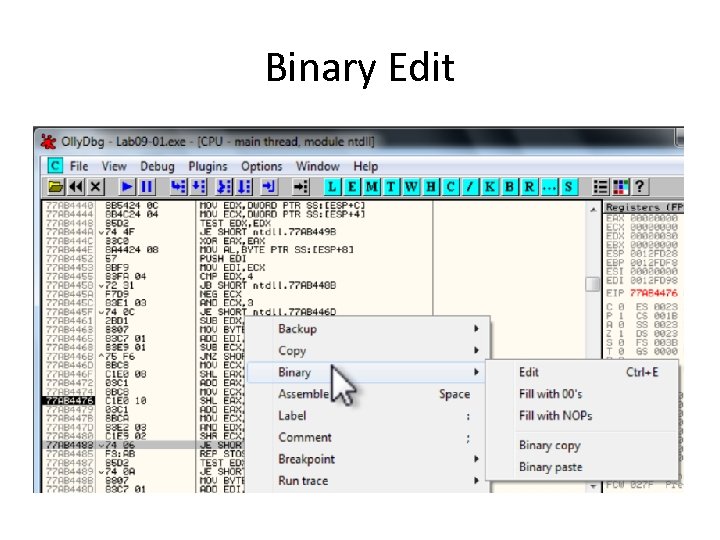
Fill • Fill with 00 • Fill with NOP (0 x 90) – Used to skip instructions – e. g. to force a branch
Saving Patched Code • Right-click disassembler window after patching – Copy To Executable, All Modifications, Save File – Copy All • Right-click in new window – Save File

Analyzing Shellcode Undocumented technique
Easy Way to Analyze Shellcode • Copy shellcode from a hex editor to clipboard • Within memory map, select a region of type "Priv" (Private memory) • Double-click rows in memory map to show a hex dump – Find a region of hundreds of consecutive zeroes • Right-click chosen region in Memory Map, Set Access, Full Access (to clear NX bit)

Analyzing Shellcode • Highlight a region of zeroes, Binary Paste • Set EIP to location of shellcode – Right-click first instruction, New Origin Here

Assistance Features
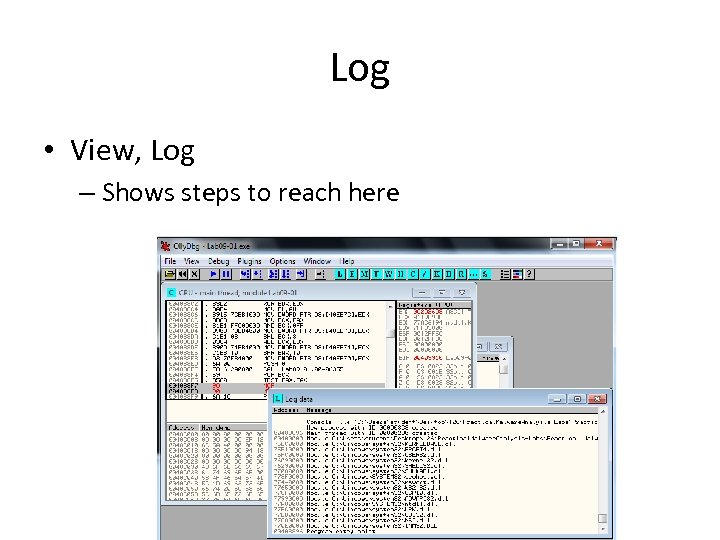
Log • View, Log – Shows steps to reach here
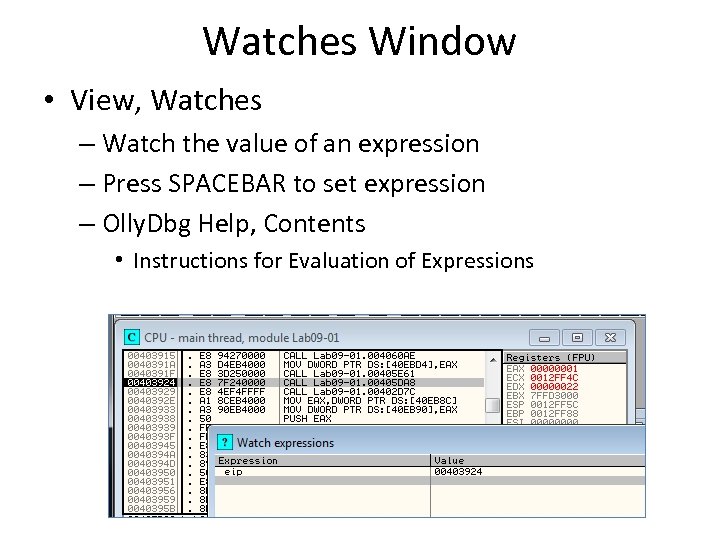
Watches Window • View, Watches – Watch the value of an expression – Press SPACEBAR to set expression – Olly. Dbg Help, Contents • Instructions for Evaluation of Expressions
Labeling • Label subroutines and loops – Right-click an address, Label

Plug-ins

Recommended Plugins • Olly. Dump – Dumps debugged process to a PE file – Used for unpacking • Hide Debugger – Hides Olly. Dbg from debugger detection • Command Line – Control Olly. Dbg from the command line – Simpler to just use Win. Dbg • Bookmarks – Included by default in Olly. Dbg – Bookmarks memory locations
Scriptable Debugging
Immunity Debugger (Imm. Dbg) • Unlike Olly. Dbg, Imm. Dbg employs python scripts and pas an easy-to-use API • Scripts are located in the Py. Commands subdirectory under the install directory of Imm. Dbg • Easy to create custom scripts for Imm. Dbg
4eaeec6cd13425153786f61087a862df.ppt