c37fa8200def0bd8d2d011a061d2a329.ppt
- Количество слайдов: 24


POTENTIAL OF RENEWABLE ENERGY RESOURCES IN TURKEY An Assessment of the Present Situation Baha KUBAN-Eurosolar Turkey AGRENER 2006 6 -8 June 2006 Campinas Brazil

TURKISH ENERGY PANORAMA 1984 – Public monopoly ended 1993 – Public utility divided into three; production, distribution and sales 1994 – Build, Operate, Transfer (BOT), Build, Operate(BO) laws enacted 1996 – International arbitration in the energy sector 2001 – Electricity Regulation Board (EPDK) 2005 numbers Installed power Production Consumption 38, 902 MW 176 billion k. Wh (capacity 213 b k. Wh) 160 billion k. Wh Public Private 2001 70 % 30 % 2002 59 % 41 % 2005 40 % 60 %
 Electrical Energy (k. Wh/person)")
Energy consumption is comparatively low Country Commercial Energy (kgpe/person) Electrical Energy (k. Wh/person) Canada 7730 16349 USA 8110 13388 Japan 4030 8008 France 4340 7175 Germany 4200 6482 Italy 2950 4949 Spain 2860 4576 Greece 2570 4261 Bulgaria 2420 3932 Turkey 1170 1797 China 840 895 India 490 416 World 1640 2252

population growth rate estimates are relatively high urbanization rates very high 1999 Population Rate (%) 2000 2005 2010 2022 64. 4 65. 3 69. 8 74. 1 83. 4 1. 5 1. 4 1. 3 1. 2 1. 0 forecasted GNP growth rates are relatively high 1999 Rate of increase of GNP 2000 2005 2010 2022 -6. 4 4. 6 6. 7 7. 7 6. 8 very high rate of increase of annual energy demand; ~8 -9 %
 Primary Resources Production(billion k.")
Distribution of consumed energy to primary resources TEAŞ (PUBLIC UTILITY) Primary Resources Production(billion k. Wh) % NATIONAL TOTAL Production % 1. 4 2. 5 9. 3 7. 0 Diesel Non-Hydro Fuel Oil 0. 2 0. 3 0. 2 Coal 1. 9 3. 6 3. 1 2. 4 1. 1 0. 8 Imported Coal Lignite 17. 3 32. 1 30. 9 23. 4 Natural Gas 16. 7 31. 1 62. 7 47. 3 LPG 0. 4 0. 3 Nafta 1. 8 1. 3 Geothermal Total Non-Hydro Wind 0. 1 0. 2 0. 1 37. 6 69. 8 110. 6 83. 5 16. 3 30. 2 21. 9 16. 5 0. 1

INCREASED DEPENDENCE ON NATURAL GAS First natural gas supply agreement, 1987 – Soviet Union 513 million m 3 14. 2 billion m 3 in 13 years 27 times increase ! Supply Agreements Amount (billion m 3/year) date duration (years) Russian Federation 6 1987 25 Algeria 4 1988 20 Nigeria 1. 2 1995 22 Iran 10 1996 25 Russian Federation 16 1997 25 Russian Federation 8 1998 23 Turkmenistan 16 1999 30 Azerbaycan 6. 6 2001 15

Natural gas supply agreements and the explosion of NGCC power plants • 100 % buy-back guarantee • Unit price guarantee per k. Wh • Public utility capacity utilization, 50 % in 2002, 30 % in 2003 • Another 6, 000 -10, 000 MW licences given for 2003 -2005 • %100 buy-back k. Wh price 6 c/k. Wh and higher (this compared to 2 c/k. Wh public hydro, 3 c/k. Wh public thermic THUS; 2 billion US$ transferred to private utilities in 2002, 4. 7 billion US$ transferred by the end of 2003 Dependence on foreign fossil fuel imports~ 15 billion US$/year
 Public 93 10085 34239")
RENEWABLES POTENTIAL LARGE HYDRO-ELECTRIC power plants MW annual output (GWh) Public 93 10085 34239 Private 21 726 2905 Public 29 2668 8470 Private 8 1388 4898 262 10268 40420 Operating Under Construction Planned Public

LARGE HYDRO Contribution to total Operating Under Construction Planned 30% 41% 67% In Europe, hydro-electric potential in Turkey 2 nd best after Norway Theoretical potential Technically feasible Economically feasible 433, 000 GWh/year 216, 000 GWh/year 123, 000 GWh/year

SMALL HYDRO-ELECTRIC POTENTIAL . UNIDO definition, small Hydro: < 10 MW. Contribution of small hydro to total today ~% 0. 04. Black Sea coast particularly suitable. Readily available small hydro potential: ~4000 MW. 18% of total MWs, 30% of hydro power today

WIND Turkey is calculated to have the highest wind energy potential in Europe. . . Country Area Wind class>3 (1000 km 2) Regional potential Technical Potential GW TWh/year (km 2) Turkey 781 418 9. 960 83 166 Austria 84 40 200 2 3 Belgium 31 7 280 2 5 Denmark 43 43 1720 14 29 France 547 216 5, 080 42 85 Germany 357 39 1. 400 12 24 UK 244 171 6. 840 57 114 Greece 132 73 2. 640 22 44 Italy 301 194 4. 160 35 69 Spain 505 200 5. 160 43 86 Norway 324 217 4. 560 38 76
 at 50 m Western Turkey Wind Resources")
Wind Power Density (watts per square meter) at 50 m Western Turkey Wind Resources

Contribution to national electricity production is almost zero presently! Country Installed Capacity (MW, 2002 1 st half) Growth rate (%) Germany 9841 12. 4 USA 4272 0. 3 Spain 3737 12. 0 Denmark 2571 1. 5 India 1628 8. 0 Italy 730 7. 0 Holland 532 9. 9 UK 499 5. 3 China 408 0. 9 Japan 351 11. 1 Greece 311 4. 3 France 128 10. 4 Turkey 19 0. 0
 Mainly supporting Wind and Hydro, Situation after")
BUT ! New Renewable Electricity Law (2005) Mainly supporting Wind and Hydro, Situation after Legislation, June 2006 Construction (Due to finish beginning of 2007) 1400 MW (38 projects) Approved 40 MW Applied 3700 MW (121 projects)

PHOTOVOLTAIC POTENTIAL “ Photovoltaics in 2010 ”, EU 1996. Data from 1990 Rooftop area available for solar electricity in Turkey: 378 km 2 (homes, offices, public buildings and factories). PV capacity (Wp)= Area (m 2)x standard irradiance(W/m 2)x. Efficiency* PV electricity generation (MWh/year)=PV Capacity(MWp)x. Irradiation(k. Wh/m 2. year)x. Efficiency** Efficiencies: Module* %12. 5, System** (BOS) %70 Standard Irradiance: 1000 W/m 2, Turkey 1700 k. Wh/m 2. year RESULT : PV power PV electricity generation Total consumption(1990) Contribution 47. 204 MWp 56. 173. 035 MWs/year 55. 906. 000 MWs/yıl % 100. 5 TODAY, PV ELECTRICITY PRODUCTION IN TURKEY IS LIMITED TO OFF-GRID TELECOMS, FORESTRY, HIGHWAYS AND MILITARY APPLICATIONS, IN TOTAL ~1 MW.

Solar Thermal Avarage suntime 2700 h/year Solar thermal potential ~90 million tpe (today total consumption ~35 million tpe) Solar collector market Ø >200 manufacturers Ø 25 % increase/year Ø 55 % installed in the Meditteranean region Ø 2001 sales 600. 000 m 2 Ø Total collector area > 5 million m 2 (7 million? ) Ø 2005 estimate (conservative) ~10 million m 2

Geothermal • With 1000 discovered fields, one of the best potentials for geothermal energy. 170 fields > 35 o, several > 170 o • Estimated to be ~31. 500 MWt (5 million homes, About 30% of total) Present state: • Direct heating: 970 MWt, Electricity: 20 MWe (Denizli) • 2010 estimate: 3500 MWt, 500 MWe • 2020 estimate: 8300 MWt, 1000 MWe

BIO - FUELS Traditional Biomass ~ 1/3 of all domestic heating consumption December 2003 - Petroleum Market Law 2% Bio-fuel in diesel 144 bio-diesel firms production 1. 5 million tons 3 billion US$ sector Bio-gas potential 2. 8 -3. 9 billion m 3 21. 5 MW electricity from municipal waste plants being constructed

Large potential for Energy Efficiency • ~ 30% of present consumption • Avarage Turkish building consumes x 3 energy compared to German bldg. Misplaced transportation policy ! dependence on road transport Losses in Transmission and Distribution EU Avarege ~ 20 % ~ 10 %

20 YEARS BALANCE SHEET OF POLICY IN THE ENERGY SECTOR Expressed aims of energy sector privatization and de-regulation imposed by the IMF-WB; No alternative, due to empty public coffers indebted state Cheaper electricity Technological upgrading Break-up of public monopoly !
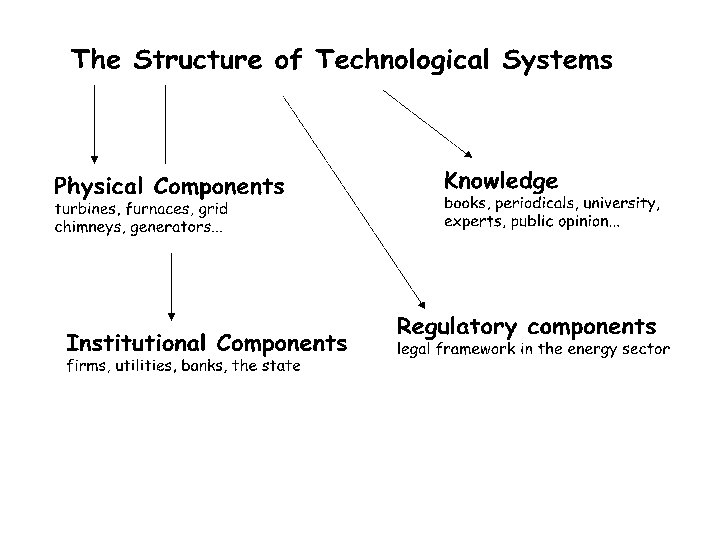

Typologies of Industrial Innovation conservative innovation ; “. . . those innovations that improve and deepen the present system ” radical innovation ; “. . . those innovations that challenge the present system components, both institutional and technical ones, require a new set of technical, social and cultural reference points "

energy system today distributed energy system Assets Expensive power plants Small, modular and grid system Distribution Grid system Production where needed Capabilities Large, complex systems engineering, management and regulation Production engineering, producty development, R&D, marketing Control paradigm Large firm Consumer Finance > 50 million $, cutthroat competition, very profitable Consumer credit, <25, 000 $ Learning opportunities < 1 power plant/year (# product/year) > 1000 products/year
c37fa8200def0bd8d2d011a061d2a329.ppt