

f06bcb7c56884b0a0c3733854a33ffbb.ppt
- Количество слайдов: 52
 Population Movement, Quarantine and Isolation: Pieces of the Pandemic Influenza Puzzle Peter Houck, M. D. Medical Officer, Seattle Quarantine Station Division of Global Migration and Quarantine National Center for Infectious Diseases Centers for Disease Control and Prevention August 24, 2006
 Population Movement Main Points • • Permanent intercontinental migration increasing Cross-border movement increasing Speed and range of movement increasing Any point on earth is within relatively few hours of anywhere else • Implications for spread and control of disease
 SAFER • HEALTHIER • PEOPLE
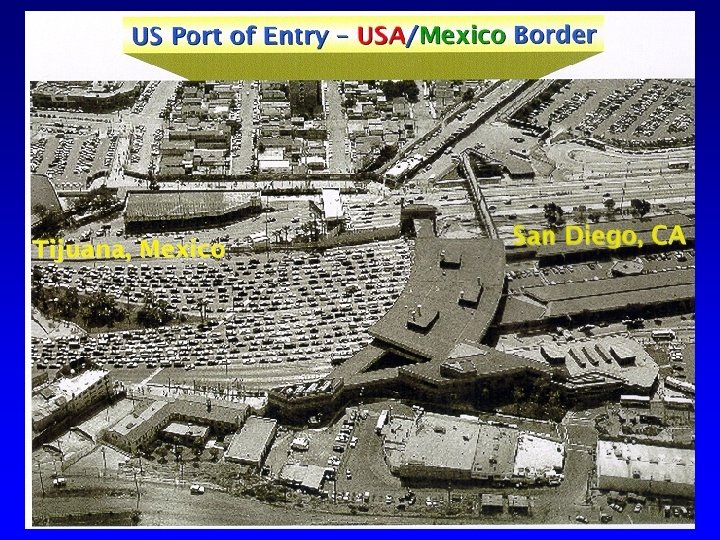
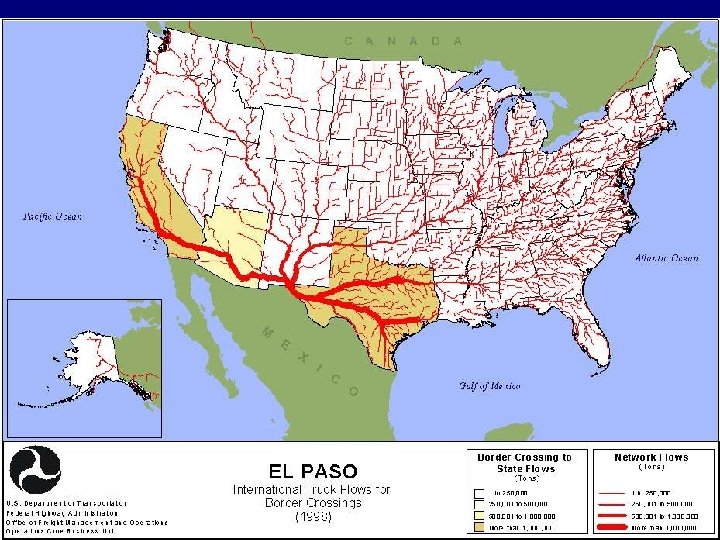
 Texas Land Ports of Entry* • 12 bridges • Incoming Cargo Trucks: 1, 731, 464 • Incoming Cargo Train Cars: 240, 674 • Incoming Train Passengers: 8, 365 • Incoming Vehicle Passengers: 96, 894, 839 • Incoming Bus Passengers: 1, 942, 990 • Incoming Pedestrians: 21, 056, 220 *USDOT, 2003
 A Shrinking World SAFER • HEALTHIER • PEOPLE
 Speed of Global Travel in Relation to World Population Growth From: Murphy and Nathanson. Semin. Virol. 5, 87, 1994 SAFER • HEALTHIER • PEOPLE
 International Tourist Arrivals World SAFER • HEALTHIER • PEOPLE
 Estimated Annual International Arrivals , U. S. A. Refugees 70 -90, 000 Immigrants 1, 000 International Travelers Foreign 60 M / U. S. 60 M U. S. -Mexico Border Crossings 400 M?
 Seattle and Narita Airports SAFER • HEALTHIER • PEOPLE
 Narita International Airlines
 Narita Roundtrips per Week: 2004

 Boeing 777
 Entry airports for 2. 79 million directly-arriving passengers from East Asia 1, Jan - Mar 2005 San Francisco 15% Los Angeles 22% Detroit 5% Chicago 6% New York: 8% 1 Includes Brunei, Cambodia, China/Hong Kong, Indonesia, Honolulu 15% Guam 11% Japan, Laos, Malaysia, Myanmar, Philippines, Singapore, South Korea, Taiwan, Thailand, Vietnam, Japan
 Proportion of 2. 79 million passengers directly arriving from East Asia, by airport Jan – Mar 2005
 Airports of North America…Two Stops from Anywhere Slide from Don Burke, JHU MIDAS
 “ Today, diseases as common as the cold and as rare as Ebola are circling the globe with near telephonic speed, making long-distance connections and intercontinental infections as if by satellite. You needn’t even bother to reach out and touch someone. If you’re homeothermic biomass, you will be reached and touched. ” Natalie Angier New York Times Magazine 6 May 2001
 The Spread of Influenza • Real life • Virtual: Mathematical models
 Person-to-Person Spread via Respiratory Droplets, Aerosols, and Direct Contact
 Influenza Pandemic, 1957
 Global Spread, 2000 -2001 • Viral strains often originate in Asia • Importance of international air travel • Implications for pandemics
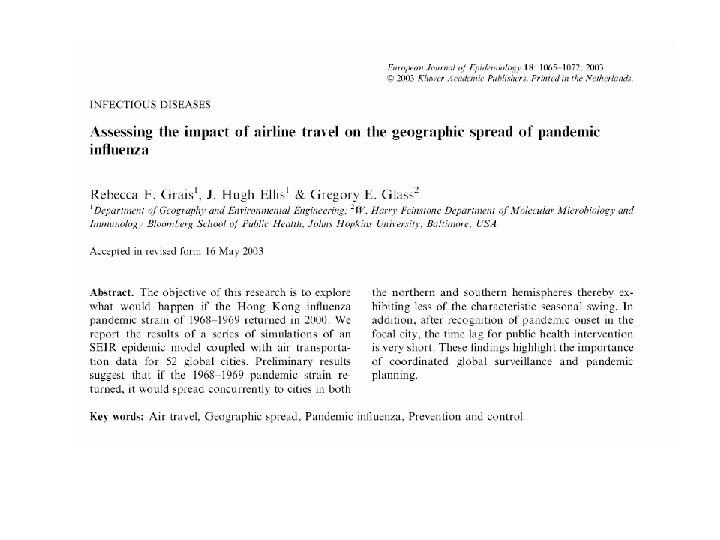
 Findings When 2000 Air Travel Patterns Added to 1968 Pandemic Model • Disease progresses faster (180 vs. 320 days) and farther • Number of cases is greater with air travel (188%) • Less hemispheric seasonal swing • Shorter time for effective intervention • Suggests need for very effective surveillance
 Another Model of US Pandemic Spread Ira Longini et al, 2006
 The Basic SIR Model of Infectious Disease
 Contagion Epidemic Modeling Goal: R< 1, Extinction or Quenching Encounter Incubation 1 -4 days Isolation initiated Recognition Isolation ended Period of communicability Period of risk for epidemic propagation Pre-symptomatic spread? Duration of isolation Time (days) d(exp) Infection Exposure d(sx) Symptom onset d(hc) Pt seeks health care d(ddx) Influenza diagnosis Time (days) d(ic onset) d(ic end) Appropriate infection control isolation, treatment # 2º contacts exposed and infected Contact tracing Public health notified 2º case ascertainment
 The “Reproductive Number” R 0 • “The average number of secondary cases caused by an infectious individual in a totally susceptible population” • If R 0 >1. 0 the disease will spread • If R 0 <1. 0 the disease will not spread • R 0 varies with disease, population, and control measures
 on Epidemic Dynamics Exponentiation Suppression Ro = 2.") Effect of Increasing Social Distance (Q&I) on Epidemic Dynamics Exponentiation Suppression Ro = 2. 0, Ro = 0. 67, Progression = 1: 2: 4: 8: 16 Progression = 1: 2: 4: 3: 2
Effect of Increasing Social Distance (Q&I) on Epidemic Dynamics Exponentiation Suppression Ro = 2. 0, Ro = 0. 67, Progression = 1: 2: 4: 8: 16 Progression = 1: 2: 4: 3: 2
 Ways to reduce R 0 to <1. 0 and control an outbreak • Reduce contact in population (increase “social distance”) • Reduce infectiousness of infected persons through treatment, isolation, or quarantine • Reduce susceptibility through vaccination or antiviral medications
 Definitions • Isolation – Separation of ill persons with contagious disease – Often in a hospital setting – Applied to individual level • Quarantine – Restriction of persons presumed exposed – Applied at the individual or community level • May be voluntary or mandatory
 What is the Evidence? • Real life experience • SARS • 1918 pandemic • Mathematical models
 Example: SARS 2003 Atlanta Journal-Constitution 3/18/03
 SARS Containment Strategy Early Detection Surveillance/ Monitoring Isolation Quarantine
 Summary of surveillance for SARS at points of transit as of June 30, 2003, Beijing Transit site Number of people Number (%) screened for fever febrile with SARS ----------------------------------------------------------Airport – international 275, 600 496 (0. 2%) 0 (0%) Airport – domestic 952, 200 Train stations 5, 246, 100 Roads 7, 365, 600 1, 449 (0. 2%) 2, 575 (0. 05%) 577 (0. 008%) 10 (0. 001%) 2(<0. 001%) 0 (0%) Zonghan Zhu, M. D. , Beijing Municipal Health Bureau, IEIDC Quarantine Conf 2004
 Taiwan Isolation and Quarantine for SARS 2003 – 671 cases isolated – 131, 132 persons quarantined – Included 50, 319 close contacts and 80, 813 travelers China – 5, 237 cases (2, 521 in Beijing) – 30, 000 (approx) persons quarantined Canada – 250 cases (203 probable) – 23, 297 contacts identified – Over 13, 000 persons quarantined (Toronto)
 Quarantine and surveillance of close contact, Beijing SARS 2003 • 3565 public health workers were mobilized to assist in the outbreak investigation • Close contacts were enforced in quarantine for 14 days • Home vs Centralized places – 60% were quarantined at home – 40% at centralized places such as hotels and medical facilities Zonghan Zhu, M. D. , Beijing Municipal Health Bureau, IEIDC Quarantine Conf 2004
 Close contacts: SARS Attack rates, Beijing 2003 Relationship Spouse Non-household relative Friend Household member Unknown Work/school contact Healthcare worker Other Total Attack Rate % 15. 4 11. 6 10. 0 8. 8 4. 5 0. 4 0. 0 6. 5 Zonghan Zhu, M. D. , Beijing Municipal Health Bureau, IEIDC Quarantine Conf 2004
 Efficiency of Quarantine: SARS 2003 SARS attack rate among those quarantined • Hong Kong (n=1, 262) – Household contacts • Taiwan (n= 131, 132) – Overall – Close contact – Travel 2. 7% 0. 09% 0. 22% 0. 09%
 Quarantine Utility What is the utility of “quarantine” for diseases which are not infectious during the incubation period? To provide an observation window of several days for evolution of symptoms, prompt and prioritized clinical diagnosis and effective isolation Onset to Dx: 1. 2 days vs. 2. 9 days (p<0. 006) among those in Q compared those not in Q (Taiwan 2003)
 from affected areas were") Quarantine at Entry? - Taiwan • Incoming travelers (Level B) from affected areas were quarantined – 21 (0. 03%) of 80, 813 had suspect or probable SARS – SARS was diagnosed in 0. 36% of persons who sat within 3 rows of a SARS patient on same airplane flight • Close Contact (Level A) quarantine- 102/52, 255 (0. 20%) suspect or probable SARS MMWR 2003; 52: 680 -3
Quarantine at Entry? - Taiwan • Incoming travelers (Level B) from affected areas were quarantined – 21 (0. 03%) of 80, 813 had suspect or probable SARS – SARS was diagnosed in 0. 36% of persons who sat within 3 rows of a SARS patient on same airplane flight • Close Contact (Level A) quarantine- 102/52, 255 (0. 20%) suspect or probable SARS MMWR 2003; 52: 680 -3
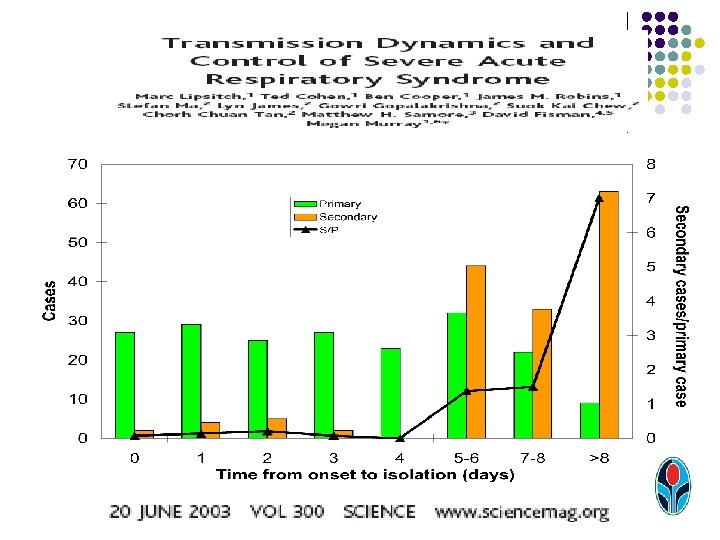
 Quarantine and SARS • Probably contributed much to SARS control • Lots of people quarantined for each case detected • Important differences between SARS and influenza: 1. incubation period (10 days vs. 1 -4 days [? ? ]) 2. viral shedding when pre-symptomatic 3. SARS peak shedding during second week; flu much earlier • Differences make quarantine for flu very difficult
 Quarantine in 1918 Pandemic • Australia: 7 -day Q + temperature monitoring of all ship passengers thought to have delayed pandemic by about 3 months • Madagascar: Quarantine delayed arrival by about 5 -6 months • American Samoa: quarantine prevented pandemic • Africa, Canada, Australia: Attempts to quarantine at land borders was not successful Emerging Infectious Diseases 2006; 12: 81 -87 or www. cdc. gov/eid
 When Is Quarantine Useful? A Mathematical Model Quarantine can have a substantial effect when: • There is a large reproductive number (R 0) when only isolation is used • A large proportion of infections from an ill individual can be prevented by quarantine • Asymptomatic individuals are likely to be quarantined before developing symptoms • Asymptomatic persons can transmit infection Day et al. American J Epidemiology 2006
 Assessing Collateral Damage • What are the unintended consequences of the interventions? – Adverse events – Economic (impact on traffic and trade) – Sociological (stigmatization, discrimination) – Psychological (depression, anxiety, PTSD)
 Percent experiencing problems while quarantined BASE: Toronto area residents who had been quarantined or had a friend or family member who had been quarantined (n=111) In general, being quarantined was a problem Specific Problems Emotional difficulties being confined Not getting paid because they missed work *Robert Blendon, Harvard School of Public Health Source: Harvard School of Public Health/Health Canada, June 2003
 Key Q-Questions • What are the key trigger points for implementing movement restrictions? • What epidemic parameters are useful to monitor impact? • When is it safe to declare “all clear” & scale back • Who will make the decision(s)? • Who will implement? • Will the measures be voluntary or enforced? • Who will enforce, if needed? • Who are all the partners/stakeholders and their roles? • Are there sufficient resources for planning, education and response?
 More Basic Questions • • How will the disease spread? Who is at risk? Is everyone on an airplane at risk? Whom to quarantine? Where to quarantine? How long? Who pays?