f8861c48fc4ab9bd414ab19c8d223cc9.ppt
- Количество слайдов: 109


Population and vehicles Motor vehicles Urban population People like the car: it gives the possibility to move fast and far It gives freedom World population
 CARBON MONOXIDE (CO) NITROGEN OXIDES (NOX) SULFUR")
Air pollution MOBILE SOURCES EXHAUST HYDROCARBONS (HC) CARBON MONOXIDE (CO) NITROGEN OXIDES (NOX) SULFUR COMPOUNDS PM 10

VOC 30 NOx 25 CO 80 Transportation share Pollutant emission in the USA 1995 SO 2 26 Millions of tons Transportation Other

EU - Pollutant emission from transportation Million of tons 24 25 20 11 15 7. 5 10 5 0 4. 6 4. 5 4. 0 2. 4 1. 5 0. 8 0. 9 0. 6 CO NO HC
 Automotive sources 38% Non automotive sources 5% Manufacturing")
Sources of Volatile Organic Compounds (VOC) Automotive sources 38% Non automotive sources 5% Manufacturing 62% 7% Distribution 5% Refuelling 59% Exhaust 24% Evaporative
")
European emission limits for CO 100% = Uncontrolled exhaust (60 g CO / Km) g / Km * Cold start

Possible solutions Hydrogen car Fuel cell technology

Hydrogen storage on - board Compressed Gas Storage Tanks Heavy and space / safety concern Metal hydrides Heavy

Hydrogen storage on - board Possibility of H 2 storage in SWCN (up to 67 wt %) A. C. Dillon et al. Nature 386 (1997) 377. A. Chambers et al. J. Phys. Chem. B 102 (1998) 4253. H 2 O / H 2 storage in carbon nanofibers (< 2 wt%) R. T Yang et al. Carbon 38 (2000) 623.

Steam Reforming steam reforming HC + H 2 O CO / CO 2 / H 2 CH 4 + H 2 O CO + 3 H 2 CH 4 C-H Cn. H 2 n+2 C-H 420 k. J/mol. 350 -400 k. J/mol C-C 320 k. J/mol Dry reforming CH 4 + CO 2 2 CO + 2 H 2 water-gas shift CO + H 2 O CO 2 + H 2 Methanation CO + 3 H 2 CH 4 + H 2 O Unwanted reactions Boudouard reaction 2 CO C + CO 2 methane cracking CH 4 C + 2 H 2

Steam Reforming CH 4 : H 2 O = 1 : 3. 7 P = 33 atm Outlet gas composition 44% H 2 O, 39% H 2, 5% CO, 6% CO 2, 6% CH 4 Outlet Temperature 760°C DH = 214 k. J/mol burners 63% of the heat absorbed to the gas is used by the reaction, 37% is converted into a temperature increase. parallel reactor tubes The gas passes up through vertical reactor tubes, typically 10 meters long and 10 cm in diameter. Heat is supplied to the tubes by burners.

Steam Reforming A typical catalyst consists of 15% Ni. O and 85% Mg. Al 2 O 4. The catalyst is activated by reduction with H 2. The active catalyst contains crystallites of metallic Ni with diameter 15 -150 nm, the active area of Ni is 5 -6 m 2/g. Reaction mechanism CHx*n + (4 -x)/2 H 2 O* CO + x/2 H 2 + (n + 1)* * O* 2 H* CH 4 + n* CHx*n + H 2 O* + H 2 + 2* + H 2 * adsorption site Temperature gradients and gas film diffusion are serious complications for kinetic studies.

On board H 2 production Fuel Air H 2 O Reformer CO, H 2 Reforming / Partial oxidation HC + O 2 CO + 2 HC + H 2 O Methanol decomposition CO + 3 H 2 CH 3 OH Ni, Pd, Pt over Ce. O 2, Zr. O 2 and Cex. Zr 1 -x. O 2 Fuel = CH 4, HC, diesel, methanol, … CO + 2 H 2
 CO 2")
Hydrogen production in Italy from methane? HC + O 2 (N 2) CO 2 + H 2 O + NOX + CO + HC + soot … CH 4 H 2 fuel cells H 2 O 1998 58 billions m 3 2010 90 billions m 3 1/3 from Italy 2/3 from Russia, Algeria, Holland, Norway.

Fuel processor development implies chemical system miniaturization technology Estimated reformer productivity: 600 mole H 2 m-3 hr-1 Reformer volume for 50 k. We 5 m 3

Packed bed steam reformer: commercial technology reactor wall steam + natural gas Tfurnace Tfilm Treactor Tcatalyst Heat reforming products Flow

Packed bed steam reformer volume • Twall: 1000°C Tgas: 750°C • Pellet size 1/8” • Tube diameter 1. 5” – Re = 740 – Volume: 16 liter

Plate reformer with catalyst-packed passages Reforming feed CH 4 / H 2 O Plate dimensions: 3 x 7 in Number of passages: 50 Volume required for heat transfer: 2 liter Catalyst volume: 7 liter

Plate reformer with catalyst-coated plates • Concept – steam reforming and fuel combustion occur on a catalystcoated thin plate. The combustion reaction on one side of the plate provides heat to the endothermic steam reforming reaction on the other side Combustion catalyst Combustion feed CH 4 / air Reforming feed CH 4 / H 2 O Reforming catalyst Metal foil

Plate reformer with catalyst-coated plates • Plate dimensions: 3 x 7 in • Number of passages: 50 • Volume required for mass transfer: 1. 2 liter

On board H 2 production H 2 O Fuel Air H 2 O Reformer WGSR CO, CO 2, H 2 Water - Gas Shift Reaction CO + H 2 O CO 2 + H 2 Cu, Ni, Fe, Co, Pd, Pt on Ce. O 2 Au / Ce. O 2

Water-gas shift CO + H 2 O CO 2 + H 2 Thermodynamics likes low temperatures, but kinetics is too slow.

On board H 2 production H 2 O Fuel Air H 2 O Reformer WGSR O 2 Pr. Ox PReferential OXidation Pt / Al 2 O 3 : Ce. O 2 Au / Ce. O 2 Cu. O / Ce. O 2 CO 2, H 2 O

On board H 2 production H 2 O Fuel Air H 2 O Reformer WGSR O 2 Pr. Ox H 2, CO 2, H 2 O Fuel cell CO 2, H 2 O Air

Possible solutions Hydrogen car Fuel cell Electric car Technical problem - batteries

Possible solutions Hydrogen car Fuel cell Electric car Technical problem - batteries Hybrid car Combustion engine Fuel tank Batteries Electric engine Honda Insight; Toyota Prius

Possible solutions Hydrogen car Fuel cell Electric car Technical problem - batteries Hybrid car Catalytic converters - TWC

Possible solutions Hydrogen car Fuel cell Electric car Technical problem - batteries Hybrid car Catalytic converters – TWC Cycling - walking

Properties of a suitable catalyst Highly active: Conversion > 98%. 50 -100 liters of exhaust to be converted in 1 sec per liter of catalyst. Highly selective: H 2 O, CO 2 and N 2 as products. Thermally stable: working temperature 350 -1100°C. Long life: 160. 000 Km.
 STOICHIOMETRIC COMBUSTION (A/F =")
Exhaust emissions vary as a function of air-to-fuel ratio (A/F) STOICHIOMETRIC COMBUSTION (A/F = 14. 6 - 14. 7) C 8 H 18 + 12. 5 O 2 + 12. 5 * 3. 76 N 2 9 H 2 O + 8 CO 2 + 12. 5 * 3. 76 N 2 Air to fuel ratio, by weight Engine power NO X 5 Hydrocarbons CO

TWC: How is the exhaust converted? 3 way catalyst • CO oxidation: CO + ½ O 2 • HC oxidation: HC + O 2 • NO reduction: NO + ½ CO HC + 2 NO CO 2 + H 2 O ½ N 2 + CO 2 + N 2 + H 2 O Catalyst: Pt (Pd) / Rh / Al 2 O 3 / Cex Zr 1 -x. O 2

Gas phase diffusion Product desorption NO CO Dissociative adsorption Molecular adsorption Surface diffusion CO 2 Surface reaction Adsorbed product Metal Support

Three-way catalysts Ms, p e- Md Fermi Level NO 2 p* 1 s 1 p Rh Pd Pt nuclear charge 4 d 4 d 5 d Rh for NO reduction Pt and Pd for CO and HC oxidation R. Hoffmann et al. , J. Phys. Chem. , 97 (1993) 7691.

Temperature dependence of conversions Conversion / % 100 CO HC 50 0 473 NO 573 673 Temperature / K 773

Options for the reduction of the cold start emissions Hydrocarbons adsorber • Cold start HC retained by adsorber HC adsorber Catalyst • Warmed-up HC released from adsorber and converted by catalyst
 Quick")
Options for the reduction of the cold start emissions Electrically heated catalyst (EHC) Quick heat-up of the converter EHC Main Catalyst Start-up converters (close-coupled converters) Possible through new thermostable washcoats Heat up quicker - handles low load exhaust Engine Start-up converter Main catalyst

Light-off catalyst Pt : Pd : Rh 5. 3 g/l 1 : 28 : 1 3. 7 g/l 1 : 14 : 1 2. 8 g/l 1 : 16 : 1 1. 8 g/l 5 : 0 : 1

Three-way catalyst NOx Rich CO HC Lean

Drawbacks of current TWCs A/F Active system A/F Inactive system Need A/F close to the stoichiometric value 2 Ce. O 2 Ce. O 2 -x + x/2 O 2 Ce. O 2 is an oxygen buffer

Drawbacks of current TWCs Low activity below 300 - 400 °C Solutions: • Active catalyst at low temperature • Close Coupled Converter (high thermal stability)

Aging effects Sintering and encapsulation of the noble metal Sintering of the support (loss of surface area) Reaction conditions / high temperature

TWC targets Thermal stability at / °C • Thermal stability: Year • Durability: USA from 50. 000 (1980) to 120. 000 miles (2004)
 of Ce. O 2 and")
Effect of redox aging on temperature programmed reduction (TPR) of Ce. O 2 and Rh/Ce. O 2 Hydrogen consumption / a. u. 190 m 2 g-1 Fresh and aged < 10 m 2 g-1 190 m 2 g-1 Rh 2 O 3 reduction Loss of surface area = • Loss of OSC/activity < 10 m 2 g-1 Temperature / °C • Loss of metal-support interaction

Why Ce. O 2 -Zr. O 2 solid solutions ? High thermal stability (ceramic materials) incorporation of Ce. O 2 in the solid solution may prevent the undesirable fixation of ceria in the 3+ state such as in Ce. Al. O 3 or Ce 2(CO 3)3.

Temperature programmed reduction of 0. 5% Rh/Ce. O 2 -Zr. O 2 Rh 2 O 3 Ce 4+ Ce 3+ % Ce. O 2 10 Bulk effects Hydrogen Consumption / a. u. Surface area < 1 m 2/ g 20 30 40 50 Tetragonal 50 Cubic 60 70 80 90 100 300 500 700 900 1100 1300 P. Fornasiero et al. , J. Catal. , Temperature / K 151 (1995) 168.

EXAFS analysis of Ce 0. 5 Zr 0. 5 O 2 Ce - O = 2. 31 Å (8) Zr - O = 2. 13 Å (4) = 2. 34 Å (2) > 2. 62 Å (2) Ce Zr O

Ce. O 2 -Zr. O 2 structure Ce. O 2 -Zr. O 2 Ce Zr Zr. O 2 O
 C. N. = 4 + 2 t'")
t", t' phases 4 bands (? ) C. N. = 4 + 2 t' phase A 1 g+3 Eg+2 B 1 C. N. = 4 + 4 Ce. O 2 Ce 0. 7 Zr 0. 3 O 2 Raman Zr--O cubic phase F 2 g mode C. N. = 8 intensity / a. u. M-O bonds by Raman and EXAFS spectroscopy Ce 0. 5 Zr 0. 5 O 2 Ce 0. 2 Zr 0. 8 O 2 Raman shift / cm -1

Temperature programmed reduction of high surface area samples fresh Ce 0. 5 Zr 0. 5 O 2 64 m 2/g aged 10 m 2/g O 2 at 700 K fresh Rh(0. 5%)/Ce 0. 5 Zr 0. 5 O 2 52 m 2/g O 2 at 700 K aged 17 m 2/g P. Fornasiero et al. , J. Catal. , 167 (1997) 576.

Surface area and OSC in Ce. O 2 -Zr. O 2 2 Dynamic OSC / ml. O g-1 Surface area / m 2 g-1 Aged at 900°C Ce. O 2 content / % J-P. Cuif et al SAE 970464 (1997)

Dynamic Oxygen Storage Capacity Both H 2 and CO are present in the exhaust How the dynamic-OSC is affected by the nature of the reducing agent ? What is the importance of surface area in the NM/Ce. O 2 -Zr. O 2 system?

Partial Pressure / torr x 108 Room temperature dynamic H 2 - OSC on Pt/Ce 0. 68 Zr 0. 32 O 2 Pt/Al 2 O 3 Pt/Ce 0. 68 Zr 0. 32 O 2 Time /s n OSC: H 2 and O 2 pulses are buffered using Pt/Ce 0. 68 Zr 0. 32 O 2

Partial Pressure / torr x 108 Room temperature dynamic H 2 - OSC: water evolution m/z = 18 Pt/Ce 0. 68 Zr 0. 32 O 2 fresh reduced Pt/Ce 0. 68 Zr 0. 32 O 2 redox aged Pt/Ce 0. 68 Zr 0. 32 O 2 fresh oxidised Pt/Al 2 O 3 fresh reduced Time /s n Water is produced: spilt/stored H 2 is titrated by O 2 = OSC

H 2 spillover and OSC / ml g-1 Room temperature dynamic H 2 - OSC on Pt/Ce 0. 68 Zr 0. 32 O 2 and Pt/Ce. O 2 : effect of surface area BET surface area / m 2 g-1 n. Spilt H 2 is stored on the surface: Zr. O 2 promotes H 2 storage N. Hickey et al. Chem. Commun. (2000) 357.
: Pt/Ce. O 2 and Pt/Ce 0. 68 Zr 0.")
Dynamic OSC (ml. O 2/g): Pt/Ce. O 2 and Pt/Ce 0. 68 Zr 0. 32 O 2 n H 2 -OSC: rt. - surface related / 500°C bulk related n CO-OSC: only high temperature / surface and bulk sensitive

Stabilization of OSC at high temperatures • How can we improve and thermally stabilize surface area of Ce. O 2 - Zr. O 2? ü Design of the texture ü Choice of the dopants (composition) ü Addition of Al 2 O 3
")
Ce 0. 2 Zr 0. 8 O 2 - Textural stability at 1000°C DV/Dlog(D) Adsorbed volume / ml g-1 Sample B Relative pressure Cumulative pore volume / mlg-1 Sample A Average pore diameter / nm Design of pore size = high thermal stability at 1000 °C

Surface area / m 2 g-1 Effect of texture: surface area of Ce 0. 2 Zr 0. 8 O 2 after calcination at 1000°C. In collaboration with MEL Chemicals Optimization of synthesis conditions yields stable textural properties

Surface area / m 2 g-1 Ce 0. 2 Zr 0. 8 O 2 - Textural stability at 1000°C Addition of La 2 O 3 improves textural stability In collaboration with MEL Chemicals

Stabilization of OSC at high temperatures • How can we improve and thermally stabilize surface area of Ce. O 2 - Zr. O 2? • Addition of Al O effective way 2 3 may be an easy and cost- However: • Ce. O /Al O 2 2 3 easily forms Ce. Al. O 3

Homogeneity of solid solution: XRD of Ce 0. 6 Zr 0. 4 O 2/Al 2 O 3 co-precipitation optimized 1000°C 900°C 700°C 600°C 2 q 2 q Solid solution is not formed unless it is pre-formed by an appropriate synthesis

Hydrogen consumption / a. u. OSC: TPR of Ce. O 2/Al 2 O 3 and Ce 0. 2 Zr 0. 8 O 2/Al 2 O 3 Calcined at 1100ºC for 5 h Ce. O 2(13%)/Al 2 O 3 Addition of Zr. O 2 favours reduction at low temperature and prevents Ce. Al. O 3 formation CZ 20(13%)/Al 2 O 3 Temperature / ° C

XRD of Ce. O 2/Al 2 O 3 and Ce 0. 2 Zr 0. 8 O 2/Al 2 O 3 Samples calcined at 1100°C and after redox ageing Ce. Al. O 3 Ce. O 2/Al 2 O 3 CZ 20/Al 2 O 3 2 q Zr. O 2 prevents Ce. Al. O 3 formation

Dynamic CO-OSC at 600°C over the Cex. Zr 1 -x. O 2/Al 2 O 3 system CZ 20/Al 2 O 3 CZ 60 R. Di Monte et. al. , Chem. Comm. , (2000) 2167.

Thermal stability: effect of the interaction between Cex. Zr 1 -x. O 2 and Al 2 O 3 CZ 20/Al 2 O 3 CZ 60/Al 2 O 3 CZ 100/Al 2 O 3
/ Al 2 O")
HREM of Ce 0. 2 Zr 0. 8 O 2 (13%)/ Al 2 O 3 Calcined at 1100°C 5 h 10 nm 30 nm t-Ce 0. 2 Zr 0. 8 O 2 In collaboration with S. Bernal and J. M. Gatica, Univesity of Cadiz, Spain Digital Diffraction Pattern

Role of Ce 3+ sites: NO + CO Reaction Rh/Ce 0. 6 Zr 0. 4 O 2 -x Rh/Al 2 O 3 P. Fornasiero et al. , J. Catal. , 175 (1998) 269

NO reduction over ceria-based systems CO, H 2 M CO 2 T < 500 K M - CO M-H H 2 O T > 500 K CO, HC M-O Ce 3+ M Ce 4+- O N 2 O, N 2 NO CO 2, H 2 O N 2 O, N 2 NO M = Rh, Pt, Pd
/ Al 2 O")
HREM of Ce 0. 2 Zr 0. 8 O 2 (13%)/ Al 2 O 3 Calcined at 1100°C 5 h 10 nm 30 nm t-Ce 0. 2 Zr 0. 8 O 2 In collaboration with S. Bernal and J. M. Gatica, University of Cadiz, Spain Digital Diffraction Pattern

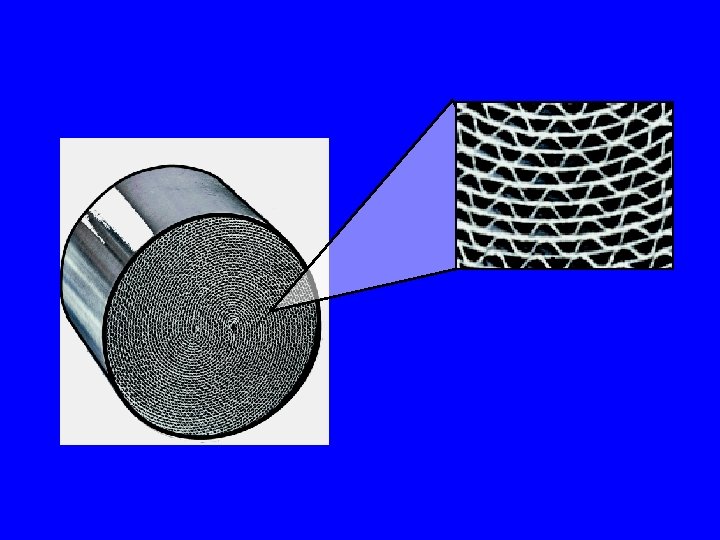
What is the future of spent catalyst Metallic substrate Ceramic substrate

Price of PGM and Demand in Autocatalysts

Recent Economic trends Total demand Recovery Average price $ per oz Businees Million $ 2001 6. 190. 000 530. 000 558 296 2002 6. 370. 000 523 298 2003 Total demand Recovery Average price $ per oz Businees Million $ 2001 6. 790. 000 280. 000 687 190 2002 4. 880. 000 370. 000 355 130 2003 ? ? ? Total demand Recovery Average price $ per oz Businees Million $ 2001 577. 000 89. 000 1829 163 2002 568. 000 99. 000 888 87 2003 ? ? ? Pt Pd Rh

Anthropogenic Platinum-group element Emissions • Driving conditions • Catalyst age • …. 0. 65 mg Pt / Km 20. 000 Km per year = 0. 013 g Pt per year per car 15 Ml cars in Italy 195 kg of Pt per year In 10 years 0. 13 g (up to 30% of the initial value)

Metal deactivation in M/Ce. O 2 and related catalysts. ü “conventional” causes: • Encapsulation (Poor textural stability of Ce. O 2) • Metal Sintering • Poisoning effects ü SMSI like effects.
 EFFECT S. J. Tauster et al; J. Am. Chem. Soc.")
STRONG METAL/SUPPORT INTERACTION (SMSI) EFFECT S. J. Tauster et al; J. Am. Chem. Soc. 100, 170 (1978) ü ü Typically associated with reducible supports At low Tredn (200ºC) the catalyst exhibits a “conventional” chemical behaviour ü At high Tredn (500ºC) strong perturbation of the chemisorptive and catalytic properties ü Reversibility. Reoxn. + mild Redn. allows to regenerate the catalyst Classic SMSI system: M/Ti. O 2
/Ti. O 2 SMSI Effect. Chemical Evidence H/Rh Catalytic Activity* Red. 200°C 0. 43")
Rh(5%)/Ti. O 2 SMSI Effect. Chemical Evidence H/Rh Catalytic Activity* Red. 200°C 0. 43 17 Red. 500°C 0 0 Red. 500°C Reox. 400ºC Red. 200ºC 0. 23 7 S. Bernal et al, Appl. Catal. 99, 1 (1993) * Benzene hydrogenation (25ºC) (cm 3 cyclohexane /g. Rh. s)
/Ti. O 2 3 nm Rh Ti. O")
HREM micrograph Catalyst reduced at 200ºC Rh(5%)/Ti. O 2 3 nm Rh Ti. O 2 – A [111] High density of clean and well faceted Rh particles
/Ti. O 2 HREM Micrograph Catalyst reduced at 500ºC 3 nm Rh Ti. O")
Rh(5%)/Ti. O 2 HREM Micrograph Catalyst reduced at 500ºC 3 nm Rh Ti. O 2 – A [111] Ti. O 2 -x migrates onto and partly covers the metal microcrystals (DECORATION)
/Ti. O 2 HREM micrograph Catalyst reduced at 500ºC Rh At Tred = 500ºC:")
Rh(5%)/Ti. O 2 HREM micrograph Catalyst reduced at 500ºC Rh At Tred = 500ºC: A significant fraction of the Rh microcrystals look like clean (Partial Decoration)
/Ti. O 2 2 nm Reversibility of the SMSI Effect Red. 500ºC + Ox.")
Rh(5%)/Ti. O 2 2 nm Reversibility of the SMSI Effect Red. 500ºC + Ox. 400ºC + Red. 200ºC Rh [110] Ti. O 2 – R [110] Reoxn. at 400ºC-500ºC followed by a mild reduction allows to recover the catalyst from the SMSI state
O 2 -x 700 ºC < Tred < 900º C Rh/Ce.")
Metal Decoration in Rh/Ce(M)O 2 -x 700 ºC < Tred < 900º C Rh/Ce. O 2 Red. 700ºC in H 2
O 2 -x 700 ºC < Tred < 900º C")
Metal Decoration Effects in Pt/Ce(M)O 2 -x 700 ºC < Tred < 900º C 0. 34 nm Pt (111) sop. (111) Pt Simulated image 0. 34 nm Pt/Ce. Tb. Ox Tred: 700ºC Monocapa de soporte 8° soporte[011] Pt [110]
 reduced Rh catalysts 2. 3 2. 2 54° 65° 2.")
Nano-structure of HT (900ºC) reduced Rh catalysts 2. 3 2. 2 54° 65° 2. 2 Tred 900º C 3 nm decoración decoration Twinned Rh particle. Metal sintering on HT reduction 61° 3 nm 2. 2 1. 9 No evidence of formation of Rh-Ce intermetallics 2. 2 1. 9
![Pt-Ce Alloying Phenomena Pt Tred > 900º C 5 nm [010] Ce. Pt 5](https://present5.com/presentation/f8861c48fc4ab9bd414ab19c8d223cc9/image-85.jpg "Pt-Ce Alloying Phenomena Pt Tred > 900º C 5 nm [010] Ce. Pt 5")
Pt-Ce Alloying Phenomena Pt Tred > 900º C 5 nm [010] Ce. Pt 5 90° 42° 4. 66 Pt/Ce. O 2 Red. 1173 K en H 2 4. 22 Ce. Pt , Ce. Pt 2 Ce. Pt 5 , Ce 3 Pt 2 , Ce 7 Pt 3 3. 02

Trends in fuel consumption Addition of “gadgets” increases fuel penalty
 fuel economy (15")
Advantages of Lean technology (Excess of air: A/F > 14. 6) fuel economy (15 -35%) decreased CO 2 emissions low HC and CO emissions Drawback of Lean technology The reduction of NOx is very difficult in the presence of a large excess of O 2 4 NH 3 + 4 NO + O 2 4 N 2 + 6 H 2 O C. Cohn et al. , 1961, US Patent 2, 975, 025.

Selective Catalytic Reduction of NOx with NH 3 4 NH 3 + 4 NO + O 2 4 N 2 + 6 H 2 O 4 NH 3 + 2 NO 2 + O 2 3 N 2 + 6 H 2 O Stationary applications but NOT (yet) for car : Separate and additional supply system Slip of ammonia and on board NH 3 production ? 2 NO + 5 H 2 2 NH 3 + 2 H 2

Lean burn catalysts: zeolite-based materials NO decomposition on Cu-ZSM 5 NO N 2 + O 2 High temperatures favours NO desorption H 2 O slightly effects the activity NO decomposition is inhibited by O 2 Selective catalytic reduction of NO with hydrocarbons HC + NOx + O 2 N 2 + H 2 O + CO 2

Zeolite-based De. NOx catalysts: Effect of water addition Low temperature H 2 O inhibits reversibly the reaction but it may increase the selectivity towards N 2 High temperature (700 °C) Permanent deactivation Dealumination (Al 3+ migrates out of the structure) Collapse of zeolite structure
 100 Mn 2")
Bifunctional De. NOx catalyst Conversion on NO to N 2 (%) 100 Mn 2 O 3 / Ce-ZSM-5 80 Ce-ZSM-5 60 40 20 0 100 200 300 400 500 600 Temperature (°C) NO O 2 i NO 2 C 3 H 6 ii X = organic nitro/nitroso compound X NO 2/O 2 iii N 2 (+ COx, H 2 O) C. Yokoyama and M. Miosnoi, Catal. Lett. , 29 (1994) 1.

Bifunctional De. NOx catalysts: Effect of water addition Mn 2 O 3 / Sn-ZSM-5 Direct C 3 H 6 combustion is strongly suppresed De. NOX activity is enhanced 100 Conversion of NO to N 2 (%) H 2 O does not effect significantly the rate of NO oxidation to NO 2 over Mn 2 O 3 Without H 2 O 80 60 40 200 Y. Hirao et al. , J. Chem. Soc. Chem. Comm. , (1996) 597. With 5. 7 % H 2 O 300 400 500 Temperature (°C) 600
 1%Pt/Al 2 O 3 De. NOx catalyst: C 3 H 6 -NO-O")
Conversion (%) 1%Pt/Al 2 O 3 De. NOx catalyst: C 3 H 6 -NO-O 2 reaction HC to CO 2 NO to N 2 O NO to NO 2 C 3 H 6 = 1000 ppm NO = 1000 ppm O 2 = 5% Narrow operating range and low N 2 selectivity. Temperature (°C) Maximum NOx conversion coincident with 100% C 3 H 6 conversion NO 2 only produced in absence of C 3 H 6: oxygen coverage negligible in the presence of C 3 H 6 R. Burch, et al. Catal. Lett. 37 (1996) 51.

Pt/Al 2 O 3 De. NOx catalyst: Effect of metal loading 70 2% Conversion of NOx (%) 60 1% 50 0. 5% 40 0. 25% 30 0. 1% 20 Increasing metal loading effects temperature of the maximum conversion and the activity. 10 0 200 250 300 350 400 Temperature (°C) R. Burch et al. Appl. Catal. B 4 (1994) 65.
 1%Pt/Al 2 O 3 De. NOx catalyst: C 3 H 8 -NO-O")
Conversion (%) 1%Pt/Al 2 O 3 De. NOx catalyst: C 3 H 8 -NO-O 2 reaction HC to CO 2 NO to NO 2 NO +NO 2 to N 2 O and N 2 C 3 H 8 = 1000 ppm NO = 1000 ppm O 2 = 5% Temperature (°C) Maximum NOx conversion NOT coincident with 100% C 3 H 8 conversion NO 2 produced in presence of C 3 H 8: oxygen present on Pt surface R. Burch, et al. , Catal. Today, 42 (1998) 13.

Pt/Al 2 O 3 De. NOx catalyst: Proposed mechanism for C 3 H 6 - NO - O 2 reaction C 3 H 6(g) CHx* O 2(g) NO(g) 3 CO 2(g) + 3 H 2 O(g) 2 O* -* +* NO* +* N* + O* + N * - 2* -2 * N 2(g) N 2 O(g) Pt surface dominated by carbonaceous species despite high O 2 concentration NOx reduction via NO dissociation on Pt surface Oxygen coverage negligible

Pt/Al 2 O 3 De. NOx catalyst: Proposed mechanism for C 3 H 8 - NO - O 2 reaction +* -* O 2 * + * 2 O* + OH* - O* - * C 3 H 8 FAST + * + O* + 9. 5 O* - 10. 5 * +* -* - O* NO 2(g) C 3 H 8 NO* +* -* H 2 O(g) C 3 H 7* + OH* FAST NO(g) Oxygen coverage on Pt surface high NO 2* Cx Hy 3 CO 2(g) + 3. 5 H 2 O(g) NOx reduction via reaction between spilt-over NO 2 and C 3 H 8 -derived species on Al 2 O 3 Pt metal N 2(g), N 2 O(g) Al 2 O 3 support CO 2(g), H 2 O(g)

Be sure to ask the correct question When the car is moving slowly, the exhaust temperature is below 200°C and the NOx emissions is less than that allowed by legislation. NOx emission control is NOT any longer necessary at low temperature! SO, ANOTHER NEW QUESTION: How to control NOX in diesel passenger cars in the temperature range from 200 to 400 °C?

Silver De. NOx catalysts De. NOx: HC combustion: NO + HC O 2 + HC N 2 + CO 2 H 2 O + CO 2 Pt and Pd good oxidation catalyst Growing interest in the use of Ag-based catalysts as possible alternatives Ag/Al 2 O 3 has been widely studied
 Particle size")
Silver De. NOX catalyst: C 3 H 6 and NO Conversion (%) Particle size effect on activity Increasing the silver loading shifts the activity to lower temperature 10% Ag/ - Al 2 O 3 1. 2% Ag/ - Al 2 O 3 F. C. Meunier et al. J. Catal. 187 (1999) 493.

Silver De. NOX catalyst: Particle size effect on selectivity 1. 2% Ag/ - Al 2 O 3 10% Ag/ -Al 2 O 3 50 40 40 Yield (%) 60 50 Yield (%) 60 NO 2 30 N 2 20 20 NH 3 N 2 O 10 10 0 0 30 200 300 400 500 Temperature (°C) 600 200 300 400 500 600 Temperature (°C) F. C. Meunier et al. J. Catal. 187 (1999) 493.

Silver De. NOx catalyst: Different roles of Ag during the C 3 H 6 -SCR over Ag/ - Al 2 O 3 NO / O 2 C 3 H 6 H 2 O COx N 2 O + N 2 O 2 NO + O 2 NO 2 C 3 H 6 O N N O Cx Hy R-ONO Ag 0 NOx. Ag+ R-NO 2 Al 2 O 3 R-NCO R-NH 2 NH 3
 Gasoline Maximum for 2000 150 Maximum")
European limits for fuel sulphur Sulphur ppm (ww) Gasoline Maximum for 2000 150 Maximum for 2005 50 Diesel Average 1999 Average 2000 Maximum 2005 450 300 350 50

Silver De. NOx catalysts There is a support effect on the De-NOx activity of Ag: Both using Zr. O 2 and Ce 0. 16 Zr 0. 84 O 2 as support results in a much lower activity range in comparison with Al 2 O 3. Ag/Zr. O 2 deactivates completely in the presence of SO 2 but it can be easily regenerated. Ag/Al 2 O 3 deactivates partially in the presence of SO 2 and it is not easily regenerated. Ag/Ce 0. 16 Zr 0. 84 O 2 deactivates partially in the presence of SO 2 and it can be easily regenerated.

“ The Toyota” concept None of the studied system show acceptable activity, hydrothermal stability or resistance to sulphur. So, perhaps it is not possible to achieve the goal of efficiently reducing NOx in the car exhaust under oxidising condition.

NOX storage catalyst: lean conditions CO 2 NO + 1/2 O 2 NO 2 Pt Ba(NO 3)2 Ba. CO 3 Al 2 O 3 Rh

NOX storage catalyst: rich conditions CO + HC + H 2 NOx CO Pt Ba(NO 3)2 Ba. CO 3 Rh Al 2 O 3 N 2 + CO 2

325 300 NOx / ppm NOx inlet 200 100 NOx outlet Rich pulse 0 0 0. 5 1. 0 1. 5 Time / min 2. 0 2. 5 Temperature / °C 350

Pollution prevention TWC: reduce NOx, CO and HC emissions from gasoline car De. NOx catalyst / NOx storage system: reduce NOx emissions from lean burn / diesel car (low NO, HC and CO emissions, fuel economy) Green house gasses (CO 2) Hydrogen as clean fuel ( Fuel cell) Ö Large scale production of highly pure H 2 Ö 2 distribution / refuelling H Ö board H 2 production On (hydrocarbons, Me. OH, Et. OH, water…. ) Ö 2 Storage materials H
f8861c48fc4ab9bd414ab19c8d223cc9.ppt