

7bba648902a88d462412999495fdeb2d.ppt
- Количество слайдов: 96
 Polymerase Chain Reaction What is PCR History of PCR How PCR works Optimizing PCR Fidelity, errors & cloning PCR primer design Application of PCR
 Polymorphism among 32 wheat samples revealed by AFLP
 Characteristics of AFLP - dominant marker. - DNA variation is detected by presence/absence of DNA bands due to: a) presence/absence of restriction sites b) additional bases (insertion) between two restriction sites are too large
 Advantages - higher reproducibility compared to RAPD. - highly polymorphic.
 Think … …
 PCR Requirements • Magnesium chloride: . 5 -2. 5 m. M • Buffer: p. H 8. 3 -8. 8 • d. NTPs: 20 -200µM • Primers: 0. 1 -0. 5µM • DNA Polymerase: 1 -2. 5 units • Target DNA: 1 µg
 Can I PCR Amplify RNA? • Not directly — the DNA polymerase requires a DNA template and will not copy RNA. • m. RNA can first be copied into c. DNA using reverse transcriptase. • c. DNA is a template for PCR —it need not be double-stranded.
 Cloning PCR Products • Products should be ligatable into bluntended restriction enzyme site. • Lower than expected efficiency. • Products are not truly blunt-ended. • Taq polymerase adds a single nontemplated base (usually A) to the 3´ end: NNNNNNN…NNNNNNNA ANNNNNNN…NNNNNNN
 Cloning PCR-generated Fragments • Generation of compatible ends. • T/A cloning vectors
 PCR Mutagenesis Add restriction sites for cloning Generate deletional mutants Generate single point mutations
 THE PROBLEM • QUANTITATION OF m. RNA – – northern blotting ribonuclease protection assay in situ hybridization PCR • most sensitive • can discriminate closely related m. RNAs • technically simple • but difficult to get truly quantitative results using conventional PCR 11
 • Use RNA to") Protocol RT-PCR • Isolate RNA (total or poly. A selected) • Use RNA to generate c. DNA (reverse transcriptase) • Use c. DNA from RT reaction as template for PCR amplification.
Protocol RT-PCR • Isolate RNA (total or poly. A selected) • Use RNA to generate c. DNA (reverse transcriptase) • Use c. DNA from RT reaction as template for PCR amplification.
 PCR") RT-PCR vs “Real-time” RT-PCR • RT-PCR is endpoint analysis • “Real-time” (fluorescent; quantitative) PCR is continual analysis
RT-PCR vs “Real-time” RT-PCR • RT-PCR is endpoint analysis • “Real-time” (fluorescent; quantitative) PCR is continual analysis
 • Identification/quantification of single base pair") Application of “Real-time” PCR • Expression analysis (RNA) • Identification/quantification of single base pair polymorphisms (DNA) • Genotyping (DNA) • Exposure monitoring RNA) • Clinical Screening – Cancer (DNA) – Pathogen detection (DNA/RNA)
Application of “Real-time” PCR • Expression analysis (RNA) • Identification/quantification of single base pair polymorphisms (DNA) • Genotyping (DNA) • Exposure monitoring RNA) • Clinical Screening – Cancer (DNA) – Pathogen detection (DNA/RNA)
 Considerations for Fluorescent “Real-time” RT-PCR • Primer sets – Chosing target sequence – Checking primer sets – Chosing fluorescent label • Quantification – Relative quantification – Absolute quantification – Standard curves
 Basics of real time RT-PCR Abundance of m. RNA • Central hypothesis: Changes in gene expression reflect changes in cell function • Nearly all physiological changes in animals are accompanied by changes in gene expression – Immune response – Toxic response – Pharmacological response
 Outline • • Basics of PCR and real time PCR Experimental Design Data Analysis Application to Drug Development and Design
 Polymerase Chain Reaction • In vitro method for the amplification of short (up to ~5000 bp) pieces of DNA • Relies on a thermostable form of DNA polymerase – Thermus aquaticus
 Polymerase Chain Reaction • Required reagents: – – – Template DNA Primers* DNA polymerase d. NTPs* Thermocycler
 Polymerase Chain Reaction • Proper controls – Water blank – Concentration curve – Internal standard control – Genomic DNA contaminant control
 Internal standard Gene of interest
 Polymerase Chain Reaction • Advantages – Sensitive – Versatile – easy to test new genes • Primers are inexpensive – Reliable • Much more than microarrays for individual transcripts – Standardized competitor templates or standard curves • Allow comparison between expts – Internal standards • Addresses variation in tissue starting amounts or loading errors
 Polymerase Chain Reaction • Disadvantages – Optimizations required • Annealing temperature • Number of cycles – Small order of magnitiude sensitivity for detection
 AFLP Amplified Fragment Length Polymorphism
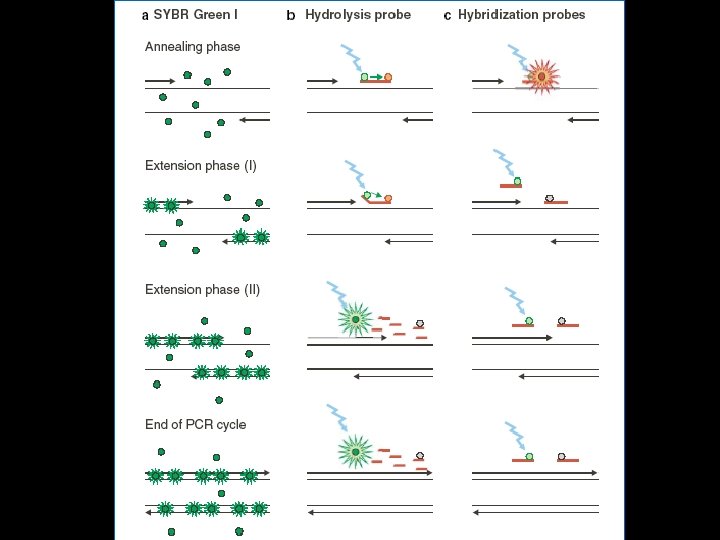
 SYBR Green I technique:") • Principles of Real Time Quantitative PCR Techniques (a) SYBR Green I technique: SYBR Green I fluorescence is enormously increased upon binding to double stranded DNA. During the extension phase, more and more SYBR Green I will bind to the PCR product, resulting in an increased fluorescence. Consequently, during each subsequent PCR cycle more fluorescence signal will be detected. (b) Hydrolysis probe technique: The hydrolysis probe is conjugated with a quencher fluorochrome, which absorbs the fluorescence of the reporter fluorochrome as long as the probe is intact. However, upon amplification of the target sequence, the hydrolysis probe is displaced and subsequently hydrolyzed by the Taq polymerase. This results in the separation of the reporter and quencher fluorochrome and consequently the fluorescence of the reporter fluorochrome becomes detectable. During each consecutive PCR cycle this fluorescence will further increase because of the progressive and exponential accumulation of free reporter fluorochromes. (c) Hybridization probes technique: In this technique one probe is labelled with a donor fluorochrome at the 3’ end a second –adjacent probe is labelled with an acceptor fluorochrome. When the two fluorochromes are in close vicinity (1– 5 nucleotides apart), the emitted light of the donor fluorochrome will excite the acceptor fluorochrome (FRET). This results in the emission of fluorescence, which subsequently can be detected during the annealing phase and first part of the extension phase of the PCR reaction. After each subsequent PCR cycle more hybridization probes can anneal, resulting in higher fluorescence signals.
• Principles of Real Time Quantitative PCR Techniques (a) SYBR Green I technique: SYBR Green I fluorescence is enormously increased upon binding to double stranded DNA. During the extension phase, more and more SYBR Green I will bind to the PCR product, resulting in an increased fluorescence. Consequently, during each subsequent PCR cycle more fluorescence signal will be detected. (b) Hydrolysis probe technique: The hydrolysis probe is conjugated with a quencher fluorochrome, which absorbs the fluorescence of the reporter fluorochrome as long as the probe is intact. However, upon amplification of the target sequence, the hydrolysis probe is displaced and subsequently hydrolyzed by the Taq polymerase. This results in the separation of the reporter and quencher fluorochrome and consequently the fluorescence of the reporter fluorochrome becomes detectable. During each consecutive PCR cycle this fluorescence will further increase because of the progressive and exponential accumulation of free reporter fluorochromes. (c) Hybridization probes technique: In this technique one probe is labelled with a donor fluorochrome at the 3’ end a second –adjacent probe is labelled with an acceptor fluorochrome. When the two fluorochromes are in close vicinity (1– 5 nucleotides apart), the emitted light of the donor fluorochrome will excite the acceptor fluorochrome (FRET). This results in the emission of fluorescence, which subsequently can be detected during the annealing phase and first part of the extension phase of the PCR reaction. After each subsequent PCR cycle more hybridization probes can anneal, resulting in higher fluorescence signals.
 What do m. RNA levels tell us? DNA m. RNA protein • Reflect level of gene expression • Information about cell response • Protein production (not always)
 quantitative m. RNA/DNA analysis Direct -Northern blotting -In situ hybridization PCR amplification -Regular RT-PCR -Real time PCR (Microarrays)
 Why isn´t this good enough?
 What’s Wrong With Agarose Gels? * * * • • Low sensitivity Low resolution Non-automated Size-based discrimination only Results are not expressed as numbers based on personal evaluation Ethidium bromide staining is not very quantitative End point analysis ABI: Real-Time PCR vs Traditional PCR (www)
 Endpoint analysis Different concentrations give similar endpoint results!
 Real-time Principles • based on the detection and quantitation of a fluorescent reporter • In stead of measuring the endpoint we focus on the first significant increase in the amount of PCR product. • The time of the increase correlates inversely to the initial amount of DNA template
 Polymerization 5 3 Forward Primer R Probe R = Reporter Q Q = Quencher 3 5 5 Reverse Primer 3 5
 For Real Time PCR we need a a specific probe with a fluorescent reporter. R Probe Q
 When in close contact with the reporter, the quencer absobes its emission.
 Strand Displacement R 5 3 5 Q 3 5
 Cleavage R 5 Q 3 3 5 5 3 5
 Polymerization Completed R Q 3 5 5 3
") Van der Velden. Leukemia 2003 (www)
Van der Velden. Leukemia 2003 (www)
 * emits a strong fluorescent signal upon binding") SYBR Green (double-stranded DNA binding dye) * emits a strong fluorescent signal upon binding to double-stranded DNA * nonspecific binding is a disadvantage * requires extensive optimisation • longer amplicons create a stronger signal • It´s cheap
SYBR Green (double-stranded DNA binding dye) * emits a strong fluorescent signal upon binding to double-stranded DNA * nonspecific binding is a disadvantage * requires extensive optimisation • longer amplicons create a stronger signal • It´s cheap
 SYBR® Green I Chemistry Polymerization 5' Forward Primer 3' 5' 5' 3' Reverse Primer 5' Polymerization completed 5' 3' 5'
 Real-time PCR advantages * not influenced by non-specific amplification * amplification can be monitored real-time * no post-PCR processing of products (high throughput, low contamination risk) * requirement of 1000 -fold less RNA than conventional assays (3 picogram = one genome equivalent) * most specific, sensitive and reproducible
 Housekeeping gene • Knowing the amount of m. RNA in one sample from one specific gene does not tell us alot • You don´t know the total amount of m. RNA in your sample • You also dont know how much the m. RNA level has changed compared to other m. RNA levels Example: m. RNA levels increase 2 x after induction It is possable that all genexpression in the cell has increased We have to compare the expression of our gene to another gene which expression is normally constant, a housekeeping gene
 Real time PCR advantages * not influenced by non specific amplification * amplification can be monitored real time * no post PCR processing of products (high throughput, low contamination risk) * ultra rapid cycling (30 minutes to 2 hours) * wider dynamic range of up to 1010 fold * requirement of 1000 fold less RNA than conventional assays (3 picogram = one genome equivalent) * detection is capable down to a 2 fold change * confirmation of specific amplification by melting curve analysis * most specific, sensitive and reproducible * not much more expensive than conventional PCR (except equipment cost)
 Real time PCR disadvantages * setting up requires high technical skill and support * high equipment cost *** * intra and inter assay variation * RNA lability * DNA contamination (in m. RNA analysis)
 SYBR Green I technique: SYBR Green") Principles of Real Time Quantitative PCR Techniques (a) SYBR Green I technique: SYBR Green I fluorescence is enormously increased upon binding to double stranded DNA. During the extension phase, more and more SYBR Green I will bind to the PCR product, resulting in an increased fluorescence. Consequently, during each subsequent PCR cycle more fluorescence signal will be detected. (b) Hydrolysis probe technique: The hydrolysis probe is conjugated with a quencher fluorochrome, which absorbs the fluorescence of the reporter fluorochrome as long as the probe is intact. However, upon amplification of the target sequence, the hydrolysis probe is displaced and subsequently hydrolyzed by the Taq polymerase. This results in the separation of the reporter and quencher fluorochrome and consequently the fluorescence of the reporter fluorochrome becomes detectable. During each consecutive PCR cycle this fluorescence will further increase because of the progressive and exponential accumulation of free reporter fluorochromes. (c) Hybridization probes technique: In this technique one probe is labelled with a donor fluorochrome at the 3’ end a second –adjacent probe is labelled with an acceptor fluorochrome. When the two fluorochromes are in close vicinity (1– 5 nucleotides apart), the emitted light of the donor fluorochrome will excite the acceptor fluorochrome (FRET). This results in the emission of fluorescence, which subsequently can be detected during the annealing phase and first part of the extension phase of the PCR reaction. After each subsequent PCR cycle more hybridization probes can anneal, resulting in higher fluorescence signals.
Principles of Real Time Quantitative PCR Techniques (a) SYBR Green I technique: SYBR Green I fluorescence is enormously increased upon binding to double stranded DNA. During the extension phase, more and more SYBR Green I will bind to the PCR product, resulting in an increased fluorescence. Consequently, during each subsequent PCR cycle more fluorescence signal will be detected. (b) Hydrolysis probe technique: The hydrolysis probe is conjugated with a quencher fluorochrome, which absorbs the fluorescence of the reporter fluorochrome as long as the probe is intact. However, upon amplification of the target sequence, the hydrolysis probe is displaced and subsequently hydrolyzed by the Taq polymerase. This results in the separation of the reporter and quencher fluorochrome and consequently the fluorescence of the reporter fluorochrome becomes detectable. During each consecutive PCR cycle this fluorescence will further increase because of the progressive and exponential accumulation of free reporter fluorochromes. (c) Hybridization probes technique: In this technique one probe is labelled with a donor fluorochrome at the 3’ end a second –adjacent probe is labelled with an acceptor fluorochrome. When the two fluorochromes are in close vicinity (1– 5 nucleotides apart), the emitted light of the donor fluorochrome will excite the acceptor fluorochrome (FRET). This results in the emission of fluorescence, which subsequently can be detected during the annealing phase and first part of the extension phase of the PCR reaction. After each subsequent PCR cycle more hybridization probes can anneal, resulting in higher fluorescence signals.
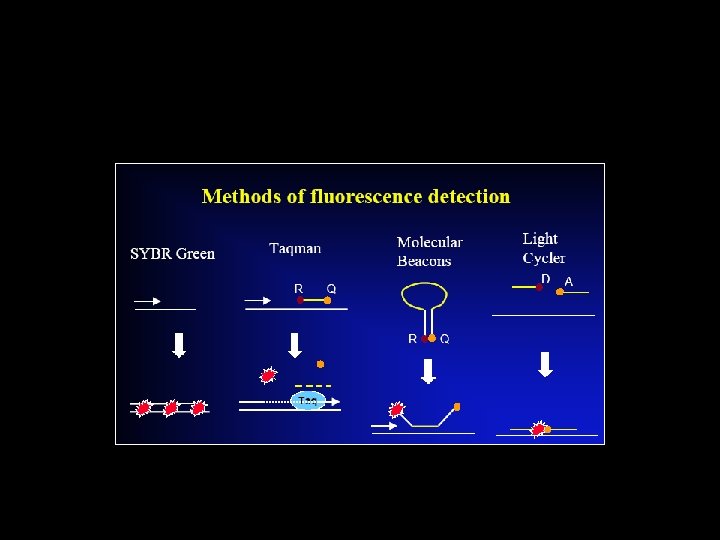
 Schematic diagram comparing three different fluorescence monitoring systems for DNA amplification. System A uses ds. DNA specific dyes (F) such as SYBR"Green I, which increase in fluorescence when bound to accumulating amplification product. System B uses dual labelled probes and depends on the 5' exonuclease activity of the polymerase to separate donor (D) and acceptor (A) by hydrolysis. Donor fluorescence is increased by removing acceptor quenching. System C depends on the independent hybridization of adjacent donor (D) and acceptor (A) probes. Their approximation increases resonance energy transfer from the donor to the acceptor. Other symbols are "hv" for excitation light and "x" for a 3' phosphate.
 Taq. Man Probes FRET = Förster/fluorescence resonance energy transfer & DNA Polymerase 5' exonuclease activity * Tm value 100 C higher than primers * runs of identical nucleotides (no consecutive Gs) * G+C content 30 80% * more Cs than Gs * no G at the 5' end
") FRET = Förster/fluorescence resonance energy transfer ABI: Real Time PCR vs Traditional PCR (www)
FRET = Förster/fluorescence resonance energy transfer ABI: Real Time PCR vs Traditional PCR (www)
") DNA Polymerase 5' Exonuclease Activity Mocellin et al. Trends Mol Med 2003 (www)
DNA Polymerase 5' Exonuclease Activity Mocellin et al. Trends Mol Med 2003 (www)
 The Taq. Man 5’ Exonuclease Assay In addition to two conventional PCR primers, P 1 and P 2, which are specific for the target sequence, a third primer, P 3, is designed to bind specifically to a site on the target sequence downstream of the P 1 binding site. P 3 is labelled with two fluorophores, a reporter dye (R) is attached at the 5 end, and a quencher dye (D), which has a different emission wavelength to the reporter dye, is attached at its 3 end. Because its 3 end is blocked, primer P 3 cannot by itself prime any new DNA synthesis. During the PCR reaction, Taq DNA polymerase synthesizes a new DNA strand primed by P 1 and as the enzyme approaches P 3, its 5 3 exonuclease activity processively degrades the P 3 primer from its 5 end. The end result is that the nascent DNA strand extends beyond the P 3 binding site and the reporter and quencher dyes are no longer bound to the same molecule. As the reporter dye is no longer in close proximity to the quencher, the resulting increase in reporter emission intensity is easily detected. Human Molecular Genetics 2. NCBI Books (www)
 * 15 30 bases in") Taq. Man Primers * equal Tm (58 600 C) * 15 30 bases in length * G+C content 30 80% * no runs of four or more Gs (any nucleotide) * no more than two G+C at the 3’ end * no G at the 5' end * amplicon size 50 150 bp (max 400) * span exon junctions in c. DNA
Taq. Man Primers * equal Tm (58 600 C) * 15 30 bases in length * G+C content 30 80% * no runs of four or more Gs (any nucleotide) * no more than two G+C at the 3’ end * no G at the 5' end * amplicon size 50 150 bp (max 400) * span exon junctions in c. DNA
 * emits a strong fluorescent signal upon") SYBR Green (double stranded DNA binding dye) * emits a strong fluorescent signal upon binding to double stranded DNA * nonspecific binding is a disadvantage * requires extensive optimization * requires melting point curve determination * longer amplicons create a stronger signal * may be multiplexed when coupled with melting curve analysis
SYBR Green (double stranded DNA binding dye) * emits a strong fluorescent signal upon binding to double stranded DNA * nonspecific binding is a disadvantage * requires extensive optimization * requires melting point curve determination * longer amplicons create a stronger signal * may be multiplexed when coupled with melting curve analysis
 Fluoresces when bound to ds. DNA
 At the beginning of amplification, the reaction mixture contains the denatured") SYBR Green (1) At the beginning of amplification, the reaction mixture contains the denatured DNA, the primers, and the dye. The unbound dye molecules weakly fluoresce, producing a minimal background fluorescence signal which is subtracted during computer analysis. (2) After annealing of the primers, a few dye molecules can bind to the double strand. DNA binding results in a dramatic increase of the SYBR Green I molecules to emit light upon excitation. (3) During elongation, more and more dye molecules bind to the newly synthesized DNA. If the reaction is monitored continuously, an increase in fluorescence is viewed in real time. Upon denaturation of the DNA for the next heating cycle, the dye molecules are released and the fluorescence signal falls.
SYBR Green (1) At the beginning of amplification, the reaction mixture contains the denatured DNA, the primers, and the dye. The unbound dye molecules weakly fluoresce, producing a minimal background fluorescence signal which is subtracted during computer analysis. (2) After annealing of the primers, a few dye molecules can bind to the double strand. DNA binding results in a dramatic increase of the SYBR Green I molecules to emit light upon excitation. (3) During elongation, more and more dye molecules bind to the newly synthesized DNA. If the reaction is monitored continuously, an increase in fluorescence is viewed in real time. Upon denaturation of the DNA for the next heating cycle, the dye molecules are released and the fluorescence signal falls.
 When to Choose SYBR Green * Assays that do not require specificity of probe based assays. Detection of 1000 s of molecules * General screening of transcripts prior to moving to probe based assays * When the PCR system is fully optimized no primer dimers or non specific amplicons, e. g. from genomic DNA
") When Not to Choose SYBR Green * Allelic discrimination assays (not an absolute one) * Multiplex reactions (not an absolute one) * Amplification of rare transcripts * Low level pathogen detection
When Not to Choose SYBR Green * Allelic discrimination assays (not an absolute one) * Multiplex reactions (not an absolute one) * Amplification of rare transcripts * Low level pathogen detection
 Real Time Principles Three general methods for the quantitative detection: 1. Hydrolysis probes (Taq. Man, Beacons, Scorpions) 2. Hybridization probes (Light Cycler) 3. DNA binding agents (SYBR Green)
") Molecular Beacons Mocellin et al. Trends Mol Med 2003 (www)
Molecular Beacons Mocellin et al. Trends Mol Med 2003 (www)
 Real Time Principles Three general methods for the quantitative detection: 1. Hydrolysis probes (Taq. Man, Beacons, Scorpions) 2. Hybridization probes (Light Cycler) 3. DNA binding agents (SYBR Green)
") Scorpions Bustin SA. J Mol Endocrinol 2002 (www)
Scorpions Bustin SA. J Mol Endocrinol 2002 (www)
") Scorpions Bustin SA. J Mol Endocrinol 2002 (www)
Scorpions Bustin SA. J Mol Endocrinol 2002 (www)
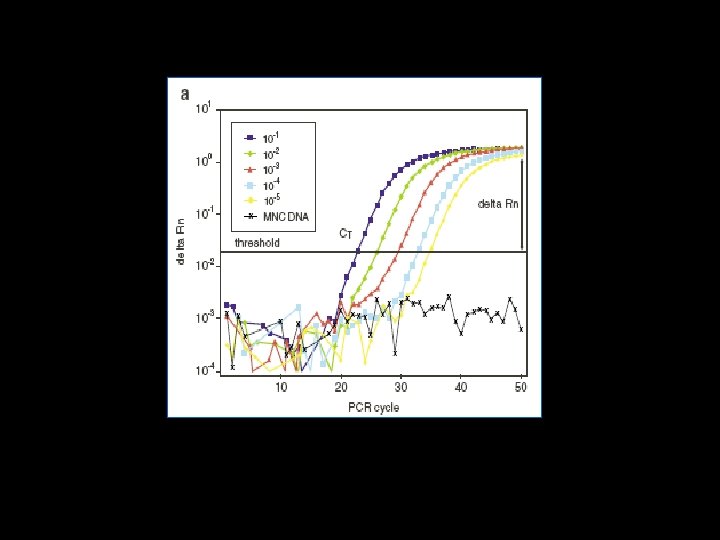
 Threshold Cycle * threshold cycle or the CT value is the cycle at which a significant increase in Rn is first detected * it is the parameter used for quantitation * CT value of 40 or more means no amplification and cannot be included in the calculations
 What is CT? The Amplification Plot contains valuable information for the quantitative measurement of DNA or RNA. The Threshold line is the level of detection or the point at which a reaction reaches a fluorescent intensity above background. The threshold line is set in the exponential phase of the amplification for the most accurate reading. The cycle at which the sample reaches this level is called the Cycle Threshold, CT. These two values are very important for data analysis using the 5’ nuclease assay.
 gene dosage by real time PCR Laurendeau et al. Clin Chem 1999") Albumin (ALB) gene dosage by real time PCR Laurendeau et al. Clin Chem 1999 (www)
Albumin (ALB) gene dosage by real time PCR Laurendeau et al. Clin Chem 1999 (www)
 Rn * Rn+ is the Rn value of a reaction containing all components (the sample of interest); Rn is the Rn value detected in NTC (baseline value) * Rn is the difference between Rn+ and Rn. It is an indicator of the magnitude of the signal generated by the PCR * Rn is plotted against cycle numbers to produce the amplification curves and gives the CT value
 What is Rn? +Rn Sample Rn Rn Threshold No Template Control CT 0 10 -Rn 20 cycle number 30 40
") What is Rn? (www)
What is Rn? (www)
 * usually an abundantly and constantly expressed housekeeping gene * most") Endogenous/Internal Control (Normalization) * usually an abundantly and constantly expressed housekeeping gene * most commonly used ones are the least reliable ones * best to run a validity test for the selected endogenous control * combination may/should be used
Endogenous/Internal Control (Normalization) * usually an abundantly and constantly expressed housekeeping gene * most commonly used ones are the least reliable ones * best to run a validity test for the selected endogenous control * combination may/should be used
") Endogenous Control Selection Sabek et al. Transplantation 2002 (www)
Endogenous Control Selection Sabek et al. Transplantation 2002 (www)
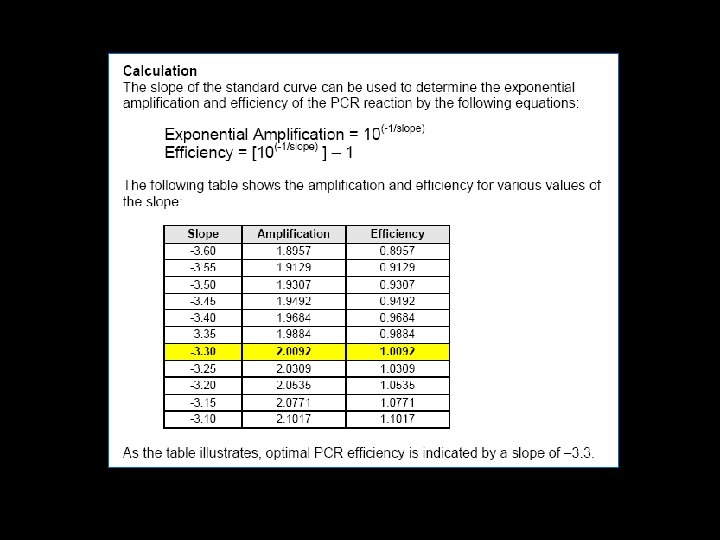
 Efficiency The slope of the log linear phase is a reflection of the amplification efficiency The efficiency of the reaction can be calculated by the following equation: Eff=10( 1/slope) – 1. The efficiency of the PCR should be 90 100% (ideal slope = 3. 3) A number of variables can affect the efficiency of the PCR. These factors can include length of the amplicon, secondary structure, and primer design, to name a few Approximation vs Pfaffl method (Efficiency Determination)
n Xn = PCR") Using the PCR Equation Xn Xn = X 0(1 + E)n Xn = PCR product after cycle n X 0 = initial copy number E = amplification efficiency n = cycle number X 0 cycle number
Using the PCR Equation Xn Xn = X 0(1 + E)n Xn = PCR product after cycle n X 0 = initial copy number E = amplification efficiency n = cycle number X 0 cycle number
n Case 1: E = 0. 9") Effect of Amplification Efficiency Xn = X 0(1+E)n Case 1: E = 0. 9 Case 2: E = 0. 8 Xn = 100 (1+0. 9)30 Xn = 100 (1+0. 8)30 Xn = 2. 3 x 10¹⁰ Xn = 4. 6 x 10⁹ Result A difference of 0. 1 in amplification efficiencies created a five fold difference in the final ratio of PCR products after 30 cycles
Effect of Amplification Efficiency Xn = X 0(1+E)n Case 1: E = 0. 9 Case 2: E = 0. 8 Xn = 100 (1+0. 9)30 Xn = 100 (1+0. 8)30 Xn = 2. 3 x 10¹⁰ Xn = 4. 6 x 10⁹ Result A difference of 0. 1 in amplification efficiencies created a five fold difference in the final ratio of PCR products after 30 cycles
, target gene 1 (Tyr.") Determination of real time PCR efficiencies of reference gene (Gst), target gene 1 (Tyr. A) and target gene 2 (Pyr. B). CP cycles versus c. DNA (reverse transcribed total RNA) concentration input were plotted to calculate the slope (mean ± SD; n = 3). The corresponding real time PCR efficiencies were calculated according to the equation: E = 10[– 1/slope]
Determination of real time PCR efficiencies of reference gene (Gst), target gene 1 (Tyr. A) and target gene 2 (Pyr. B). CP cycles versus c. DNA (reverse transcribed total RNA) concentration input were plotted to calculate the slope (mean ± SD; n = 3). The corresponding real time PCR efficiencies were calculated according to the equation: E = 10[– 1/slope]
 If the CT values for each of the dilutions are plotted against concentrations, the result should be a linear graph with a high correlation coefficient (> 0. 99). The slope of this graph is also a measure of efficiency, and can be readily used to calculate efficiency this is done by most software (i. Cycler, for example).
") Nigel Walker, NIEHS (www)
Nigel Walker, NIEHS (www)
") Nigel Walker, NIEHS (www)
Nigel Walker, NIEHS (www)
 Assay Validation * Test primer pairs in all combinations with the probe with a known template (plasmid clone, s. DNA, RNA) * Use standard assay conditions: 300 400 n. M primers; 100 n. M probe, 3 m. M Mg. Cl 2 * Choose the primer pair that gives the highest Rn and the lowest CT * Make a dilution of a template, either s. DNA, s. RNA or total RNA for a standard curve * Correlation coefficient of the standard curve > 0. 99? * If the slope of the standard curve of the best primer pair is around 3. 5 increase the Mg. Cl 2 to 5 m. M * If the slope is higher than 3. 6, change primers * An ideal assay will have a slope of 3. 3
 One Step or Two Step PCR * one step real time RT PCR performs reverse transcription and PCR in a single buffer system and in one tube * in two step RT PCR, these two steps are performed separately in different tubes
 The really big deal • Isolation of DNA polymerase from Thermus • aquaticus (Mullis and Faloona 1987) • • T. aquaticus is a hot springs bacterium • • Therefore, has thermally stable DNA • polymerase (e. g. not killed by heat)
 Importance of T. aquaticus • • • Extension at 72 C: Most polymerases are active at 45 C or below (e. g. normal body/environmental temps)-temps below normal annealing temps-results in nonspecific binding of primers 2. From Bacterium that lives in near boiling water: Most polymerase inactivated by high temperatures-initially had to add new polymerase each cycle
 CPSC 265 Class 8
 Cloning • Cloning is the way in which we can take a single molecule, and make lots of bacterial cells that contain an identical molecule. • These cells are clones, hence the name • This used to be the only way to amplify DNA. It is still by far the most accurate.
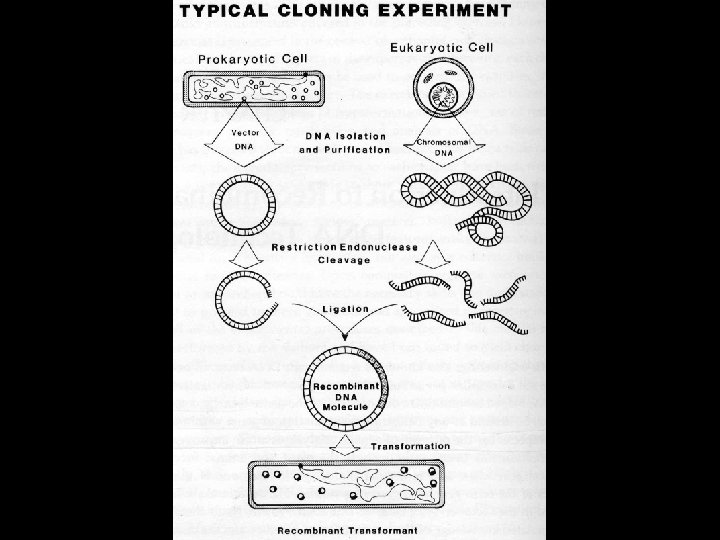
 Plasmid vectors – circular, autonomous bacterial DNA
 The vector is made with a “T” overhang
 Taq polymerase leaves an “A” overhang • Taq is thermostable DNA polymerase from Thermus aquaticus we used for PCR. • When Taq synthesizes a new strand, it always puts an extra “A” at the end • This can be useful, but note: other polymerases do not do this, they leave “blunt” ends. Only Taq polymerase leaves ‘A’ overhangs. ‘Blunt’ end vectors do not work with Taq, we need a ‘T’ overhang.
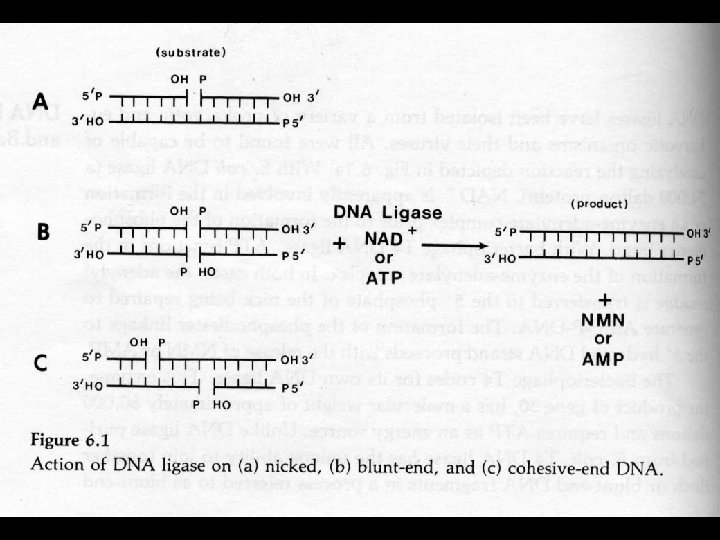
 DNA ligase • Repairs gaps in the sugar-phosphate backbone of DNA • Creates phosphodiester bonds • Does not do anything with the bases
 Transformation of bacteria • Two main methods for transformation • Chemical / Heat Shock As done in last practical, this method gets DNA into the cell by making them porous using Ca. Cl 2 and a 42 C heat treatment • Electroporation Makes cells porous using high-voltage electricity
 Imperfect science • Most of the plasmid / insert combinations will not ligate • Most of the bacteria will not be transformed • We only need one molecule to get into one bacterium to make one colony.
 PCR from clones • Often clones will religate containing any old DNA (eg primer dimers). . • The DNA can go in in either orientation • We can use the PCR to tell which colonies have the insert we want, and which orientation it is in.
 Some population genetics software Microsatellite toolkit: Excel plug-in for creating Arlequin, FSTAT and Genepop files. Microchecker: Estimate null allele frequency. Adjust allele frequencies. Arlequin: HW equilibrium, Linkage Disequilibrium, Fst, exact test of differentiation, Amova, Mantel test FSTAT: Allelic richness, Fst per locus (to check contribution of each locus to observed pattern of differentiation) Structure, BAPS: Population structuring, population assignment. Migrate: Estimates of effective population size and migration rates Bottleneck: Check for very recent population bottlenecks