

8b6a8f83bc831ddf8f6e2f8b98de2d83.ppt
- Количество слайдов: 47
 Plan
Plan
 What GDA is • A software suite for synchrotron experiment control and data collection • Jointly developed by staff/developers from – DASC (Data Acquisition and Scientific Computiing Group) at Diamond Light Source Ltd, Rutherford Appleton Lab, Chilton, UK – SRCG (Synchrotron Radiation Computing Group) at Daresbury Lab, Warrington, UK • Our aim is to develop an Integrated Science Experiment Environment for synchrotron users at Diamond and SRS Now
 Diamond House
 Diamond Floor Plan • Diamond House
 Experimental stations Phase II: 15 beamlines completed by 2012 Phase I: 7 beamlines - 2007 Radio Frequency cavities Storage ring Beamline Booster synchrotron LINAC
 Interior of Diamond
 Diamond Constraints • • • Up to 32 beamlines each covering a different area of scientific research. More than 1000 scientific proposals accepted per year with varying durations, some as short as 8 hours. Typically more than 3000 different scientific users will access the facility in one year. Possibly up to 1000 Terabytes of data collected per year in more than 10, 000 files. These data files will need to be catalogued and accessed remotely.

 All have common underlying software I 16 Materials and") Diversity of Beamlines (some examples) All have common underlying software I 16 Materials and Magnetism I 06 Nanostructures I 15 Extreme Conditions I 11 Powder Diffraction I 03 Macro Molecular Crystallography
Diversity of Beamlines (some examples) All have common underlying software I 16 Materials and Magnetism I 06 Nanostructures I 15 Extreme Conditions I 11 Powder Diffraction I 03 Macro Molecular Crystallography
 Diamond Overall Requirements • • • Users are uniquely identified and should need to log in once only for all aspects of the experiment. Users can move from beamline to beamline as easily as possible. Common scripting environment across all beamlines. Remote access including role based access control. Data migration is automatic from beamlines to externally accessible repository. Data evaluation and reduction as close to online as possible. Integration of data reduction and analysis workflows. Metadata in files sufficient for data analysis Seamless access to remote large computing resources.
 Single Sign On 1. 2. 3. 4. 5. The aim of this project was to provide a mechanism for uniquely identifying users of UK large scientific facilities irrespective of their method of access. All users of the major facilities will need only one username/password combination to access any of the facilities. These credentials or an automatically generated certificate or token will allow access to any computing technology given the correct authorization. The authorization will be performed locally by the facility involved based on the single unique identifier derived from 13. Partners: STFC, e-Science, SRS, ISIS, Diamond
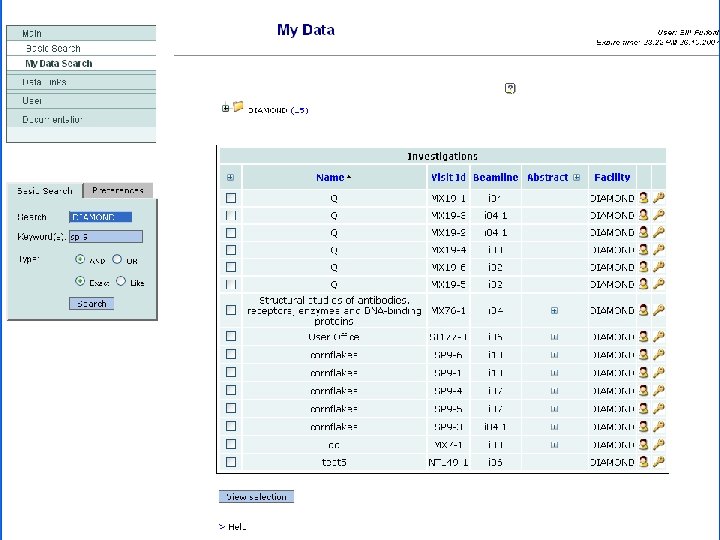
 • • Beamline") Beamline and Data Access All based on Single Sign On (SSO) • • Beamline Access – – – Authorized remote beamline control and processing monitoring Integrated data reduction/analysis for real-time visualisation Configurable experiment environments – – – Authorized remote access to data and metadata catalogues Location independent user interface: SRB Scheduled data migration to central data store (DCC) Web user interface. (for secure ftp) Searchable metadatabase: Standardized metadata description Adoption and support for a minimal set of descriptive data formats: Ne. Xus: (http: //www. nexusformat. org/Main_Page) and image. CIF Data Access (http: //www. iucr. org)
Beamline and Data Access All based on Single Sign On (SSO) • • Beamline Access – – – Authorized remote beamline control and processing monitoring Integrated data reduction/analysis for real-time visualisation Configurable experiment environments – – – Authorized remote access to data and metadata catalogues Location independent user interface: SRB Scheduled data migration to central data store (DCC) Web user interface. (for secure ftp) Searchable metadatabase: Standardized metadata description Adoption and support for a minimal set of descriptive data formats: Ne. Xus: (http: //www. nexusformat. org/Main_Page) and image. CIF Data Access (http: //www. iucr. org)
 Design considerations • A single software framework to all beamlines • Similar look and feel across all beamlines – Reduce users’ learning requirement – Common scripting environment • Flexible, adaptable, configurable, and “plug-play” where possible. • Support both EPICS and non-EPICS hardware • Single integrated science experiment environment • Customisable GUIs and configuration • An open framework that is easy to extend • A system that is simple and easier to maintain
 Generic Data Acquisition Overview • • • What GDA is GDA architecture and components User Interfaces Scripting tools Embedded Editors Supported Detectors EPICS Interfaces Extension mechanism Data management and visualisation GDA deployments
 Design choices • Java as the main programming language – – platform independent opportunity to use open source tools – – simple syntax, which we can extend as required very close relationship to Java – – ‘thin’ client programs with multiple servers Reusable components – adaptable for special experiment requirement. Extensible with well defined interfaces – enable independent specialist developments. Self-descriptive controls with GUI and scripting assistance. more flexible design for future work • Jython as the scripting language • Distributed design – – –
 GDA fundamentals • Java as the main programming language – Java 1. 6 platform independent • Jython as the scripting language with essentially the same syntax as python – Jython 2. 2 or later, very close integration with Java • XML configuration – Beamline configuration: device objects – Software integration: EPICS etc • Distributed system – ‘thin’ clients with multiple servers – Reusable & configurable components • Use many open source tools, components – Castor, CAJ, Jacorb, Apache software, etc
 GDA Architecture • • The Core of GDA – structured in a 3 -layer architect – with CORBA backbone for control and update – Top: GUI, OE representation & data visualisation – Middle: Command server, Control request & logics – Bottom: Device server, drivers and controllers Many other services – Messages, logging, data curation, etc
 Scripting Editor Tear off Scripting GUI Scripting Console
 Scripting Tools • • • Embedded Jython interpreter/editor in the Java Application – Give direct access to java objects Terminal window for command line interface Scripts are processed in the Command Server Scanning Framework – Manage and monitor scan processes – Build-in commands: scan, gscan, cscan, tscan Extensible syntax – Possible emulation of spec, pincer, etc Script editor
 Components
 EPICS Interface • XML Interfaces – – XML files describing the interface specification Generated from EPICS databases Config. xml : Specify beamline operation modes Devices. xml: device instance available and its type – Types. xml: interface and subsystem definitions • XML schema (epicsgda. xsd) – Define the XML file structures and interface types – generate object marshall/unmarshall codes – Minimise change impacts between GDA and EPICS
 Hardware facility Support • User Workstation – Support both Windows PC and Linux PC • Data Storage Disk Array – RAID 5, 1 -20 Terabytes on the beamline (short term) – Possible data store with Data Curation Centre (long term) • Data Backup – CD/DVD writer, docking for external Hard drive, etc. • Computing resources – Multiprocessor Rack (Optional) • Network connection – Visitor subnet – Wireless Access Point
 Examples of Area Detectors Supported ADSC 315 CCD 4096 x 4096 RAPID II Gas detector 4096 x 4096 XPress Germanium Strip 9 x 4096 Vortex Silicon Drift > 1024 MAR 345 Image Plate Oxford Diffraction CCD Ruby/Onyx 2048 Pilatus 2 M CCD 1475 x 1679 Pilatus P 100 k CCD 487 x 195
 Template Computer System
 Typical Beamline Computing Components
 Data Migration Strategy
 Metadata Items – 3 layer model The concept is that the file should contain sufficient metadata to allow subsequent analysis. 1) General – date, title, proposal number, visit, user, beamline 2) Beamline specific – positions of beamline components, sample to detector, detector type 3) Experimental – beam current, duration of scan(s), log of activity, user comments, …
 GDA HE 458 John Smith JS 06 Detector Control Meta.") Detector Data Handler (DDH) GDA HE 458 John Smith JS 06 Detector Control Meta. Data DDH Data + Meta. Data Nexus Format Data X-ray Detector Data Beamline Storage Disk 5 -20 Tb ATLAS Centre Tape Storage (via SRB) • Automatic data backup via grid Storage Resource Broker (SRB) • Add meta-data (eg. Experiment name) to data • Format data (default: Nexus) • Transfers data into SRB at ~30 MB/s • Preliminary tests are very successful. Data + Meta. Data
Detector Data Handler (DDH) GDA HE 458 John Smith JS 06 Detector Control Meta. Data DDH Data + Meta. Data Nexus Format Data X-ray Detector Data Beamline Storage Disk 5 -20 Tb ATLAS Centre Tape Storage (via SRB) • Automatic data backup via grid Storage Resource Broker (SRB) • Add meta-data (eg. Experiment name) to data • Format data (default: Nexus) • Transfers data into SRB at ~30 MB/s • Preliminary tests are very successful. Data + Meta. Data
 Data Volume Estimates MX - 2 Tb/day per beamline (measured at ESRF with ADSC 315) 1. 2. 3. 4. 5. x 3 for I 02, I 03, I 04 = 6 Tb/day %3 for compression, assuming CPU available =2 Tb/day Beamline store ~ 20/0. 67 = 30 days Intermediate duration ~ 180/2 = 90 days (say 2 months) Number of files > 10, 000 1. 2. 3. 4. 5. 4 Mb/sec peak x 2 (2 beamlines) Assume 25% duty cycle. 2 x (4/4) * 3600 * 24 = 0. 86 Tb/day %3 for compression, assuming CPU available ~ 0. 5 Tb/day Intermediate duration ~ 20/0. 25 = 80 days Number of files > 10, 000 1. 2. 3. 4. 5. 0. 5 Mb/sec x 3 (3 beamlines) Assume 25% duty cycle 3 x (0. 5/4) * 3600 * 24 = 0. 15 Tb/day %3 for compression, assuming CPU available ~ 0. 05 Tb/day Intermediate duration ~ 20/0. 05 = 400 days Number of files > 20, 000 NCD and Imaging (I 18, I 22) Experiment (I 06, I 15, I 16) Load on central server ~ 2. 6 Tb/day
 Data Visualization • • Integrated Data Visualisation Tools – 1 D, 2 D, 3 D – In processing of integration – Data fitting Integration with IDL – Direct access to IDL objects to display data
 NCD peak find
 Visualization in GDA 1 D Plot 2 D Plot Fourier Transforms 3 D Plot Image overlay
 Embedded Analysis
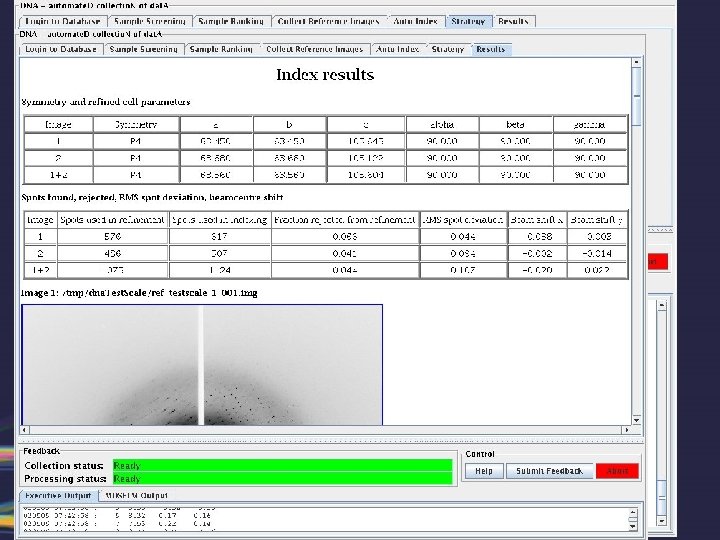
 Image Display/Analysis
 Example Detector Interface
 Data Analysis Framework The central concept is allow data processing to proceed in a series of discrete steps with decision process being possible between each. Typically the overview of this data processing pipeline would be a UML modelling diagram or , more commonly, a flow diagram. The advantages of separating the data analysis into discrete sequences of steps: 1. The processing programs themselves may be step based 2. The programs may be available in binary only for a particular computer architecture 3. The programs may be distributed over different machines particularly should their processing requirements be large. 4. Assuming that Single Sign On (SSO) is functioning it should be practical to perform this processing distribution to GRID resources such as SCARF or HPCX and avoid the necessity to enter authentication at every step. 5. It is possible to use the decision process to proscribe different processing branches depending on the results of a particular sequence step. 6. Automate potentially large numbers of processing steps to be performed without user intervention.
 Embedded Analysis
 Visualization in GDA 1 D Plot 2 D Plot Fourier Transforms 3 D Plot Image overlay
 Extension mechanism and futures • • • Support 3 rd party software as plugins to GDA Simple to use by copy/drag-drop and configure Currently only GUI Panel based – motion control OE plugin – Data analysis plugin Standard location for the extension jars – Enable auto class load at start Configuration - XML
 Linking into experiment pipelines e. g. Crystallisation Data Collection Phasing Protein Production Protein Structure Target Selection Structure analysis Deposition
 Dream for NCD
 Dream for NCD
 Current Position
 Medium Term Planning
 Geoff Mant Paul") Acknowledgement • SRS Staff – – – – Greg Diakun (Head) Geoff Mant Paul Stephenson Karen Ackroyd Glenys Mc. Bain Steve Kinder Christine Ramsdale Mike Miller • DLS Staff – – – – Bill Pulford (Head) Paul Gibbons Alun Ashton Stuart Campbell Vasanthi Nagaralingam Matt Pearson Eric Ren Jun Aishima Tobias Richter Rob Walton Stuart Robertson Richard Woolliscroft Fajin Yuan Karl Levik Frank Sun
Acknowledgement • SRS Staff – – – – Greg Diakun (Head) Geoff Mant Paul Stephenson Karen Ackroyd Glenys Mc. Bain Steve Kinder Christine Ramsdale Mike Miller • DLS Staff – – – – Bill Pulford (Head) Paul Gibbons Alun Ashton Stuart Campbell Vasanthi Nagaralingam Matt Pearson Eric Ren Jun Aishima Tobias Richter Rob Walton Stuart Robertson Richard Woolliscroft Fajin Yuan Karl Levik Frank Sun