df27d2daf01b1b3beab33e18f488c901.ppt
- Количество слайдов: 156
 PHYSICIANS FOR A NATIONAL HEALTH PROGRAM 29 EAST MADISON SUITE 602 CHICAGO, IL 60602 TEL: (312) 782 -6006 WWW. PNHP. ORG
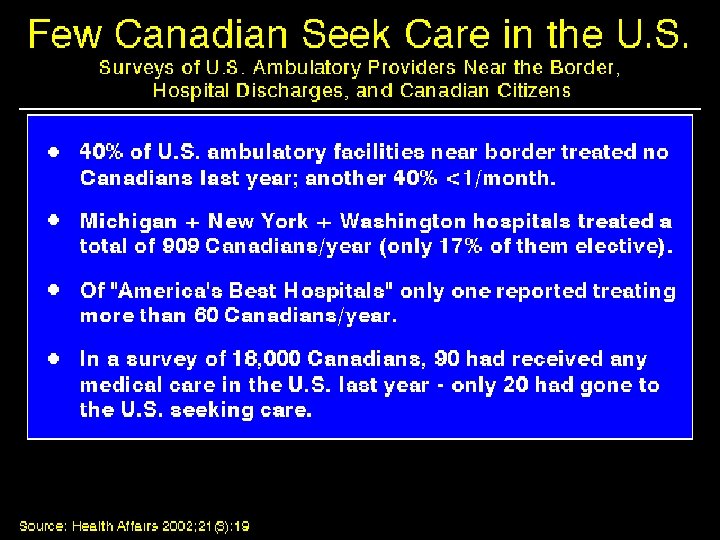
 Who Are The Uninsured? *Students>18, Homemakers, Disabled, Early retirees Source: Himmelstein & Woolhandler - Tabulation from 1999 CPS
 Chronically Ill and Uninsured
 Unmet Health Needs of the Uninsured
 18, 314 Adult Deaths Annually Due to Uninsurance
 Full Time Jobs Provide Little Protection for Hispanics Source: Commonwealth Fund, 3/2000
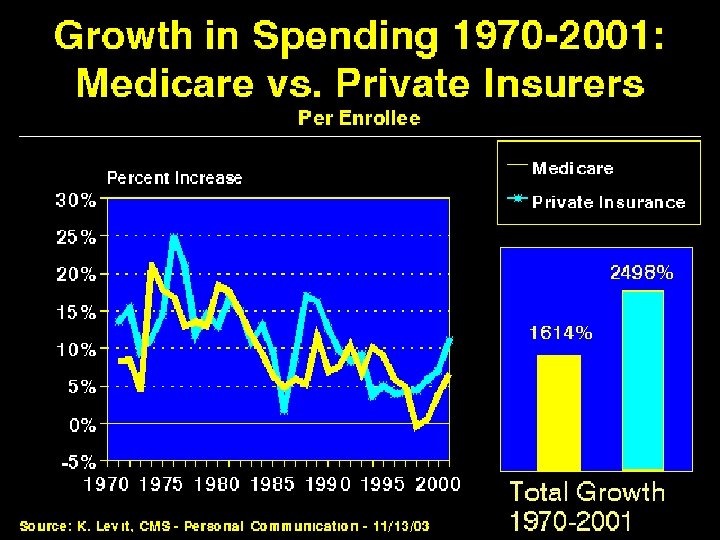
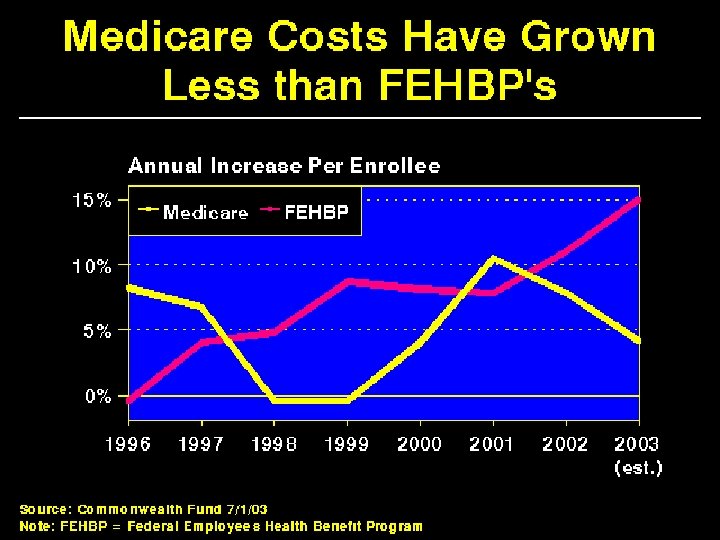
 Rising Out-of-Pocket Costs for Seniors Voucher/Premium Support Proposals Would Worsen Percent of Income Source: Senate Select Committee on Aging; AARP 4/95 & 3/98; and Commonwealth Fund May, 1999 projections (adjusted to include nursing home costs)
: 44") Who Pays for Nursing Home Care? Source: Health Affairs 2000; 19(3): 44
Who Pays for Nursing Home Care? Source: Health Affairs 2000; 19(3): 44
 Illness and Medical Costs, A Major Cause of Bankruptcy • 45. 6% of all bankruptcies involve a medical reason or large medical debt • 326, 441 families identified illness/injury as the main reason for bankruptcy in 1999 • An additional 269, 757 had large medical debts at time of bankruptcy • 7 per 1000 single women, and 5 per 1000 men suffered medical-related bankruptcy in 1999 Source: Norton's Bankruptcy Advisor, May, 2000
 Many With Insurance Lack Choice 42% Are Offered Only 1 Plan Note: Those without choice were 70% more likely to give their plan a low rating Source: Health Affairs 1998; 17(5): 184
 Patients Refused Authorization for ER Care • 8% to 12% of HMO patients presenting to 2 ERs were denied authorization • • Authorization delayed care by 20 to 150 minutes Of those denied: 47% had unstable vital signs or other high risk indicators 40% of children were not seen in f/u by primary MD Eventual diagnoses included: meningococcemia (2), ruptured ectopic (2), shock due to hemorrhage (2), septic hip, PE, MI (2), ruptured AAA, pancreatitis, peritonsillar abscess, small bowel obstruction, unstable angina, pneumothorax, appendicitis, meningitis(3) Source: J Emerg Med 1997; 15: 605; Acad Emerg Med 1997; 4: 1129; Ann Emerg med 1990; 19: 59
 Financial Suffering at the End of Life Source: Ann Int Med 2000; 132: 451 - Study of 988 terminally ill patients * Out-of-pocket medical costs > 10% of household income ** Patient or family sold assets, took out mortgage, used savings or took extra job
 Why Women Delay Prenatal Care When They Know They Are Pregnant Note: 11. 1% of pregnant women failed to get timely prenatal care despite knowing they were pregnant Source: MMWR 5/12/2000; 49: 393
 Distribution of Wealth, 1976 & 1998
 Poverty Rates, 1997 U. S. and Other Industrialized Nations Source: Luxembourg Income Study Working Papers Note: U. S. figure for 1997, other nations most recent available year
 Americans Lead the World in Hours Worked Source: International Labor Organization, 1999
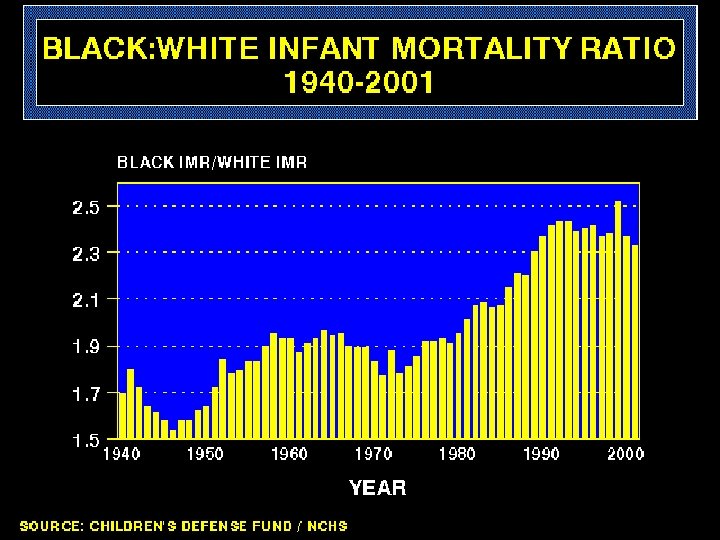
 Causes Of Excess Deaths Among African Americans Cardiovascular 39% Source: Himmelstein & Woolhandler - Analysis of data from NCHS Cardiovascular 25%
 Racial Disparity in Access to Kidney Transplants
 Pharmacies in Minority Neighborhoods Fail to Stock Opioids Source: N Engl J Med 2000; 242: 1023
 Minority Physicians Provide More Care for the Disadvantaged Ethnicity of Physician Source: AJPH 1997; 87: 817
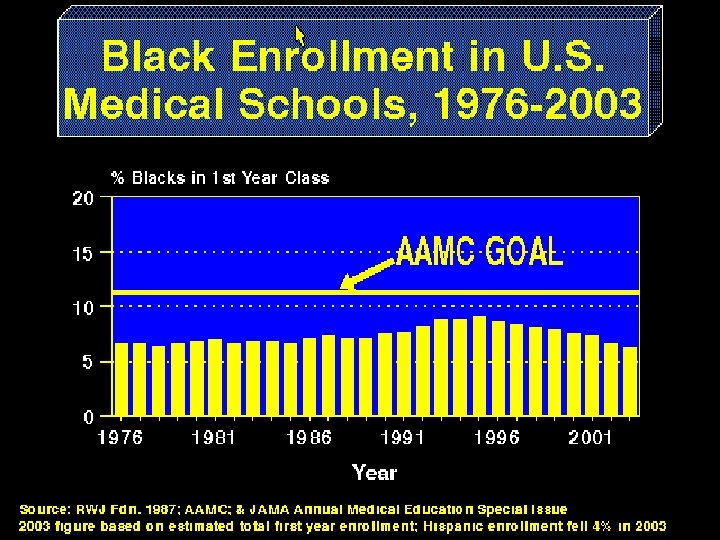
 Are Emily and Brendan More Employable than Lakisha and Jamal?
 Growth of Registered Nurses and Administrators 1970 -2002 Source: Bureau of Labor Statistics & Himmelstein/Woolhandler/Lewontin Analysis of CPS data
 Growth of Physicians and Administrators 1970 -2002 Source: Bureau of Labor Statistics & NCHS
 High Risk HMO Patients Fared Poorly in the Rand Experiment Source: Rand Health Insurance Experiment, Lancet 1986; i: 1017 Note: High Risk = 20% of population with lowest income + highest medical risk
 The Elderly and Sick Poor did Worse in HMOs Changes in Physical Health at 4 Years Source: Medical Outcomes Study - JAMA 1996; 276: 1039
 Elderly HMO Stroke Patients Get Less Specialist Neurology Care Source: Medical Care 1999; 37: 1186 Note: Patients receiving specialist neurology care had 23% lower 1 year mortality
 HMOs' Stroke Patients: Fewer Go Home or to Rehab, More to Nursing Homes Source: JAMA 1997; 278: 119
 HMOs Push Heart Surgery Patients to High-Mortality Hospitals Source: JAMA 2000; 283: 1976 *CABG = coronary artery bypass graft surgery
 Depressed Patients: Fee-for Service Vs. Managed Care Fee-For-Service Managed Care 53. 7% 60. 7% 41. 8% 46. 4% 1. 3 1. 2 1. 5 2. 0 Primary Care Patients Depression Detected Appropriately Treated Patients Seeing Psychiatrist # Functional Limitations - Baseline # Functional Limitations - 2 Years SOURCE: Medical Outcomes Study - JAMA 1989; 262: 3298 & Arch Gen Psych 1993; 50: 517
 Managed Mental Health: Audit Report • • Plans overstated utilization by 45% • • Plans rarely site-visited or interviewed providers • • Quality problem in 30 -58% of charts reviewed • Overhead + profit NEVER consumed < 45% of premiums Delay from initial call to starting care > contractor's written standard by 97%-347% No providers in 15% of counties "covered"; no child provider in 25% of counties Criteria for inpatient care dangerously restrictive (eg. requiring DTs prior to detox admit) Source: J. Wrich - Audit findings submitted to CBO, 3/98
 Primary Care Physicians: Patients Can't Get Quality Mental Health Services Source: Center for Studying Health System Change, 1997 - survey of 5, 160 primary care physicians Note - Data shown are for inpatient care; responses regarding outpatient care were similar
 States that Limit New Heart Surgery Programs: Higher Volumes, Lower Mortality
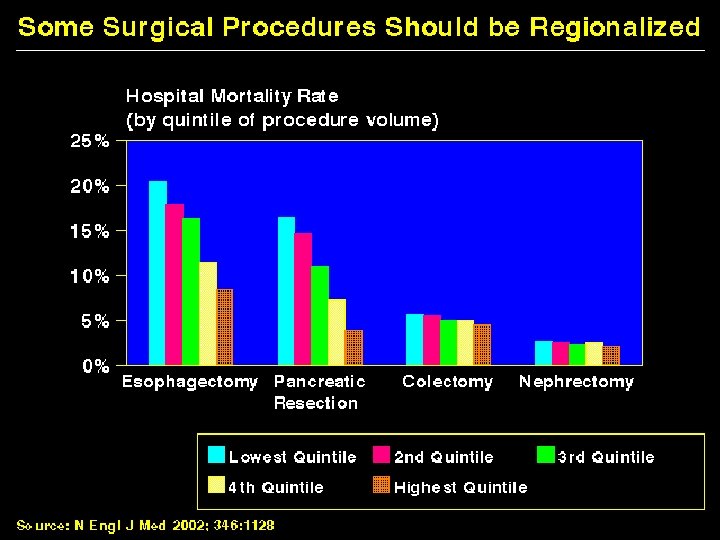
 Unnecessary Procedures
 Seniors Without Drug Coverage Forego Cardiac Medications
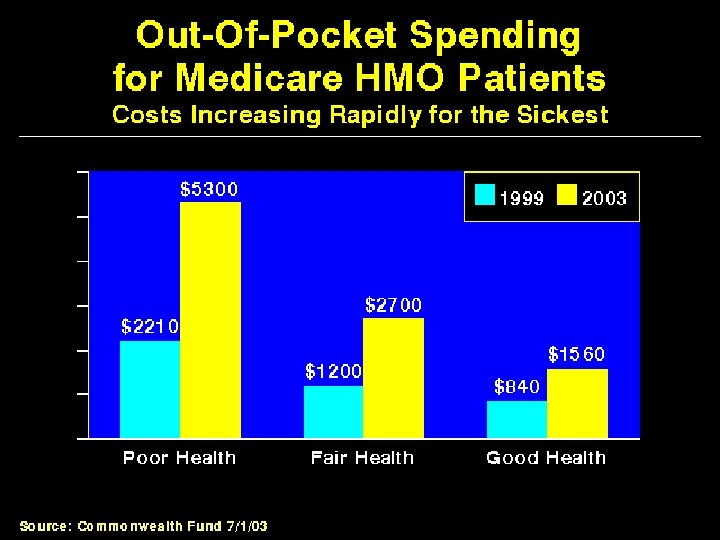
 Out-of-Pocket Costs for Medicare HMO Enrollees, 1999 -2002
 Can Seniors Make Informed HMO Choices? Proportion with Knowledge of How HMOs Work Source: AARP Survey - Health Affairs 1998; 17(6): 181
 Medicare HMOs: The Healthy Go In, The Sick Go Out * Data are for 12 month period before joining HMO ** Data are for 3 month period after leaving HMO Source: N Engl J Med 1997; 337: 169
 For-Profit HMOs’ Increasing Dominance, 1985 -2000 Source: Interstudy
 Investor-Owned HMOs Provide Lower Quality Care Source: Himmelstein, Woolhandler, Hellander & Wolfe - JAMA 1999; 282: 159
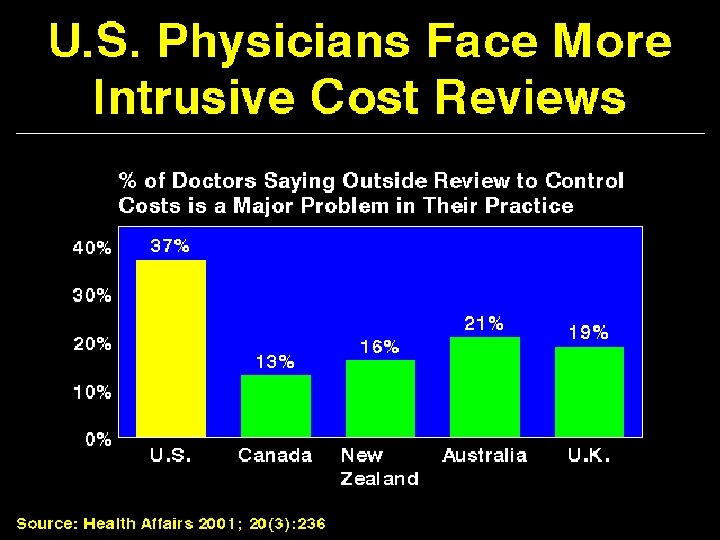
 “Productive” Physicians, Worse Care Physician Practice Style Note: Fast physicians = those seeing more pts. /hour than average Slow Physicians = those seeing fewer pts. /hour than average Source: Arch Int Med 1999; 159: 294
![Doctors Urged to Shun the Sick “[We can] no longer tolerate patients with complex](https://present5.com/presentation/df27d2daf01b1b3beab33e18f488c901/image-56.jpg "Doctors Urged to Shun the Sick “[We can] no longer tolerate patients with complex") Doctors Urged to Shun the Sick “[We can] no longer tolerate patients with complex and expensive-to-treat conditions being encouraged to transfer to our group. ” -Letter to faculty from University of California Irvine Hospital Chief Source: Modern Healthcare, 9/21/95: 172.
Doctors Urged to Shun the Sick “[We can] no longer tolerate patients with complex and expensive-to-treat conditions being encouraged to transfer to our group. ” -Letter to faculty from University of California Irvine Hospital Chief Source: Modern Healthcare, 9/21/95: 172.
 Corporate Social Responsibility? “Few trends could so thoroughly undermine the very foundations of our free society as the acceptance by corporate officials of a social responsibility other than to make as much money for their shareholders as possible. ” Milton Friedman, 1962 Source: Milton Friedman - Capitalism & Freedom, 1962.
 Health Insurers' Tobacco Habit Stock Holdings in 1999 - $ Millions Prudential Met. Life/ Travelers Cigna RJ Reynolds $137. 2 - - Philip Morris $435. 2 $55. 3 $38. 6 Loews (Kent etc. ) $319. 6 $6. 8 $4. 1 Source: Boyd, Himmelstein & Woolhandler - JAMA 8/9/2000
 Milliman & Robertson Pediatric Length of Stay Guidelines • • • 1 Day for Diabetic Coma 2 Days for Osteomyelitis 3 Days for Bacterial Meningitis “They're outrageous. They’re dangerous. Kids could die because of these guidelines. ” Thomas Cleary, M. D. Prof. of Pediatrics, U. Texas, Houston Listed as "Contributing Author" in M&R manual Source: Modern Healthcare May 8, 2000: 34
 Milliman & Robertson “We do not base our guidelines on any randomized clinical trials or other controlled studies, nor do we study outcomes before sharing the evidence of most efficient practices with colleagues. ” Wall Street Journal 7/1/98
 Medicare Costs Rose Faster in Communities with For-Profit Hospitals $5, 148 $3, 556 $3, 990 Note: For-profit=HSA with only for-profit hospitals (n=208) Non-profit=HSA with only non-profit hospitals (n=2860) Source: Silverman, Fisher & Skinner - NEJM 1999; 341: 420 $4, 427
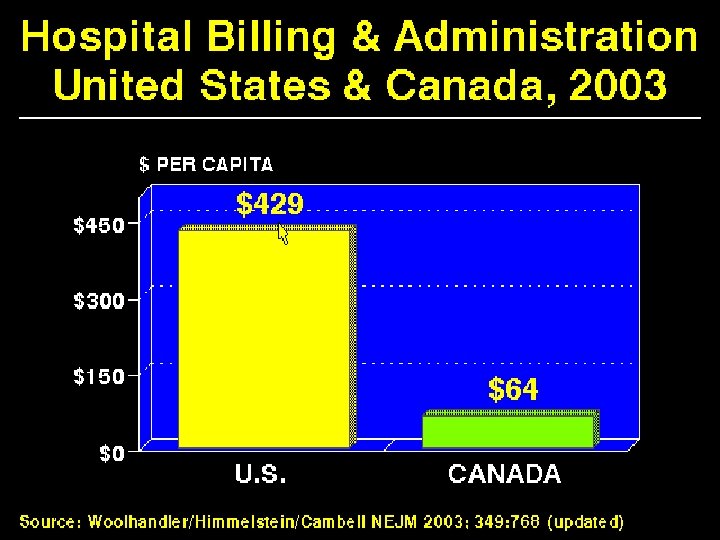
 Why Are For-Profit Hospitals Costlier? Higher Administrative and Non-Personnel Costs $8, 115 $7, 490 $6, 507 Source: Woolhandler & Himmelstein - NEJM 3/13/97 - Analysis of data from 5201 acute care hospitals Note: Costs are for FY 1994, adjusted for hospital case mix and local wages
 Death Rates are Higher at For-Profit Hospitals * 85. 5% Non-Profit, 14. 3% Government, 0. 2% For-Profit Source: NEJM 1999; 340: 293
 Death Rates Were Higher at For-Profit Hospitals in 1989 *Member of Council of Teaching Hospitals Source: NEJM 1989; 321: 1720
 VA Quality of Care for MI Patients: Better than Other Hospitals
 More Nurses, Fewer Complications A Study of 589 Hospitals in 10 States • A 1 hour increase in RN hours/patient day was associated with: 8. 4% decrease in post-op pneumonia 5. 2% decrease in post-op thrombosis 3. 6% decrease in post-op pulmonary compromise 8. 9% decrease in post-op UTIs • For-profit hospitals had higher rates of post-op pneumonia, pulmonary compromise & UTI, even after control for their lower RN staffing Source: Kovner & Gergen - Image: J Nurs Schol 1998; 30: 315
 Fewer Nurses, Worse Hospital Outcomes
 Nursing Home Staffing Low Standards, Poor Working Conditions • Required: 1 RN - 8 hrs/day, 1 LPN - 24 hrs/day • RNs + LPNs = only 30% of nursing staff • Pay = 15 -20% below hospitals • Turnover rates = 80 -100%/year Source: C. Harrington, UCSF - 1997
 For-Profit Dialysis: More Deaths, Fewer Transplants Note: Figures are adjusted for demographic factors and co-morbidities Source: NEJM 1999; 341: 1653
 For Profit Dialysis For Children: Less Use of Peritoneal Dialysis Source: Pediatrics 104: 519
 End Stage Renal Disease Care 85% of U. S. Providers are For-Profit, Outcomes are Worse than Canada's • U. S. death rates for dialysis patients are 47% higher after control for age, sex, race & comorbidities • • Canadians get more transplants (35% vs. 17%) • • Costs lower in Canada by $503/patient/month 57% of U. S. patients were treated with reprocessed dialyzers, 0% in Canada Fresenius (a German firm) controls 24% of U. S. market; profit = $225/patient/month Source: Med Care 1997; 35: 686 & Fresenius SEC filings, 2000
 Investor-Owned Care Summary of Evidence • • • Hospitals: Costs 3%-11% higher, fewer nurses, higher overhead, death rates 6%-7% higher, fraud HMOs: Higher overhead, worse quality, collaboration with tobacco industry Dialysis: Death rates 20% higher, less use of transplants & peritoneal dialysis, fraud Nursing Homes: More citations for poor quality, fraud Rehab Hospitals: Costs 19% higher
 Crime Pays: CEOs Who Cook the Books Earn More
 U. S. Seniors Paying More for Ten Top Selling Drugs* Source: U. S. GAO – www. house. gov/bernie/legislation/pharmbill/international. html *Zocor, Ticlid, Prilosec, Relafen, Procardia XL, Zoloft, Vasotec, Norvasc, Fosamax, Cardizem CD
 Millions Can’t Afford Prescriptions
 Drug Firms Avoid Taxes Source: Congressional Research Service, 12/13/1999 Note: Figures are industry-wide averages for 1993 -1996
 Drug Company Marketing, 19962001
") Drug Company Sponsored Miseducation • • • Spending for drug promotion (>$10 billion/yr. ) exceeds total medical student teaching costs The average MD meets with one of the 56, 000 drug reps once a week Attending drug company-sponsored CME predicts worse prescribing 11% of drug reps’ factual claims are false (all favorable) - 26% of MDs recognize even one falsehood 30% of journal drug ads falsely claim "drug of choice", 40% omit key side effect info Source: JAMA 283: 373 & 273: 1296, Ann Int Med 116: 919, and www. nofreelunch. org
Drug Company Sponsored Miseducation • • • Spending for drug promotion (>$10 billion/yr. ) exceeds total medical student teaching costs The average MD meets with one of the 56, 000 drug reps once a week Attending drug company-sponsored CME predicts worse prescribing 11% of drug reps’ factual claims are false (all favorable) - 26% of MDs recognize even one falsehood 30% of journal drug ads falsely claim "drug of choice", 40% omit key side effect info Source: JAMA 283: 373 & 273: 1296, Ann Int Med 116: 919, and www. nofreelunch. org
 Percent of Population with Government-Assured Insurance Note: Germany does not require coverage for high-income persons, but virtually all buy coverage Source: OECD, 2002 - Data are for 2000 or most recent year available
 Federal Tax Subsidies for Private Health Spending, 1998 Note: Total federal tax subsidy = $111. 2 billion Source: Health Affairs 1999; 18(2): 176
: 192") Elderly as Percent of Total Population, 2000 Source: Health Affairs 2000; 19(3): 192
Elderly as Percent of Total Population, 2000 Source: Health Affairs 2000; 19(3): 192
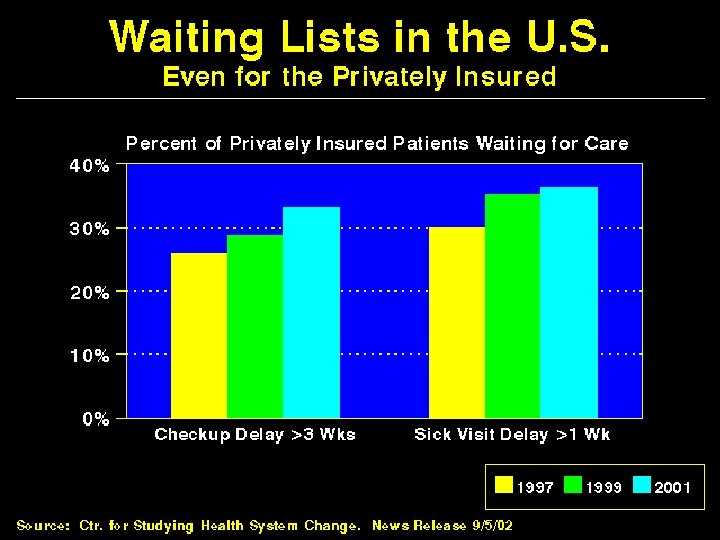
 Difficulties Getting Needed Care Source: Commonwealth Fund Survey, 1998
 Continuity of Care Source: Commonwealth Fund Survey, 1998
 Medical Journal Articles per Capita

 Minimum Standards For Canada's Provincial Programs 1. Universal coverage that does not impede, either directly or indirectly, whether by charges or otherwise, reasonable access. 2. Portability of benefits from province to province 3. Coverage for all medically necessary services 4. Publicly administered, non-profit program
 % Of People With Serious Sx Seeing A Doctor Before And After Passage Of NHP In Quebec Source: NEJM 1973; 289: 1174
 Infant Deaths by Income, Canada 1996 Even the Poor Do Better than U. S. Average
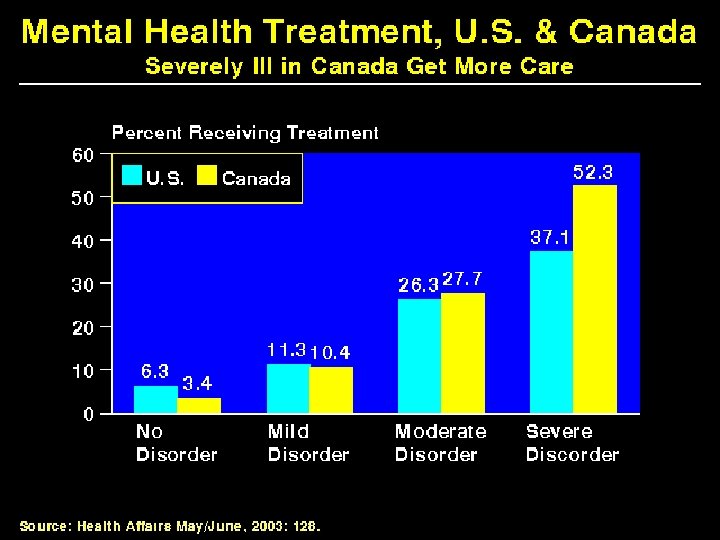
 Depression Management: Better in Canada * Antidepressant prescribed + 4 or more visits Source: JGIM 1998; 13: 77
 Waits for Publicly-Paid Cataract Surgery, Manitoba Longer When Surgeon Also Operates Privately Surgeon Operates in: Source: Medical Care 1999; 37(6 -supplement): JS 187
 Physician Services For The Elderly: Canadians Get More of Most Kinds of Care Source: JAMA 1996; 275: 1410
 Applicants per Medical School Place : JAMA; 282: 892; Canadian Medical Education Statistics, 1999: 150
 Few Canadian Physicians Emigrate
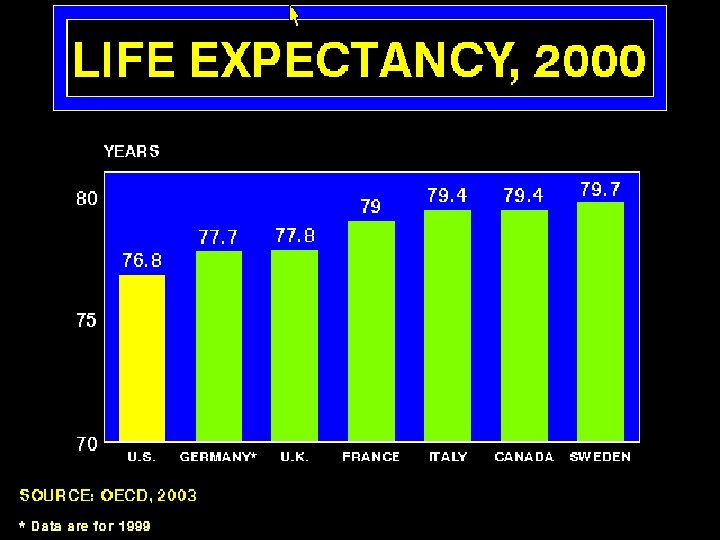
 What's OK in Canada? Compared to the U. S…. • Life expectancy 2 years longer • Infant deaths 25% lower • Universal comprehensive coverage • More MD visits, hospital care; less bureaucracy • Quality of care equivalent to insured Americans’ • Free choice of doctor/hospital • Health spending half U. S. level
 Who Pays For Canada's NHP? Province Of Alberta Source: Premier's Common Future Of Health, Excludes Out-of-Pocket Costs
 Who Pays For Health Care? Regressivity Of U. S. Health Financing Source: Oxford Rev Econ Pol 1989; 5(1): 89
 Employers’ Health Benefit Costs US vs. Canada
 Number of Insurance Products
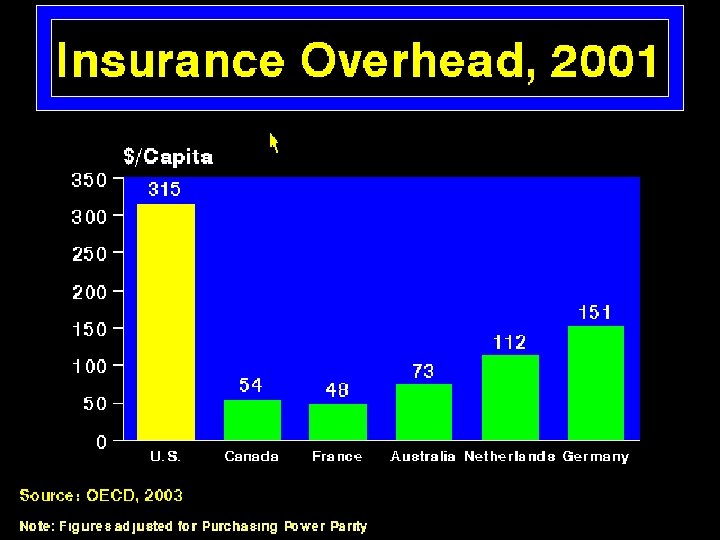
 Private insurers’ High Overhead
 The Healthcare Americans Get • • • 1/3 are uninsured or underinsured HMOs deny care to millions more with expensive illnesses Death rates higher than other wealthy nations’ Costs double Canada's, Germany's, or Sweden's and rising faster Executives and investors making billions Destruction of the doctor/patient relationship
 The Healthcare Americans Want • Guaranteed access • Free choice of doctor • High quality • Affordability • Trust and respect
 How Do We Know It Can Be Done? • Every other industrialized nation has a healthcare system that assures medical care for all • All spend less than we do; most spend less than half • Most have lower death rates, more accountability, and higher satisfaction
 We Have What it Takes • Excellent hospitals, empty beds • Enough well-trained professionals • Superb research • Current spending is sufficient
 Medical Savings Accounts: No Savings • • • Sickest 10% of Americans use 72% of care. MSA's cannot lower these catastrophic costs The 15% of people who get no care would get premium “refunds”, removing their cross-subsidy for the sick but not lowering use or cost Discourages prevention Complex to administer - insurers have to keep track of all out-of-pocket payments Congressional Budget Office projects that MSAs would increase Medicare costs by $2 billion.
 What's Wrong with Tax Subsidies and Vouchers? • • • Taxes go to wasteful private insurers, overhead >13% Amounts too low for good coverage, especially for the sick High costs for little coverage - much of subsidy replaces employer-paid coverage Encourages shift from employer-based to individual policies with overhead of 35% or more Costs continue to rise (e. g. FEHBP) Many are unable to purchase wisely - e. g. frail elders, severely ill, poor literacy
 Non-Group Plans, High Overhead Source: J Health Policy, Pol & Law 2000; 25: 19
 Vouchers by Any Other Name…
 Harris Poll: “Government Should Provide Quality Medical Coverage to All Adults. . . ” Source: USA Today/Harris Poll - 11/23/98
 Even Many Small Business Owners Favor NHI
 Wealth Buys Political Power • The 107, 000 residents of zip code 10021 gave $1. 5 million to 1999 presidential campaigns, and $9. 3 million to 1996 congressional races • The residents of New Hampshire gave $333, 000 to presidential candidates in 1999 • The 9. 5 million people in communities that are > 90% minority gave $5. 5 million in 1996 congressional races • In 1996, 91% of Congressional races were won by the candidate who spent the most • Since 1984, the candidate with the most money on January 1 of the election year always wins his party’s nomination Source: www. publicampaign. org;
 Who Votes? Voter Turnout by Income, 2000
 56% of Medical Students & Faculty Favor Single Payer, Majority of Med School Deans Concur “What is the best health care system for the most people? ” Source: NEJM 1999; 340: 928