

556b7ea290969d6b03e3e8a796872f22.ppt
- Количество слайдов: 79
 Phylogenetic Analysis and Phylogenetic Trees Christoph W. Sensen Trieste Course 2017 csensen@tugraz. at http: //bioinformatics. at/sensencw
 Sequence Alignments Dr. Christoph W. Sensen Email: csensen@tugraz. at
 Topics n n n Introduction to multiple sequence alignments Obtaining and preparing sequences for alignment Automated alignments: Clustalw Manual editing: Gene. Doc Special cases of Multiple Sequence Alignments Output formats
 Introduction to Multiple Sequence Alignments The sole purpose of multiple sequence alignments is to put homologous positions of homologous sequences into the same column. This sounds quite simple, but… it is probably the most complicated problem that bioinformatics has to offer.
 MS Introduction Continued Here is the problem!
 MS Introduction Continued n n It is essential to know as much as possible about the gene in question before trying to create an alignment. This includes knowledge about functional regions and knowledge about the two- and three-dimensional structure, (if available).
 MS Introduction Continued n n The “simple” solution to the problem: When in doubt, introduce a gap. Gaps represent non-homologous positions in the sequence. They reflect the occurrence of point mutations, insertions/deletions or other rearrangements during the evolutionary process. Gapped positions should ideally be ignored by phylogenetic analysis methods, but they are not always.
 Obtaining Sequences for Multiple Sequence Alignments n There are many ways to obtain input sequences for multiple sequence alignments. One way would be using EBI’s SRS (Sequence Retrieval System).
 Input file format n n n Ideally, all the sequences that need to be aligned are contained in a single file. The multiple FASTA file format is the most common file format. If you get a file in a different format from somewhere you can use readseq (Don Gilbert) to reformat it to multiple FASTA. >EFT 1_SOYBN MAVSSATASSKLILLPHASSSSSLNSTPFRSSTTNTHKLTPLSSSFLHPTTVLRRTPSST TTPRRTFTVRAARGKFERKKPHVNIGTIGHVDHGKTTLTAALTMALAALGNSAPKKYDEI DAAPEERARGITINTATVEYETENRHYAHVDCPGHADYVKNMITGAAQMDGAILVVSGAD GPMPQTKEHIILAKQVGVPNMVVFLNKQDQVDDEELLQLVEIEVRDLLSSYEFPGDDTPI >EFTU_AGRTU MAKSKFERNKPHVNIGTIGHVDHGKTSLTAAITKYFGEFKAYDQIDAAPEEKARGITIST AHVEYETPARHYAHVDCPGHADYVKNMITGAAEMDGAILVCSAADGPMPQTREHILLARQ VGVPAIVVFLNKVDQVDDAELLELVELEVRELLSSYDFPGDDIPIIKGSALAALEDSDKK IGEDAIRELMAAVDAYIPTPERPIDQPFLMPIEDVFSISGRGTVVTGRVERGIVKVGEEV >EFTU_AQUAE MAKEKFERTKEHVNVGTIGHVDHGKSTLTSAITCVLAAGLVEGGKAKCFKYEEIDKAPEE KERGITINITHVEYETAKRHYAHVDCPGHADYIKNMITGAAQMDGAILVVSAADGPMPQT REHVLLARQVNVPYIVVFMNKCDMVDDEELLELVELEVRELLSKYEYPGDEVPVIRGSAL GALQELEQNSPGKWVESIKELLNAMDEYIPTPQREVDKPFLMPIEDVFSISGRGTVVTGR
 to Reformat Files") Using readseq (by Don Gilbert) to Reformat Files
Using readseq (by Don Gilbert) to Reformat Files
 EMBOSS: seqretall seqret and seqretall are the EMBOSS equivalents of readseq n Commandline and Web Interface n
 Pairwise Alignments All multiple alignment tools to date first create pairwise alignments n It may be necessary for you to align just two sequences n
 Programs EMBOSS Matcher n EMBOSS Stretcher n FASTA Align 0 n FASTA Lalign n
 Pairwise alignment programs compared Global Alignment Local Alignment ALIGN yes -- ALIGN 0 yes, fixes end problems -- LALIGN -- yes -- -- yes STRETCHER MATCHER
 A Few Words about EMBOSS • • • EMBOSS is a generic Bioinformatics Toolkit, which can be downloaded from sourceforge. net It was conceived by Peter Rice (EBI) and is maintained by a large community of Bioinformaticians It contains hundreds of applications (including the programs MATCHER and STRETCHER, which were just mentioned)
 STRETCHER at the EBI
 EMBOSS, The European Molecular Biology") EMBOSS Reference Rice P, Longden I, Bleasby A (2000) EMBOSS, The European Molecular Biology Open Software Suite. Trends Genet. 16: 276 -277
EMBOSS Reference Rice P, Longden I, Bleasby A (2000) EMBOSS, The European Molecular Biology Open Software Suite. Trends Genet. 16: 276 -277
 is probably") Early Automated Multiple Alignments: Clustalw n n Clustal. W (by Des Higgins) is probably the most frequently used multiple alignment program. Parameters like gap penalties can be defined by the user. Clustalw can be configured to produce output in multiple formats. The following slides show screenshots of a Clustal. W session. You have to log onto barnburner using ssh to repeat this session.
Early Automated Multiple Alignments: Clustalw n n Clustal. W (by Des Higgins) is probably the most frequently used multiple alignment program. Parameters like gap penalties can be defined by the user. Clustalw can be configured to produce output in multiple formats. The following slides show screenshots of a Clustal. W session. You have to log onto barnburner using ssh to repeat this session.
 Desmond Higgins
 T-coffee For Alignments n n n Combines local and global alignment Uses algorithms from Clustal. W and Lalign Can utilize PDB structure files during the alignment process Command line interface Works with mulitple FASTA files (amongst others) Can output PHYLIP interleaved files
 T-coffee command line use t-coffee sequence file n t-coffee – in=Pstructfile 1, Pstructfile 2, sequencefile n t-coffee –dpmode=myers_miller_pair_wise sequencefile n
 T-coffee variants M-coffee: combining multiple alignment methods into a single result n R-coffee: alignment of “noncoding” RNA n
 T-, M-, R-coffee Web server
 is") Creating Colored Alignments using Gene. Doc as an example Gene. Doc (Karl Nicholas) is a Windowsbased public domain program. n Gene. Doc can be used to manually edit (fine-tune) alignments and create ready to publish outputs. n The Gene. Doc homepage can be found at: http: //www. nrbsc. org/gfx/genedoc n
Creating Colored Alignments using Gene. Doc as an example Gene. Doc (Karl Nicholas) is a Windowsbased public domain program. n Gene. Doc can be used to manually edit (fine-tune) alignments and create ready to publish outputs. n The Gene. Doc homepage can be found at: http: //www. nrbsc. org/gfx/genedoc n
 A Word of Caution After downloading the Gene. Doc. zip file, put it into it’s OWN DIRECTORY or you will have many files in the directory that you downloaded to after you clicked on the file!
") Gene. Doc: Shading Modes (Physico. Chem. Property Mode)
Gene. Doc: Shading Modes (Physico. Chem. Property Mode)
") Gene. Doc: Shading Modes (Conservation Mode)
Gene. Doc: Shading Modes (Conservation Mode)
 Manual editing Automated alignment systems tend to produce the following situations: While we would probably all agree that the alignment below are “better”: Image source : http: //helix. biology. mcmaster. ca/721/outline 2/node 42. html
 Gene. Doc: Residue Edit Mode
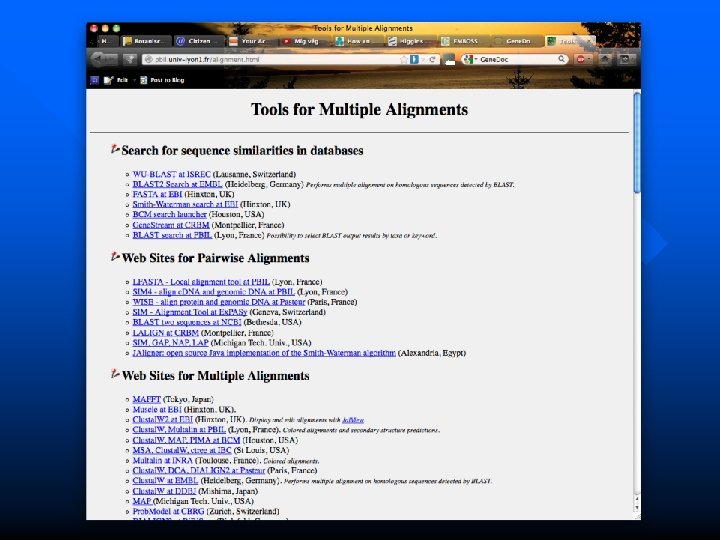
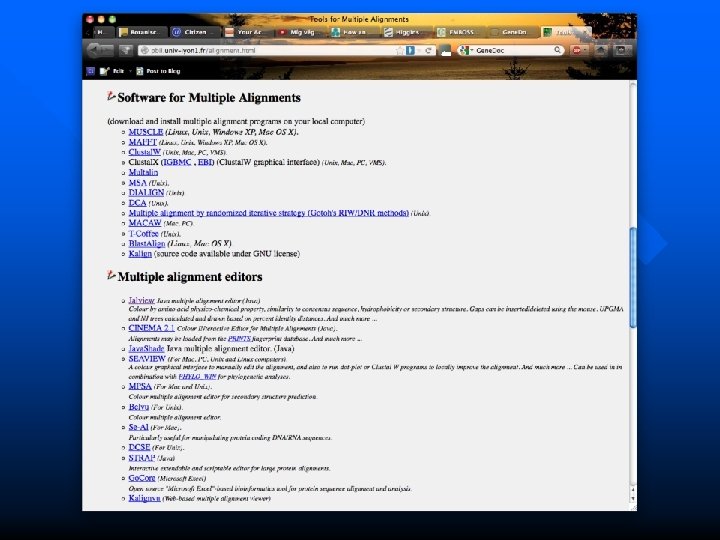
 Other useful alignment programs and editors http: //pbil. univ-lyon 1. fr/alignment. html
 Output File Formats: . msf Files Pile. Up MSF: Name: Name: Name: 486 Type: P EFTU_BACHD EFTU_BACSU EFTU_AGRTU EFTU_AQUAE EFTU_CHLPN EFT 1_SOYBN EFTU_ARATH EFTU_ASTLO EFTU_BRYPL EFTU_CHACO oo oo oo Check: Len: Len: Len: 486 486 486 8576 . . Check: Check: Check: 2183 3257 5362 5918 3366 7895 855 5152 7194 7394 Weight: Weight: Weight: 6. 9 10. 0 11. 6 13. 1 8. 5 10. 8 12. 4 10. 8 // EFTU_BACHD EFTU_BACSU EFTU_AGRTU EFTU_AQUAE EFTU_CHLPN EFT 1_SOYBN EFTU_ARATH EFTU_ASTLO EFTU_BRYPL EFTU_CHACO . . . MAVSSATASS MAISAPAACS. . . . . KLILLPHASS SSSRILCSYS. . . . . SSSLNSTPFR SPSPSLCPAI. . . . . SSTTNTHKLT STSGKLKTLT. . . . . PLSSSFLHPT. LSSSFLPSY. . . .
 Output File Formats: Phylip Interleaved Files 10 486 EFTU_BACHD EFTU_BACSU EFTU_AGRTU EFTU_AQUAE EFTU_CHLPN EFT 1_SOYBN EFTU_ARATH EFTU_ASTLO EFTU_BRYPL EFTU_CHACO -----------------------MAVSSATASS MAISAPAACS -------------------------------------KLILLPHASS SSSRILCSYS -------------------------------------SSSLNSTPFR SPSPSLCPAI -------------------------------------SSTTNTHKLT STSGKLKTLT -------------------------------------PLSSSFLHPT -LSSSFLPSY -------------------------------------TVLRRTPSST SLT--TTSAS --------------------------------TTPRRTFTVR QSTRRSFTVR ---------- MAKEKFDRSK MAKSKFERNK MAKEKFERTK -SKETFQRNK AARGKFERKK MSRQKFERIK ----- THANIGTIGH SHANIGTIGH PHVNIGTIGH EHVNVGTIGH PHINIGTIGH PHVNIGTIGH PHINIGTIGH ----- VDHGKTTLTA VDHGKTSLTA VDHGKSTLTS VDHGKTTLTA ---------- MAQEVFQRTK PHVNIGTIGH VDHGKTTLTA
 Phylogenetic Trees
 Topics Introduction n Markers n Distance Analysis n Parsimony Analysis n Maximum Likelihood Analysis n Making a tree with PHYLIP n Using Treeview n Useful Web Links n
 Introduction n The goal of phylogenetic analysis and phylogenetic treeing is the reconstruction of evolutionary processes.
 The Model The reconstruction of evolutionary processes is based on certain common knowledge and assumptions. n The assumptions critically influence the outcome of the process. n
 Important People for our Understanding of Phylogeny Charles Darwin Gregor Mendel Willi Hennig Joe Felsenstein 1809 -1882 1822 -1884 1913 -1976 *1942 Natural Selection Modern Genetics Segregation Independent Assortment Phylogenetic Systematics Phylogenetic Analysis
 Some Common Knowledge about Evolution n n The development of species is influenced by Natural Selection. New species separate from existing ones in a Dichotomous Way. Related species share a Common Ancestor. Evolutionary events are reflected in the Genetic Background. The blueprint of the genetic background is the Genome.
 Problems Most phylogenetic models assume that all species use sexual reproduction to multiply. n But that is a special case and many organismal groups from many different branches of the phylogenetic tree do not follow this schema. n Most models assume that lateral gene transfer occurs never or very rarely. n
 Homologs and Analogs If related organisms share a common ancestor, the markers that can be used to analyze their relationship also have to originate from the same structure. These markers are called Homologs. n Markers like wings (insects versus birds), which originated in parallel several times are called Analogs. n
 There are two different kinds of homologous markers. n The") Willi Hennig’s Contribution (Cladistics) There are two different kinds of homologous markers. n The first kind is called Symplesiomorphisms, the second kind Synapomorphisms. n
Willi Hennig’s Contribution (Cladistics) There are two different kinds of homologous markers. n The first kind is called Symplesiomorphisms, the second kind Synapomorphisms. n
 Symplesiomorphic Markers All Insects have wings. n All mammals have a brain. n All fish have fins… n These markers cannot be used to reconstruct evolution inside the clade. Grouping these markers together would be what a Cluster Analysis would attempt.
 Synapomorphic Markers n Mammals have four legs, while birds have two legs and two wings. The wings and the legs originate from the same ancestral structures. Thus this marker can be used to distinguish the birds and the mammals. These two groups share a common ancestor. Only Synapomorphisms can be used for Phylogenetic Systematics.
 Markers for Phylogenetic Analysis n All biological structures that are homologous and synapomorphic can theoretically be used as Markers.
 Non -Molecular Phenotypic markers n Physiology n Biochemistry n Behavior") Frequently Used Markers (1) Non -Molecular Phenotypic markers n Physiology n Biochemistry n Behavior n Most non-molecular markers are encoded in binary matrices (yes/no).
Frequently Used Markers (1) Non -Molecular Phenotypic markers n Physiology n Biochemistry n Behavior n Most non-molecular markers are encoded in binary matrices (yes/no).
 Molecular Markers DNA: n Restriction Analysis n PCR-based markers (RFLP") Frequently Used Markers (2) Molecular Markers DNA: n Restriction Analysis n PCR-based markers (RFLP etc. ) n Sequence Protein: n Sequence n Structure (very rarely)
Frequently Used Markers (2) Molecular Markers DNA: n Restriction Analysis n PCR-based markers (RFLP etc. ) n Sequence Protein: n Sequence n Structure (very rarely)
 Markers in Multiple Alignments
 Sequence-based Markers Homologous positions in an alignment are potential sites for molecular markers. n In most cases it is assumed that all positions in a sequence develop independently, thus each column in an alignment represents a different marker! n
 Sequence Markers Marker Positions: These are not Markers: GG GG GC AC AA GA GGGG GGAGACA GGTG
 PHYLIP n n n PHYLIP by Joe Felsenstein is the major software package for phylogenetic analysis. The package supports binary and sequence data. It supports Distance, Parsimony and Maximum Likelihood analyses. The package allows bootstrapping and other statistical tests. The following slides are excerpts from the PHYLIP manual.
 n DNADIST: This program uses nucleotide sequences to compute a distance") Distance Methods (1) n DNADIST: This program uses nucleotide sequences to compute a distance matrix, under three different models of nucleotide substitution. The distance for each pair of species estimates the total branch length between the two species, and can be used in the distance matrix programs FITCH, KITSCH or NEIGHBOR. This is an alternative to use of the sequence data itself in the maximum likelihood program DNAML or the parsimony program DNAPARS.
Distance Methods (1) n DNADIST: This program uses nucleotide sequences to compute a distance matrix, under three different models of nucleotide substitution. The distance for each pair of species estimates the total branch length between the two species, and can be used in the distance matrix programs FITCH, KITSCH or NEIGHBOR. This is an alternative to use of the sequence data itself in the maximum likelihood program DNAML or the parsimony program DNAPARS.
 n The programs FITCH, KITSCH, and NEIGHBOR are for dealing with") Distance Methods (2) n The programs FITCH, KITSCH, and NEIGHBOR are for dealing with data which comes in the form of a matrix of pair wise distances between all pairs of taxa, such as distances based on molecular sequence data, gene frequency genetic distances, amounts of DNA hybridization, or immunological distances.
Distance Methods (2) n The programs FITCH, KITSCH, and NEIGHBOR are for dealing with data which comes in the form of a matrix of pair wise distances between all pairs of taxa, such as distances based on molecular sequence data, gene frequency genetic distances, amounts of DNA hybridization, or immunological distances.
 Distance Assumptions 1. 2. Each distance is measured independently from the others: no item of data contributes to more than one distance. The distance between each pair of taxa is drawn from a distribution with an expectation which is the sum of values (in effect amounts of evolution) along the tree from one tip to the other. The variance of the distribution is proportional to a power p of the expectation.
 Parsimony Methods n DNAPARS and PROTPARS: These programs carry out unrooted parsimony (analogous to Wagner trees) (Eck and Dayhoff, 1966; Kluge and Farris, 1969) on DNA or protein sequences. The method of Fitch (1971) is used to count the number of changes of base needed on a given tree. The assumptions of this method are analogous to those of MIX:
 Parsimony Assumptions 1. 2. 3. 4. 5. Each site evolves independently. Different lineages evolve independently. The probability of a base substitution at a given site is small over the lengths of time involved in a branch of the phylogeny. The expected amounts of change in different branches of the phylogeny do not vary by so much that two changes in a high-rate branch are more probable than one change in a low-rate branch. The expected amounts of change do not vary enough among sites that two changes in one site are more probable than one change in another.
 Maximum Likelihood Methods n This program implements the maximum likelihood method for DNA sequences. The present version is faster than earlier versions of DNAML. Details of the algorithm of a previous version of DNAML are described in my paper in Journal of Molecular Evolution (1981 a). For some uses of this program and further developments, the papers of Masami Hasegawa and Hirohisa Kishino are particularly instructive (Hasegawa and Yano, 1984 a, 1984 b; Hasegawa et. al. 1985 a, 1985 b; Kishino and Hasegawa, 1989). My 1981 algorithm is similar to the present one, except that it did not allow for different rates of transitions and transversions and for different rates of evolution at different sites.
 Maximum Likelihood Assumptions 1. 2. 3. 4. 5. Each site in the sequence evolves independently. Different lineages evolve independently. Each site undergoes substitution at an expected rate which is chosen from a series of rates (each with a probability of occurrence) which we specify. All relevant sites are included in the sequence, not just those that have changed or those that are "phylogenetically informative". A substitution consists of one of two sorts of events: (a) The first kind of event consists of the replacement of the existing base by a base drawn from a pool of purines or a pool of pyrimidines (depending on whether the base being replaced was a purine or a pyrimidine). It can lead either to no change or to a transition. (b) The second kind of event consists of the replacement of the existing base by a base drawn at random from a pool of bases at known frequencies, independently of the identity of the base which is being replaced. This could lead either to a no change, to a transition or to a transversion.
 Transitions and Transversions Transitions are base exchanges where Purines get exchanged against Purines and Pyrimidines against Pyrimidines. n Transversions are exchanges of Purines against Pyrimidines and vice versa. n The transition/transversion ratio differs from molecule to molecule. The ratio plays a critical role in some phylogenetic analyses. n
 The PHYLIP command line PHYLIP is a command line driven system. n It consists of approximately 25 programs. n Each program (with very few exceptions) expects a file called “infile” as the input. n The programs will put the results into a file called “outfile”. n Programs also may produce a “treefile”. n The drawing programs produce a “plotfile”. n
 Creating a DNA-based tree
 Creating a Protein-based Tree
 Bootstrapping is a commonly used method to assess the robustness of a dataset. n In general, half of the positions is randomly picked from the dataset many times (usually 1000 times), then trees are built on the reduced datasets. n In the last step, the trees are overlaid and the general tree topology is statistically assessed. n
 Creating a Bootstrapped Tree
 Example 1: DNA Distance n We can use our previously created Clustal. W output to calculate a Distance Tree.
 The first PHYLIP infile 10 486 EFTU_BACHD ---------- -----EFTU_BACSU ---------- -----EFTU_AGRTU ---------- -----EFTU_AQUAE ---------- -----EFTU_CHLPN ---------- -----EFT 1_SOYBN MAVSSATASS KLILLPHASS SSSLNSTPFR SSTTNTHKLT PLSSSFLHPT EFTU_ARATH MAISAPAACS SSSRILCSYS SPSPSLCPAI STSGKLKTLT -LSSSFLPSY EFTU_ASTLO ---------- -----EFTU_BRYPL ---------- -----EFTU_CHACO ---------- ---------- MAKEKFDRSK THANIGTIGH VDHGKTTLTA ---------- MAKEKFDRSK SHANIGTIGH VDHGKTTLTA ---------- MAKSKFERNK PHVNIGTIGH VDHGKTSLTA ---------- MAKEKFERTK EHVNVGTIGH VDHGKSTLTS ---------- -SKETFQRNK PHINIGTIGH VDHGKTTLTA TVLRRTPSST TTPRRTFTVR AARGKFERKK PHVNIGTIGH VDHGKTTLTA SLT--TTSAS QSTRRSFTVR AARGKFERKK PHVNIGTIGH VDHGKTTLTA ---------- MSRQKFERIK PHINIGTIGH VDHGKTTLTA ---------- ---------- MAQEVFQRTK PHVNIGTIGH VDHGKTTLTA
 Invoke dnadist
 Toggle Parameters of Interest
 Type “y” when you are done to start the analysis
 Examine the outfile
 Prepare for the next steps Move the “infile” to 18 S. aln n Move the “outfile” to “infile” n Start “fitch” n
 Invoke fitch
 Type “y” when you are done changing parameters
 The new outfile contains the Treeing Results 10 Populations Fitch-Margoliash method version 3. 53 c __ __ Sum of squares = 2 (Obs - Exp) /_ /_ ------2 i j Obs Negative branch lengths not allowed +AF 093009 ! ! +AF 096274 ! +-------------------8 ! +--7 ! ! ! +--6 ! ! ! +--5 ! +----AF 093013 ! +----AF 093014 +-AF 082177
 A second file, called “treefile” contains the Newick-formatted tree (AF 093009: 0. 00616, ((((((AF 096274: 0. 06144, AF 082177: 0. 11596): 1. 94117, AF 093013: 0. 42539): 0. 04901, AF 093014: 0. 46844): 0. 08179, AF 093015: 0. 34817): 0. 09724, (AF 093012: 0. 00555, AF 093011: 0. 00215): 0. 16205): 0. 07399, AF 093010: 0. 03935): 0. 03239, AF 093008: 0. 00174);
 Using Tree. View to create a nicelooking tree Tree. View is a PC and Macintosh program. n http: //taxonomy. zoology. gla. ac. uk/rod/treev iew. html n Similar to Gene. Doc, the final output is better produced in the personal computer environment, even though PHYLIP has it’s own programs (drawgram and drawtree) to make printable trees. n
") The two most commonly used tree displays (show internal labels)
The two most commonly used tree displays (show internal labels)
 Useful Web links n n n PHYLIP: http: //evolution. genetics. washington. edu/phylip. html Tree. View: http: //taxonomy. zoology. gla. ac. uk/ Tree of Life: http: //phylogeny. arizona. edu/tree/phylogeny. html